性能工具之 Kafka 快速 BenchMark 测试示例

一、什么是 Kafka?
消息队列(Message Queue)简称 MQ,是一种跨进程的通信机制,通常用于应用程序间进行数据的异步传输,MQ 产品在架构中通常也被叫作“消息中间件”。它的最主要职责就是保证服务间进行可靠的数据传输,同时实现服务间的解耦。
在架构领域,很多厂商都开发了自己的 MQ 产品,最具代表性的开源产品有:
- Kafka
- ActiveMQ
- ZeroMQ
- RabbitMQ
- RocketMQ
每一种产品都有自己不同的设计与实现原理,但根本的目标都是相同的:为进程间通信提供可靠的异步传输机制。Kafka 是最受欢迎的开源消息中间件之一,在全球范围内被广泛应用。
一个消息队列 Kafka 集群包括 Producer、Kafka Broker、Consumer Group、Zookeeper。

(图片来自于网络)
二、 Benchmark 测试工具
本文主要介绍如何利用 Kafka 自带的性能测试脚本测试Kafka的性能,以及如何使用 Kafdrop 监控 Kafka 的工作状态,最后给出了Kafka的Benchmark测试数据。
在 Kafka 安装目录 $KAFKA_HOME/bin/ 有以下跟性能相关的测试脚本:
#生产者和消费者的性能测试工具
kafka-producer-perf-test.sh
kafka-consumer-perf-test.sh

#用来测试生产者和消费者功能的,现使用率很低。
kafka-verifiable-consumer.sh
kafka-verifiable-producer.sh

# Kafka 的测试框架,用于执行各种基准测试和负载测试。一般的 Kafka 用户应该用不到这个脚本。
trogdor.sh
windows
本次我们测试主要使用以下两个脚本:
1、kafka-producer-perf-test.sh:用于测试Kafka Producer的性能,主要输出4项指标,总共发送消息量(以MB为单位),每秒发送消息量(MB/second),发送消息总数,每秒发送消息数(records/second)。
主要参数如下:
[root@data-server bin]# ./kafka-producer-perf-test.sh
usage: producer-performance [-h] --topic TOPIC --num-records NUM-RECORDS [--payload-delimiter PAYLOAD-DELIMITER] --throughput THROUGHPUT
                            [--producer-props PROP-NAME=PROP-VALUE [PROP-NAME=PROP-VALUE ...]] [--producer.config CONFIG-FILE] [--print-metrics]
                            [--transactional-id TRANSACTIONAL-ID] [--transaction-duration-ms TRANSACTION-DURATION] (--record-size RECORD-SIZE |
                            --payload-file PAYLOAD-FILE)

This tool is used to verify the producer performance.

optional arguments:
  -h, --help             show this help message and exit
  --topic TOPIC          produce messages to this topic
  --num-records NUM-RECORDS
                         number of messages to produce
  --payload-delimiter PAYLOAD-DELIMITER
                         provides delimiter to be used when --payload-file is provided. Defaults  to  new  line. Note that this parameter will be ignored if --
                         payload-file is not provided. (default: \n)
  --throughput THROUGHPUT
                         throttle maximum message throughput to *approximately* THROUGHPUT messages/sec. Set this to -1 to disable throttling.
  --producer-props PROP-NAME=PROP-VALUE [PROP-NAME=PROP-VALUE ...]
                         kafka producer related configuration properties like bootstrap.servers,client.id etc.  These configs take precedence over those passed
                         via --producer.config.
  --producer.config CONFIG-FILE
                         producer config properties file.
  --print-metrics        print out metrics at the end of the test. (default: false)
  --transactional-id TRANSACTIONAL-ID
                         The transactionalId to use if  transaction-duration-ms  is  >  0.  Useful  when  testing  the  performance of concurrent transactions.
                         (default: performance-producer-default-transactional-id)
  --transaction-duration-ms TRANSACTION-DURATION
                         The max age of each transaction. The commitTransaction will be  called  after  this time has elapsed. Transactions are only enabled if
                         this value is positive. (default: 0)

  either --record-size or --payload-file must be specified but not both.

  --record-size RECORD-SIZE
                         message size in bytes. Note that you must provide exactly one of --record-size or --payload-file.
  --payload-file PAYLOAD-FILE
                         file to read the message payloads from. This works only  for  UTF-8  encoded  text  files.  Payloads will be read from this file and a
                         payload will be randomly selected when sending messages. Note that you must provide exactly one of --record-size or --payload-file.
2、kafka-consumer-perf-test.sh:用于测试Kafka Consumer的性能,测试指标与Producer性能测试脚本一样
主要参数如下:
[root@data-server bin]# ./kafka-consumer-perf-test.sh
Missing required option(s) [bootstrap-server]
Option                                   Description
------                                   -----------
--bootstrap-server <String: server to    REQUIRED unless --broker-list
  connect to>                              (deprecated) is specified. The server
                                           (s) to connect to.
--broker-list <String: broker-list>      DEPRECATED, use --bootstrap-server
                                           instead; ignored if --bootstrap-
                                           server is specified. The broker list
                                           string in the form HOST1:PORT1,HOST2:
                                           PORT2.
--consumer.config <String: config file>  Consumer config properties file.
--date-format <String: date format>      The date format to use for formatting
                                           the time field. See java.text.
                                           SimpleDateFormat for options.
                                           (default: yyyy-MM-dd HH:mm:ss:SSS)
--fetch-size <Integer: size>             The amount of data to fetch in a
                                           single request. (default: 1048576)
--from-latest                            If the consumer does not already have
                                           an established offset to consume
                                           from, start with the latest message
                                           present in the log rather than the
                                           earliest message.
--group <String: gid>                    The group id to consume on. (default:
                                           perf-consumer-20126)
--help                                   Print usage information.
--hide-header                            If set, skips printing the header for
                                           the stats
--messages <Long: count>                 REQUIRED: The number of messages to
                                           send or consume
--num-fetch-threads <Integer: count>     DEPRECATED AND IGNORED: Number of
                                           fetcher threads. (default: 1)
--print-metrics                          Print out the metrics.
--reporting-interval <Long:              Interval in milliseconds at which to
  interval_ms>                             print progress info. (default: 5000)
--show-detailed-stats                    If set, stats are reported for each
                                           reporting interval as configured by
                                           reporting-interval
--socket-buffer-size <Integer: size>     The size of the tcp RECV size.
                                           (default: 2097152)
--threads <Integer: count>               DEPRECATED AND IGNORED: Number of
                                           processing threads. (default: 10)
--timeout [Long: milliseconds]           The maximum allowed time in
                                           milliseconds between returned
                                           records. (default: 10000)
--topic <String: topic>                  REQUIRED: The topic to consume from.
--version                                Display Kafka version.
三、 Benchmark 测试场景
测试环境说明:
- 前置条件:1个Broker(节点),1个Topic(主题),3个Partition(分区),无Replication(副本),异步模式,消息Payload为300字节,消息数量5000万(Kafka设置保持与生产环境一致)
- 被测版本:bitnami/kafka:2.8.1 被测服务器:通用计算型 | 8vCPUs | 16GiB | s3.2xlarge.2 | 通用型SSD | 300 GiB IOPS上限5,400,IOPS突发上限8,000 ,最大吞吐量 250 MB/s
- 测试客户端:通用计算型 | 8vCPUs | 16GiB | s3.2xlarge.2 | 通用型SSD | 500 GiB IOPS上限7,800,IOPS突发上限8,000,最大吞吐量 250 MB/s
- 测试工具:Kafka自带的基准工具
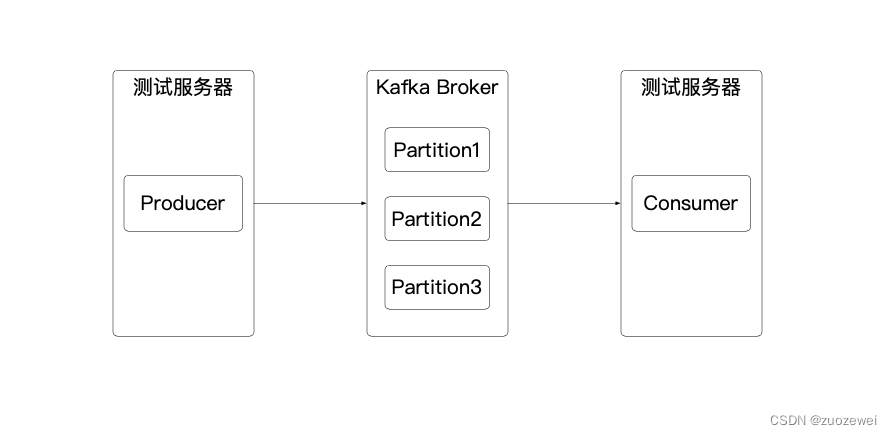
(简要测试拓扑)
1、生产者基准测试
测试项目:Kafka Producer 性能基准测试
测试目标:测试设置测试参数:acks=1,消息Payload为300字节,消息数量5000万时Producer时的吞吐量
./kafka-producer-perf-test.sh --topic zuozewei --num-records 50000000 --throughput -1 --record-size 300 --producer-props bootstrap.servers=192.168.1.213:9092 acks=1
相关参数解释如下:
--topic 指定topic
--num-records	指定生产数据量
--throughput	指定吞吐量(-1表示无限制)
--record-size   record数据大小
--producer-props key=value	指定producer服务地址配置,该命令允许你在后面指定要设置的生产者参数,比如压缩算法、延时时间等。
--acks  指定发送出去的消息的持久化机制
补充下 acks 的几种参数的解释:
- acks=0:不管写入broker的消息到底成功与否,发送一条消息出去,立马就可以发送下一条消息,吞吐量最高的方式,会发生消息丢失;
- acks=all/acks=-1:leader写入成功以后,必须等待其他ISR中的副本都写入成功,才可以返回响应说这条消息写入成功了,此时会收到一个回调通知;
- acks=1:只要leader写入成功,就认为消息成功了,默认值,会发生消息丢失。
测试结果如下:
[root@data-server bin]# ./kafka-producer-perf-test.sh --topic zuozewei --num-records 50000000 --throughput -1 --record-size 300 --producer-props bootstrap.servers=192.168.1.213:9092 acks=1
1823612 records sent, 364722.4 records/sec (104.35 MB/sec), 2.0 ms avg latency, 412.0 ms max latency.
2289024 records sent, 457804.8 records/sec (130.98 MB/sec), 1.4 ms avg latency, 52.0 ms max latency.
2300541 records sent, 460108.2 records/sec (131.64 MB/sec), 1.2 ms avg latency, 30.0 ms max latency.
2306616 records sent, 461323.2 records/sec (131.99 MB/sec), 1.1 ms avg latency, 18.0 ms max latency.
2242778 records sent, 448555.6 records/sec (128.33 MB/sec), 1.1 ms avg latency, 16.0 ms max latency.
2140578 records sent, 428115.6 records/sec (122.48 MB/sec), 1.2 ms avg latency, 19.0 ms max latency.
2222668 records sent, 444533.6 records/sec (127.18 MB/sec), 1.2 ms avg latency, 28.0 ms max latency.
2205768 records sent, 441153.6 records/sec (126.22 MB/sec), 1.2 ms avg latency, 18.0 ms max latency.
2181274 records sent, 436254.8 records/sec (124.81 MB/sec), 1.4 ms avg latency, 52.0 ms max latency.
2094473 records sent, 418894.6 records/sec (119.85 MB/sec), 1.4 ms avg latency, 17.0 ms max latency.
2024219 records sent, 404843.8 records/sec (115.83 MB/sec), 1.4 ms avg latency, 14.0 ms max latency.
2000186 records sent, 400037.2 records/sec (114.45 MB/sec), 1.7 ms avg latency, 29.0 ms max latency.
1913048 records sent, 382609.6 records/sec (109.47 MB/sec), 2.4 ms avg latency, 71.0 ms max latency.
2125272 records sent, 425054.4 records/sec (121.61 MB/sec), 1.4 ms avg latency, 19.0 ms max latency.
2191209 records sent, 438241.8 records/sec (125.38 MB/sec), 1.2 ms avg latency, 15.0 ms max latency.
2243998 records sent, 448799.6 records/sec (128.40 MB/sec), 1.2 ms avg latency, 22.0 ms max latency.
2165062 records sent, 433012.4 records/sec (123.89 MB/sec), 1.1 ms avg latency, 17.0 ms max latency.
2059370 records sent, 411874.0 records/sec (117.84 MB/sec), 1.2 ms avg latency, 18.0 ms max latency.
2182918 records sent, 436583.6 records/sec (124.91 MB/sec), 1.3 ms avg latency, 26.0 ms max latency.
2169204 records sent, 433840.8 records/sec (124.12 MB/sec), 1.4 ms avg latency, 26.0 ms max latency.
2100874 records sent, 420174.8 records/sec (120.21 MB/sec), 1.2 ms avg latency, 12.0 ms max latency.
2056641 records sent, 411328.2 records/sec (117.68 MB/sec), 1.5 ms avg latency, 21.0 ms max latency.
2059852 records sent, 411970.4 records/sec (117.87 MB/sec), 1.6 ms avg latency, 26.0 ms max latency.
50000000 records sent, 426686.692495 records/sec (122.08 MB/sec), 1.37 ms avg latency, 412.00 ms max latency, 1 ms 50th, 2 ms 95th, 9 ms 99th, 24 ms 99.9th.
[root@data-server bin]#
测试结果会打印出测试生产者的吞吐量 (MB/s)、消息发送延时以及各种分位数下的延时。一般情况下,消息延时不是一个简单的数字,而是一组分布,而我们应该关心延时的概率分布情况,仅仅知道一个平均值是没有意义的,这里我们关注到99th 分位就可以了。比如在上面的输出中,99th 值是 9 ms,这表明测试生产者生产的消息中,有 99% 消息的延时都在 9 ms 以内。我们完全可以把这个数据当作这个生产者对外承诺的 SLA。
简要解析以上结果:数据:5000万,平均吞吐量(TPS):约 42 万条/秒,99.9th(百分位)延时:9 毫秒,平均速率:122 MB/s
Kafdrop 服务端监控截图:

我们可以看到5000万条数据全部被 Broker 接收。
消息服务器资源监控截图:
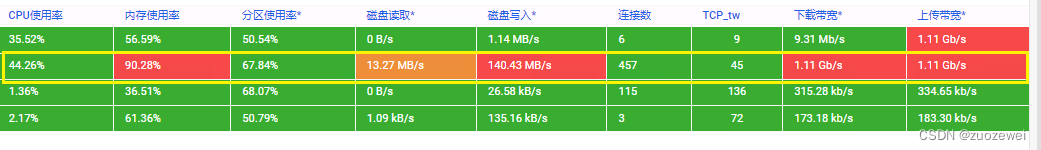
我们可以一个 Broker 的 CPU 使用量约为 44 %,内存使用率为 90%,磁盘写入速率为149 MB/s。
2、消费者基准测试
测试命令如下:
./kafka-consumer-perf-test.sh --topic zuozewei --threads 1 --messages 50000000 --broker-list 192.168.1.213:9092
相关参数解释如下:
--topic 指定topic
--threads 指定线程数
--messages 指定消费数据条数
--broker-list kafka broker列表地址
[root@data-server bin]# ./kafka-consumer-perf-test.sh --topic zuozewei --threads 1 --messages 50000000  --broker-list 192.168.1.213:9092
WARNING: option [threads] and [num-fetch-threads] have been deprecated and will be ignored by the test
start.time, end.time, data.consumed.in.MB, MB.sec, data.consumed.in.nMsg, nMsg.sec, rebalance.time.ms, fetch.time.ms, fetch.MB.sec, fetch.nMsg.sec
2024-04-18 16:17:58:373, 2024-04-18 16:19:03:556, 14305.1147, 219.4608, 50000000, 767071.1689, 452, 64731, 220.9933, 772427.4304
消费者测试结果输出格式与生产者有所差别,但该脚本也会打印出消费者的吞吐量数据。比如本例中的 1723MB/s。有点令人遗憾的是,它没有计算不同分位数下的分布情况。
把以上结果整理成表格如下:

简要解析以上结果:数据:5000万,平均吞吐量(TPS):约 77 万条/秒,平均速率:221 MB/s
Kafdrop 服务端监控截图:
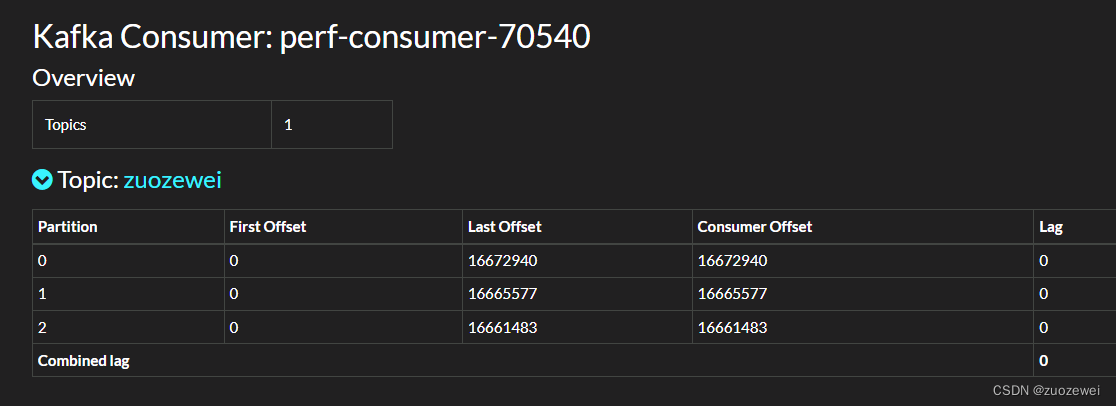
毫无疑问,kafka消费者进度监控的最重要的监控指标为消费者 lag,即所谓滞后程度,就是指消费者当前落后于生产者的程度,比方说,Kafka 生产者向某主题成功生产了 100 万条消息,你的消费者当前消费了 80 万条消息,那么我们就说你的消费者滞后了 20 万条消息,即 Lag 等于 20 万。
目前我们看到 lag 该列所有值都是 0,因为这表明我们的消费者完全没有任何滞后。
消息服务器资源监控截图:

我们可以一个 Broker 的 CPU 使用量约为 33 %,内存使用率为 90%,磁盘写入速率为160 MB/s。
四、小结
好了,今天我们一起梳理了 kafka 2.8.1 版本自带的 BenchMark 测试脚本,我们熟悉了常见的性能测试的工具行命令。希望这些命令在工作做 Kafka 集群BenchMark测试有所帮助。

- 点赞
- 收藏
- 关注作者
评论(0)