俄罗斯世界出口 探索性数据分析

【摘要】 try : import circlify import pandas_profiling import ploty.expressexcept : !pip install circlify -i https://pypi.tuna.tsinghua.edu.cn/simple --user !pip install pandas_profiling -i ...
try :
    import circlify
    import pandas_profiling
    import ploty.express
except :
    !pip install circlify -i https://pypi.tuna.tsinghua.edu.cn/simple  --user
    !pip install pandas_profiling -i https://pypi.tuna.tsinghua.edu.cn/simple  --user
    !pip install plotly.express -i https://pypi.tuna.tsinghua.edu.cn/simple  --user
    !pip install -U pandas -i https://pypi.tuna.tsinghua.edu.cn/simple  --user

import warnings
warnings.filterwarnings("ignore")
🚢 俄罗斯世界出口 探索性数据分析 📈

数据集介绍 📋
- 此数据为干净
- 数据包括俄罗斯对世界的出口
i. 225 合作国家
ii. ~20 年度
iii. ~3000 独特的商品 SITC Code description- Link to dataset
!python --version
Python 3.7.12
import pandas as pd
import numpy as np
from plotly import express as px
import seaborn as sns
import matplotlib.pyplot as plt
%matplotlib inline
convert_dtypes() pandas
- pandas 默认 读取文本数据时,会自动读成object。
- 通过convert_dtypes()可以自动读成最新支持的类型,string
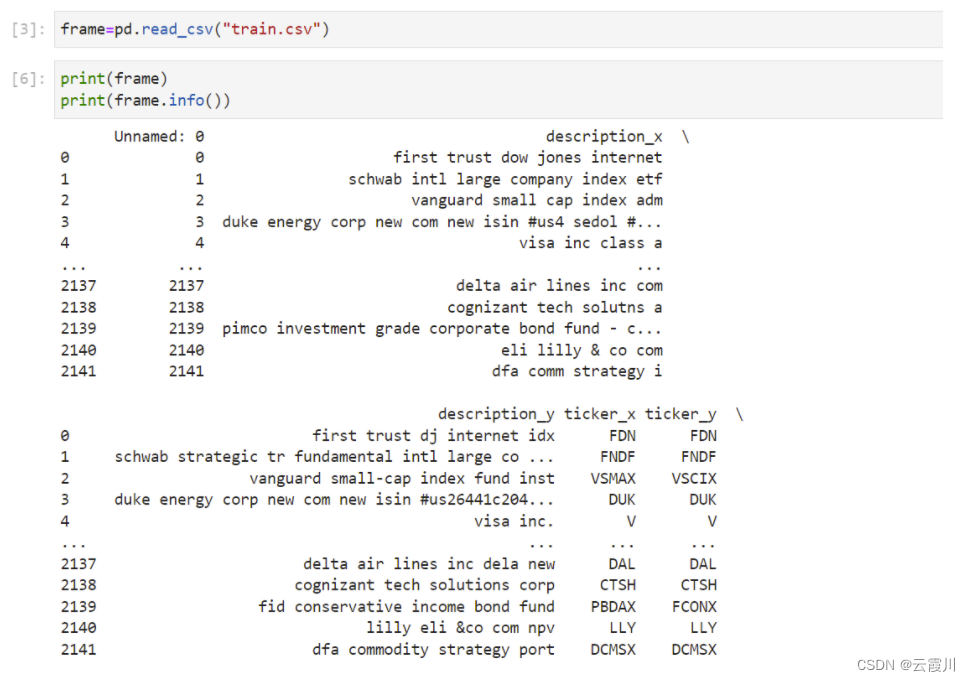
dataframe = pd.read_csv('/home/mw/input/Soviet_70yrs4904/RUStoWorldTrade.csv',
usecols=['Year','Aggregate Level','Reporter ISO','Partner','Partner ISO','Commodity Code','Commodity','Qty Unit','Qty','Netweight (kg)','Trade Value (US$)'])
dataframe = dataframe.convert_dtypes()
数据预处理 📋
数据集庞大,包含130万个数据点,因此它具有 650mb的高内存使用率, 我们将使用作者提供的 Starter Code 代码来优化性能。它将把数据类型转换为更小的数据类型,并帮助我们从 五个聚合级别中选择一个 and 并将内存使用率降低95%
| Aggregate Level | Level Name | Code Format | Number of Items |
|---|---|---|---|
| 1 | Section | 0 | 10 Items |
| 2 | Division | 01 | 67 Items |
3 |
Group |
012 |
261 Items |
| 4 | Subgroup | 012.1 | 1033 Items |
| 5 | Item | 012.13 | 3121 Items |
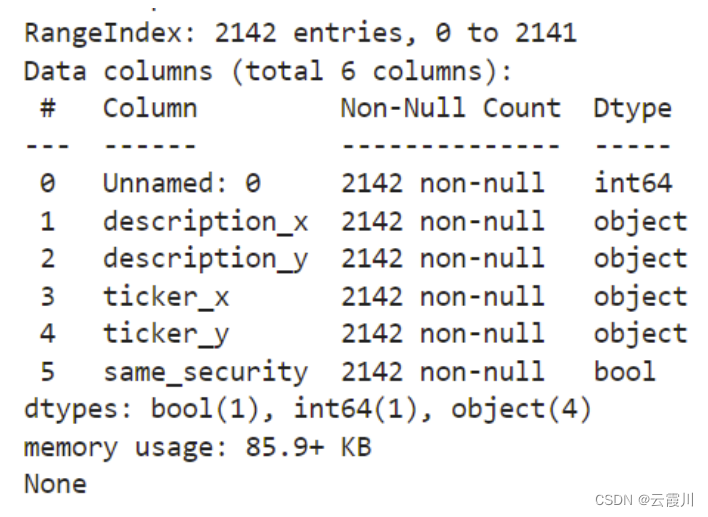
info
- Dataframe对象调用info()会显示DataFrame的内存是哟航情况。
- memory_usage='deep’将启用更准确的内存使用报告,将更费内存。
通过memory_usage,查看各列内存使用量,然后就可以针对性进行内存优化了。
dataframe.info(memory_usage='deep')
<class 'pandas.core.frame.DataFrame'>
RangeIndex: 1384603 entries, 0 to 1384602
Data columns (total 11 columns):
 #   Column             Non-Null Count    Dtype
---  ------             --------------    -----
 0   Year               1384603 non-null  Int64
 1   Aggregate Level    1384603 non-null  Int64
 2   Reporter ISO       1384603 non-null  string
 3   Partner            1384603 non-null  string
 4   Partner ISO        1375914 non-null  string
 5   Commodity Code     1384603 non-null  object
 6   Commodity          1384603 non-null  string
 7   Qty Unit           1384603 non-null  string
 8   Qty                1283894 non-null  Int64
 9   Netweight (kg)     1323567 non-null  Int64
 10  Trade Value (US$)  1384603 non-null  Int64
dtypes: Int64(5), object(1), string(5)
memory usage: 638.8 MB
for col in dataframe.columns:
    if dataframe[col].dtype == 'Float64':
        dataframe[col] = dataframe[col].astype('float16')
    try :
        if dataframe[col].dtype == 'Int64':
            dataframe[col] = dataframe[col].astype('int16')
    except :
        dataframe[col] = dataframe[col].astype('float16')
dataframe.drop(dataframe[dataframe['Commodity Code'] == 'TOTAL'].index, inplace=True)
dataframe['Commodity Code'] = dataframe['Commodity Code'].astype('float16')
dataframe.info()
<class 'pandas.core.frame.DataFrame'>
Int64Index: 1384426 entries, 0 to 1384602
Data columns (total 11 columns):
 #   Column             Non-Null Count    Dtype
---  ------             --------------    -----
 0   Year               1384426 non-null  int16
 1   Aggregate Level    1384426 non-null  int16
 2   Reporter ISO       1384426 non-null  string
 3   Partner            1384426 non-null  string
 4   Partner ISO        1375737 non-null  string
 5   Commodity Code     1384426 non-null  float16
 6   Commodity          1384426 non-null  string
 7   Qty Unit           1384426 non-null  string
 8   Qty                1283826 non-null  float16
 9   Netweight (kg)     1323499 non-null  float16
 10  Trade Value (US$)  1384426 non-null  int16
dtypes: float16(3), int16(3), string(5)
memory usage: 79.2 MB
df = dataframe[dataframe['Aggregate Level']==2]
iso = pd.read_csv('/home/mw/input/Soviet_70yrs4904/iso3.csv')
iso.drop(axis=1, columns=['FIPS','ISO (2)','ISO (No)','Internet','Note','Capital'], inplace=True)

continents = ['Asia', 'Europe', 'Africa', 'Oceania', 'Americas']
for x in continents:
    y = iso[iso['Continent'] == x]
    m = df['Partner ISO'].isin(y['ISO (3)'])
    df.loc[m, 'Continent'] = x

Region = ['South Asia', 'South East Europe', 'Northern Africa', 'Pacific',
       'South West Europe', 'Southern Africa', 'West Indies',
       'South America', 'South West Asia', 'Central Europe',
       'Eastern Europe', 'Western Europe', 'Central America',
       'Western Africa', 'South East Asia', 'Central Africa',
       'North America', 'East Asia', 'Indian Ocean', 'Northern Europe',
       'Eastern Africa', 'Southern Europe', 'Central Asia',
       'Northern Asia']

for x in Region:
    y = iso[iso['Region'] == x]
    m = df['Partner ISO'].isin(y['ISO (3)'])
    df.loc[m, 'Region'] = x
此外,我们将 使用提供的iso3数据集将Continents和SubContinents 添加到数据集中
在我们的操作之后,内存使用量已经减少了95%,降至40mb
df.info(memory_usage='deep')
<class 'pandas.core.frame.DataFrame'>
Int64Index: 79030 entries, 11 to 1384534
Data columns (total 13 columns):
 #   Column             Non-Null Count  Dtype
---  ------             --------------  -----
 0   Year               79030 non-null  int16
 1   Aggregate Level    79030 non-null  int16
 2   Reporter ISO       79030 non-null  string
 3   Partner            79030 non-null  string
 4   Partner ISO        78318 non-null  string
 5   Commodity Code     79030 non-null  float16
 6   Commodity          79030 non-null  string
 7   Qty Unit           79030 non-null  string
 8   Qty                31621 non-null  float16
 9   Netweight (kg)     31556 non-null  float16
 10  Trade Value (US$)  79030 non-null  int16
 11  Continent          74838 non-null  object
 12  Region             74838 non-null  object
dtypes: float16(3), int16(3), object(2), string(5)
memory usage: 38.5 MB
Pandas Profiling 📋
了解数据,使用交互式元素进行浏览 🔬
pandas df.describe() 函数 很强大,但对于严肃的探索性数据分析来说,这是一点基础。 pandas_profiling 用扩展pandad数据帧。profile_report()于快速数据分析。
year_list = [2010,2012,2014,2016,2018,2020]
top_countries_by_year = df[df['Year'].isin(year_list)]
top_countries_by_year = top_countries_by_year[top_countries_by_year['Trade Value (US$)'] >= 0]
top_countries_by_year = top_countries_by_year.groupby(['Year','Partner ISO']).agg({'Trade Value (US$)':'sum'}) ; top_countries_by_year.reset_index(inplace=True)
top_countries_by_year.sort_values(by=['Year','Trade Value (US$)'],ascending=[True,False], inplace=True)
top_countries_by_year = top_countries_by_year.groupby('Year').head(1)
EDA | 探索性数据分析 Exploratory Data Analysis 📊
I. 历年俄罗斯出口贸易价值 📅
俄罗斯总体上能够保持稳定的贸易价值, 贸易额在 5-800万美元的范围内。拥有稳定的贸易 确保了金融安全 并帮助各国公民从各种选择中进行选择。
# 历年交易量

ts = df.groupby(['Year']).agg({'Trade Value (US$)':'sum'}) ; ts.reset_index(inplace=True)
fig = px.area(ts, x='Year', y='Trade Value (US$)', template='plotly_white')
fig.update_layout(font_family="verdana",font_size=12, paper_bgcolor="#e9f1f5",plot_bgcolor="#e9f1f5",title="Volume of Trade over Years<br><sup>Exports by Russia have been in a 'range' for the past years</sup>")
fig.update_yaxes(tickprefix="$", showgrid=False, range = [0,12500000])

fig.add_annotation(text='<b>Housing Crisis', x='2008', y=4200000, arrowhead=1, showarrow=True)
fig.add_shape(
    type='line', line_color='salmon', line_width=1, opacity=1, line_dash='dot',
    x0=2010, y0=0, x1=2010, y1=6053000, xref='x', yref='y') ; fig.add_annotation(text='<b>Germany', x='2010', y=6700000, showarrow=False)
fig.add_shape(
    type='line', line_color='salmon', line_width=1, opacity=1, line_dash='dot',
    x0=2012, y0=0, x1=2012, y1=6354000, xref='x', yref='y') ; fig.add_annotation(text='<b>Lithuania', x='2012', y=7000000, showarrow=False)
fig.add_shape(
    type='line', line_color='salmon', line_width=1, opacity=1, line_dash='dot',
    x0=2014, y0=0, x1=2014, y1=7722400, xref='x', yref='y') ; fig.add_annotation(text='<b>Mongolia', x='2014', y=8200000, showarrow=False)
fig.add_shape(
    type='line', line_color='salmon', line_width=1, opacity=1, line_dash='dot',
    x0=2016, y0=0, x1=2016, y1=8079900, xref='x', yref='y') ; fig.add_annotation(text='<b>Kyrgyzstan', x='2016', y=8500000, showarrow=False)
fig.add_shape(
    type='line', line_color='salmon', line_width=1, opacity=1, line_dash='dot',
    x0=2018, y0=0, x1=2018, y1=6054000, xref='x', yref='y') ; fig.add_annotation(text='<b>China', x='2018', y=6600000, showarrow=False)

fig.add_shape(
    type='line', line_color='black', line_width=1, opacity=1,
    x0=2010, y0=10000000, x1=2018, y1=10000000, xref='x', yref='y') ; fig.add_annotation(text='<b>Top Importers of Goods with respect to Year', x='2014', y=11000000, showarrow=False)
fig.add_shape(type='line', line_color='black', line_width=1, opacity=1,x0=2010, y0=9000000, x1=2010, y1=10000000, xref='x', yref='y')
fig.add_shape(type='line', line_color='black', line_width=1, opacity=1,x0=2018, y0=9000000, x1=2018, y1=10000000, xref='x', yref='y')
fig.add_shape(type='line', line_color='black', line_width=1, opacity=1,x0=2014, y0=10000000, x1=2014, y1=10500000, xref='x', yref='y')

fig.show()
cmap_chem = ['rgb(214,96,77)','#cde3ef','rgb(67,147,195)']
cmap_ec = ['rgb(178,24,43)','#cde3ef','rgb(33,102,172)']
circle_color = ['#67001f','#d6604d', '#9fcce2', '#4393c3','#053061']
# re-import
import seaborn as sns
import matplotlib.pyplot as plt
%matplotlib inline
II. 各大洲贸易出口细目 🗺️
我们可以得出结论,大多数出口都是与邻国或陆地范围内的国家进行的(运输方式不需要海运/空运方式)。世界银行的一项研究表明,全球90%的货物是通过海运运输的。
.: Scale :.
High to Low
🟦 > 🟥
import math
millnames = ['',' K',' M',' B',' Tr']
import circlify
def millify(n):
    n = float(n)
    millidx = max(0,min(len(millnames)-1,
                        int(math.floor(0 if n == 0 else math.log10(abs(n))/3))))
    return '{:.0f}{}'.format(n / 10**(3 * millidx), millnames[millidx])
fig, ax = plt.subplots(figsize=(14,14))
ax.set_facecolor('#e9f1f5')
cc = df.copy()
cc = cc.groupby('Continent').agg({'Trade Value (US$)':'sum'}) ; cc.reset_index(inplace=True)
cc = cc[cc['Trade Value (US$)'] >= 0]
cc.sort_values(by='Trade Value (US$)', inplace=True)

labels = cc['Continent']
circles = circlify.circlify(
    cc['Trade Value (US$)'].tolist(),
    show_enclosure=False,
    target_enclosure=circlify.Circle(x=0, y=0, r=1))

lim = max(
    max(
        abs(circle.x) + circle.r,
        abs(circle.y) + circle.r,)
    for circle in circles)
plt.xlim(-lim-0.15, lim+0.15)
plt.ylim(-lim-0.15, lim+0.15)
ax.set(xticklabels=[],yticklabels=[])
# print circles
for circle, label, color, val in zip(circles, labels, circle_color,cc['Trade Value (US$)']) :
    x, y, r = circle
    ax.add_patch(plt.Circle((x, y),  r,alpha=0.9, linewidth=1, facecolor=color, edgecolor='black',))
    plt.annotate(label, (x,y ) ,va='center', ha='center',color='white', fontsize=12)# bbox=dict(facecolor='white', edgecolor='black', boxstyle='round', pad=.5))
    plt.annotate(millify(val), (x,y-0.04 ) ,va='center', ha='center',color='white', fontsize=10)
    plt.annotate('Minimum Imports', xy=(0.7,0.55), xytext=(0.85, 0.8),arrowprops=dict(arrowstyle="-[", connectionstyle="angle3,angleA=90,angleB=0"))
    plt.annotate('Maximum Imports', xy=(0.55,-0.54), xytext=(0.75, -0.75),arrowprops=dict(arrowstyle="-[",connectionstyle="angle3,angleA=180,angleB=90"))
    plt.annotate('Average Imports', xy=(-0.40,0.65), xytext=(-0.70, 0.85),arrowprops=dict(arrowstyle="-[",connectionstyle="angle3,angleA=90,angleB=180"))

total = df.copy()
total = total.groupby(['Continent','Partner ISO']).agg({'Trade Value (US$)':'sum'}) ; total.reset_index(inplace=True)
total = total.sort_values(by='Trade Value (US$)', ascending=False) ; total = total[total['Trade Value (US$)'] >= 0]
top5 = total.head(6)
top5 = top5['Partner ISO']
III. 按大陆和国家划分的贸易细分 🌎
下面的地图显示了迄今为止每个国家、每个大陆的总出口量。
.: Scale :.
High to Low
🟦 > 🟥
# Tree map
fig = px.treemap(total, path=[px.Constant('World'), 'Continent', 'Partner ISO'], values='Trade Value (US$)', color='Trade Value (US$)', hover_data=['Partner ISO'],
                  color_continuous_scale='RdBu',color_continuous_midpoint=np.percentile(total['Trade Value (US$)'],85), template='plotly_white')
fig.update_layout(font_family="verdana", font_size=12, paper_bgcolor="#e9f1f5",plot_bgcolor="#e9f1f5",title='<b>Top importers of Russian goods</b> <br><sup><i>Hover over blocks for more detail</i></sup>',)
fig.update_layout(margin = dict(t=50, l=25, r=25, b=25))
fig.show()
V. 所有商品的贸易密度|商品代码的核心密度w/ref贸易价值
在100种二级聚合商品中,最常交易的商品介于 40 到 80之间
**化学品-医药产品-钢铁-机械-道路车辆 **商品的主要贡献
# 所有商品的KDE

tt = df.copy()
tt = tt.groupby(['Commodity Code',]).agg({'Trade Value (US$)':'sum'}) ; tt.reset_index(inplace=True)
sns.jointplot(data=tt, x='Commodity Code', y='Trade Value (US$)', kind='kde',  cmap='Blues', shade=True, thresh=0, height=10, fill=True)
<seaborn.axisgrid.JointGrid at 0x7f6c50f7ff90>

VI. Top-5 商品贸易密度
<style> table, th, td { border:1px solid black; } </style>
| 国家 | 最高 |
|---|---|
| 印度 | 鞋类 |
| 美国 | 饮料 |
| 中国 | 染色、鞣制和着色材料 |
| 日本 | 专业机械 |
| 沙特阿拉伯 | 专业机械 |
| 德国 | 专业机械 |
top_com = df.copy() ; tc = top_com
top_com = top_com.groupby(['Commodity Code']).agg({'Trade Value (US$)':'sum'}) ; top_com.reset_index(inplace=True)
top_com.sort_values(by='Trade Value (US$)', inplace=True, ascending=False)
top_com = top_com['Commodity Code'].head(5)

fig, ax = plt.subplots(3,2,figsize=(18,17))
countries = ['IND','USA','CHN','JPN','SAU','DEU']
f6_pallet = ['#67001f','#d6604d', '#9fcce2', '#4393c3','#053061']
fig.suptitle('Density of Top-5 Commodities amongst different Countries')
labels=['Footwear','Beverages','Dyeing, Tanning and Coloring meterials','Specialized Machinery','Telco,Sound recording/reproducing Equipment']
fig.patch.set_facecolor('#e9f1f5')
count = 0
for i in range(3):
    for j in range(2):
        f6 = df[(df['Partner ISO'] == countries[count]) & (df['Commodity Code'].isin(top_com))]
        f6 = f6.groupby(['Year','Commodity Code']).agg({'Trade Value (US$)':'sum'}) ;f6.reset_index(inplace=True)
        a = sns.kdeplot(data=f6, ax=ax[i,j], x='Trade Value (US$)', hue='Commodity Code', fill=True, alpha=0.4, palette = f6_pallet, legend=False,)
        a.set(xticklabels=[],yticklabels=[])
        ax[i,j].set_title(countries[count]) ; count = count + 1
fig.legend([ax], labels=labels, loc='upper left', ncol=5, mode='expand',borderaxespad=4,)
<matplotlib.legend.Legend at 0x7f6c4f2f99d0>

热门商品的顶级进口商
VII (A) 前10个有机化学品进口国 🧪 & 医药原料 💊 💉
Top 10 国家 平均进口 80,000 USD 而 全世界的总平均进口价值约为2000美元
five = df[df['Commodity Code'].isin([51,52, 54])] ; f2 = five
five = five.groupby(['Partner ISO']).agg({'Trade Value (US$)':'sum'}) ; five.reset_index(inplace=True)
po = five.sort_values(by='Trade Value (US$)', ascending=False).head(10)

po = po['Partner ISO']
f2 = f2[f2['Partner ISO'].isin(po)]

f2 = f2.groupby(['Partner ISO','Commodity Code']).agg({'Trade Value (US$)':'sum'}) ; f2.reset_index(inplace=True)
avg = np.mean(f2['Trade Value (US$)'])

fig = px.histogram(f2, x='Partner ISO', y='Trade Value (US$)', barmode='group', color='Commodity Code', text_auto='Trade Value (US$)',template='plotly_white',  color_discrete_sequence=cmap_chem)
fig.update_traces(textposition='outside')
fig.update_yaxes(tickprefix="$", showgrid=True)
fig.update_layout(font_family="verdana",font_size=12,paper_bgcolor="#e9f1f5",plot_bgcolor="#e9f1f5",
                    title='Top 10 Countries importing Organic, In-Organic & Pharmaceutical materials <br><sup>Mean import value of $80,000'
                    +' | Highest Importers of Organic and In-Organic chemicals - Pharmaceuticals</sup>')
fig.update_layout(uniformtext_minsize=5, uniformtext_mode='hide', showlegend=False)
fig.add_shape(
    type='line', line_color='salmon', line_width=1, opacity=1, line_dash='dot',
    x0=0, x1=1, xref='paper', y0=avg, y1=avg, yref='y')
fig.add_annotation(text='<i>avg '+str(avg)[:2]+'k', x='AGO', y=80000,)

fig.add_annotation(text='Pharmaceuticals', x='YEM', y=174000, arrowhead=1, showarrow=True)
fig.add_annotation(text='Organic Chemicals', x='DOM', y=160000, arrowhead=1, showarrow=True)
fig.add_annotation(text='In-organic Chemicals', x='LBN', y=135000, arrowhead=1, showarrow=True)
fig.update_layout(yaxis_range=[0,250000],
    xaxis = dict(
        tickmode = 'array',
        tickvals = ['AGO','ARE','CHE','DOM','EGY','GTM','IRN','LBN','SGP','YEM'],
        ticktext = ['Angola','United Arab Emirates','Switzerland','Dominican Republic','Egypt','Guatemala','Iran','Lebanon','Singapore','Yemen']))
fig.show()
VII (B) 电能 🔌 💡
哈萨克斯坦 and 中国 一直是俄罗斯电力的最高进口国
# 35	ELECTRIC CURRENT
ec = df[df['Commodity Code'].isin([35])]
ec = ec.groupby(['Partner ISO']).agg({'Trade Value (US$)':'sum'}) ; ec.reset_index(inplace=True)
fig = px.bar(ec, y='Partner ISO', x='Trade Value (US$)', text='Trade Value (US$)',template='plotly_white',color_continuous_scale=cmap_ec, color='Trade Value (US$)')
fig.update_traces(texttemplate='%{text:.2s}', textposition='outside')
fig.update_layout(uniformtext_minsize=8, uniformtext_mode='hide',xaxis_range=[-95000,100000],)
fig.update_layout(font_family="verdana",font_size=12,paper_bgcolor="#e9f1f5",plot_bgcolor="#e9f1f5",
                    title='Top Importers of electricity<br><sup>Majority of the trade is being done with neighbouring countries and Islands | </sup>')
fig.add_annotation(text='Highest Importer of Electric Current', x=70000, y='LTU', arrowhead=1, showarrow=True)
fig.add_annotation(text='Lowest Importer of Electric Current', x=13000, y='MNG', arrowhead=1, showarrow=False)
fig.add_shape(
    type='line', line_color='salmon', line_width=1, opacity=1, line_dash='dot',
    x0=36650, x1=36650, xref='x', y0='AZE', y1='UKR', yref='y', )
fig.add_annotation(text='mean 36K', x='42000', y='FIN',showarrow=False)

fig.show()
世界范围分布 🗺️
世界地图上俄罗斯流行商品的分布
- 衣服 👚 👓
- 能源 ⛽ 🛢️
- 饮品 🍺 ☕ 🍾
# 83	TRAVEL GOODS, HANDBAGS AND SIMILAR CONTAINERS
# 84	ARTICLES OF APPAREL AND CLOTHING ACCESSORIES
# 85	FOOTWEAR
one = df[df['Commodity Code'].isin([83,84,85])]
one = one.groupby(['Partner ISO']).agg({'Trade Value (US$)':'sum'}) ; one.reset_index(inplace=True)
# 32	COAL, COKE AND BRIQUETTES
# 33	PETROLEUM, PETROLEUM PRODUCTS AND RELATED MATERIALS
# 34	GAS, NATURAL AND MANUFACTURED
two = df[df['Commodity Code'].isin([32,33,34])]
two = two.groupby(['Partner ISO']).agg({'Trade Value (US$)':'sum'}) ; two.reset_index(inplace=True)
# 11	BEVERAGES
# 12	TOBACCO AND TOBACCO MANUFACTURES
three = df[df['Commodity Code'].isin([11,12])]
three = three.groupby(['Partner ISO']).agg({'Trade Value (US$)':'sum'}) ; three.reset_index(inplace=True)
Title = ['Top Importers of Fashionable Threads & Apparel<br><sup>Travel Goods, Footwear, Clothing apparel</sup>',
        'Top Importers of Energy materials<br><sup>Coal, Briquettes, Gas, Fuel</sup>',
        'Top Importers of Beverages<br><sup>Beverages, Tobacco, Tobacco manufactures</sup>',]
for x,y in zip([one,two,three],Title) :
    fig = px.choropleth(x,locations='Partner ISO', locationmode='ISO-3',color='Trade Value (US$)', color_continuous_scale='RdBu', color_continuous_midpoint=np.average(x['Trade Value (US$)']))
    fig.update_layout(font_family="verdana",font_size=12,title=y,paper_bgcolor="#e9f1f5",plot_bgcolor="#e9f1f5")
    fig.update_layout(
    autosize=False,
    width=1200,
    height=600,
    template= 'plotly',
) ; fig.show()
结论 🔎
- 对于有机/非有机化学品🧪 & 医药原料💊 💉, 前10个国家的平均进口价值为80000美元,而全球的总体平均进口价值约为2000美元
- 正在交易的前5种贵重商品的KDE密度表明,世界对俄罗斯的专用机械有着浓厚的兴趣
- 在100种二级综合商品中,最常交易的商品在40至80种之间,主要是化学品-医药产品-钢铁-机械-道路车辆商品
- 俄罗斯最大的货物进口国位于同一大陆,即亚洲。最高的是朝鲜,其次是新西兰和肯尼亚
- 我们可以得出结论,大多数出口都是与邻国或陆地范围内的国家进行的(运输方式不需要海运/空运方式)。世界银行的一项研究表明,全球90%的货物是俄罗斯,俄罗斯能够保持总体稳定的贸易价值,贸易额一直在500万至800万美元之间。拥有稳定的贸易可以确保金融安全,并帮助各国公民从各种选择中进行选择。
- 哈萨克斯坦和中国是俄罗斯电力的最大进口国

【声明】本内容来自华为云开发者社区博主,不代表华为云及华为云开发者社区的观点和立场。转载时必须标注文章的来源(华为云社区)、文章链接、文章作者等基本信息,否则作者和本社区有权追究责任。如果您发现本社区中有涉嫌抄袭的内容,欢迎发送邮件进行举报,并提供相关证据,一经查实,本社区将立刻删除涉嫌侵权内容,举报邮箱:
cloudbbs@huaweicloud.com
- 点赞
- 收藏
- 关注作者
评论(0)