Go 语言编程 — Profiling 性能分析

目录
Profiling
Golang 提供了友好的工程化支持,其中之一就是 Profiling(分析)工具。例如:Golang 自带的 runtime 包,就可以轻松获取程序运行期间的各种内存或 CPU 的使用状态信息。
runtime
MemStat
查看内存使用情况:
package main

import (
	"fmt"
	"runtime"
)

func main() {
	var m runtime.MemStats
	runtime.ReadMemStats(&m)
	fmt.Println(m.Alloc, m.HeapAlloc, m.HeapObjects, m.Frees)
}
- 1
- 2
- 3
- 4
- 5
- 6
- 7
- 8
- 9
- 10
- 11
- 12
- Alloc/HeapAlloc:表示当前 heap 的大小。
- HeapObjects:表示当前 heap 中有多少个对象。
- Frees:表示一共释放过多少的对象。程序可能会出现当前内存使用已经降下来了但过去某个时间曾经升高过的情况。
GC
// disable gc when start
GOGC=off go run main.go // disable gc and manually trigger gc
debug.SetGCPercent(-1)
runtime.GC()
- 1
- 2
- 3
- 4
- 5
- 6
- 7
查看 GC 状态:
package main

import ( "fmt" "runtime/debug"
)

func main() { var d debug.GCStats debug.ReadGCStats(&d) fmt.Println(d.LastGC, d.NumGC, d.PauseTotal)
}
- 1
- 2
- 3
- 4
- 5
- 6
- 7
- 8
- 9
- 10
- 11
- 12
- LastGC:表示上次 GC 时间。
- NumGC:表示一共 GC 了过多少次。
- PauseTotal:总暂停时间以及 Pause 暂停历史。
pprof
pprof 可以查看程序运行过程中更加详细的 CPU、Mem 损耗信息:
package main

import (
	"os"
	"runtime/pprof"
)

func main() { // CPU
	pprof.StartCPUProfile(os.Stdout)
	defer pprof.StopCPUProfile()
}
- 1
- 2
- 3
- 4
- 5
- 6
- 7
- 8
- 9
- 10
- 11
- 12
输出 CPU Profile 文件并查看:
go run main.go > cpu.profile
go tool pprof cpu.profile
- 1
- 2
打印内存使用信息:
package main

import (
	"os"
	"runtime/pprof"
)

func main() { // Mem
	pprof.WriteHeapProfile(os.Stdout)
}
- 1
- 2
- 3
- 4
- 5
- 6
- 7
- 8
- 9
- 10
- 11
输出 Mem Profile 文件并查看:
go run main.go > memory.profile
go tool pprof memory.profile
- 1
- 2
通常 memory.profile 记录的是当前的内存使用情况,有些时候并不适合 DEBUG,如果想知道全部的分配情况:
go tool pprof --alloc_space memory.profile
- 1
在一些问题原因不明确也不太好复现的场景中,上面输出 memory 和 cpu profile 的情况有些时候并不那么实用,这个时候一方面我们可以结合上面的 MemStats 使用,如果达到某个值就输出一份 profile,或者直接使用下面的通过 Web UI 把 profile 信息实时输出:
package main

import (
	"net/http"
	_ "net/http/pprof"
)

func main() {
	http.ListenAndServe("localhost:8082", nil)
}
- 1
- 2
- 3
- 4
- 5
- 6
- 7
- 8
- 9
- 10
浏览器访问:http://localhost:8082/debug/pprof/
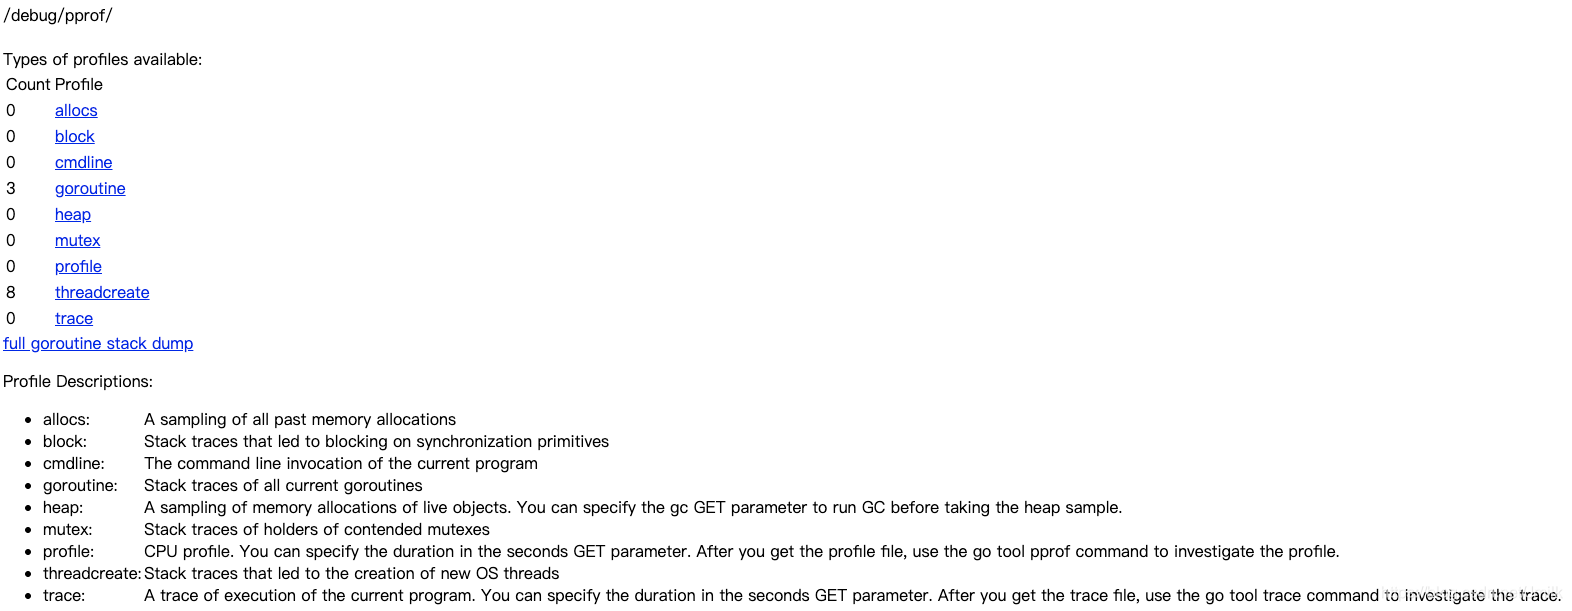
- allocs:与 --alloc_space 是一样的,同时还可以查看到 MemStats。
- block:没有在运行的时间,例如:等待 channel、等待 mutex 等。
- cmdline:当前程序的启动命令。
- goroutine:Goroutine 的信息。
- heap:与 Memory Profle 一样。
- mutex:Stack traces of holders of contended mutexes.
- profile:与 CPU Profile 一样。
- threadcreate:线程。
- trace:A trace of execution of the current program. You can specify the duration in the seconds GET parameter. After you get the trace file, use the go tool trace command to investigate the trace.
依旧可以使用工具来查看:
go tool pprof --alloc_space http://localhost:8082/debug/pprof/heap
- 1
trace
trace 和 pprof 的区别在于两者关注的维度不同,后者更关注代码栈层面,而 trace 更关注于 latency(延迟)。
比如说一个请求在客户端观察从发送到完成经过了 5s,做 profile 可能发现这个请求的 CPU 时间只有 2s,那剩下的 3s 就不是很清楚了, profile 更侧重的是我们代码执行了多久,至于其他的,例如:网络 IO,系统调用,Goroutine 调度,GC 时间等,很难反映出来。这是就应该使用 trace 了。
生成 trace:
package main

import (
	_ "net/http/pprof"
	"os"
	"runtime/trace"
)

func main() {
	trace.Start(os.Stdout)
	defer trace.Stop()
}
- 1
- 2
- 3
- 4
- 5
- 6
- 7
- 8
- 9
- 10
- 11
- 12
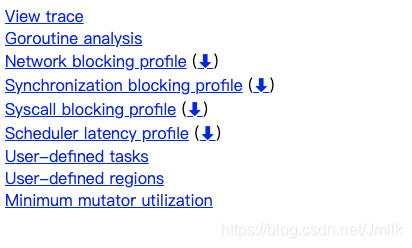
或者上面的 pprof Web UI 也支持下载 trace 文件。
$ go tool trace app.trace
2020/07/17 17:57:17 Parsing trace...
2020/07/17 17:57:17 Splitting trace...
2020/07/17 17:57:17 Opening browser. Trace viewer is listening on http://127.0.0.1:51252
- 1
- 2
- 3
- 4
在 trace 上可以清楚的看到每个 Goroutine 的起始,怎么生成的,每个 CPU 内核在做什么这些。
文章来源: is-cloud.blog.csdn.net,作者:范桂飓,版权归原作者所有,如需转载,请联系作者。
原文链接:is-cloud.blog.csdn.net/article/details/107413101

- 点赞
- 收藏
- 关注作者
评论(0)