Flutter × OpenHarmony 跨端开发:构建个人理财助手的统计信息模块

【摘要】 Flutter × OpenHarmony 跨端开发:构建个人理财助手的统计信息模块 前言在移动应用开发中,个人理财助手是一个非常常见且实用的场景。它不仅可以帮助用户记录每日收支,还能提供清晰的财务统计,让用户直观了解自己的收入、支出及预算状况。本文将结合 Flutter × OpenHarmony 的跨端开发能力,讲解如何实现一个统计信息模块,帮助开发者快速构建高效、漂亮的理财统计界面。...
Flutter × OpenHarmony 跨端开发:构建个人理财助手的统计信息模块
前言
在移动应用开发中,个人理财助手是一个非常常见且实用的场景。它不仅可以帮助用户记录每日收支,还能提供清晰的财务统计,让用户直观了解自己的收入、支出及预算状况。本文将结合 Flutter × OpenHarmony 的跨端开发能力,讲解如何实现一个统计信息模块,帮助开发者快速构建高效、漂亮的理财统计界面。

背景
随着移动端多平台应用需求增长,开发者面临着同时适配 Android、iOS 甚至 HarmonyOS 的挑战。传统的原生开发模式成本高,维护复杂。而 Flutter × OpenHarmony 提供了一个统一的开发框架,可以用一套代码生成多端应用,大幅降低开发成本。同时,Flutter 强大的 UI 构建能力非常适合构建各种可视化统计模块,如图表、卡片等。
Flutter × OpenHarmony 跨端开发介绍
- Flutter:Google 提供的跨端 UI 框架,使用 Dart 语言,支持 Android、iOS、Web 及桌面端。
- OpenHarmony:华为开源的分布式操作系统,支持多设备协作,提供 HarmonyOS SDK。
- 优势:通过 Flutter 的 UI 框架和 OpenHarmony 的跨设备特性,可以在一套代码下实现跨端界面渲染和数据交互。
在构建理财统计模块时,我们将利用 Flutter 的 GridView、Card、Column 等布局组件,实现可扩展、响应式的统计信息界面。

开发核心代码(详细解析)
下面是统计信息模块的实现核心代码,我们将逐步解析:
/// 构建统计信息模块
Widget _buildStatisticsModule(ThemeData theme) {
// 计算总收入和总支出
final totalIncome = _income.fold(0.0, (sum, item) => sum + item.amount);
final totalExpense = _expenses.fold(0.0, (sum, item) => sum + item.amount);
final balance = totalIncome - totalExpense;
return Column(
children: [
Padding(
padding: const EdgeInsets.symmetric(horizontal: 16),
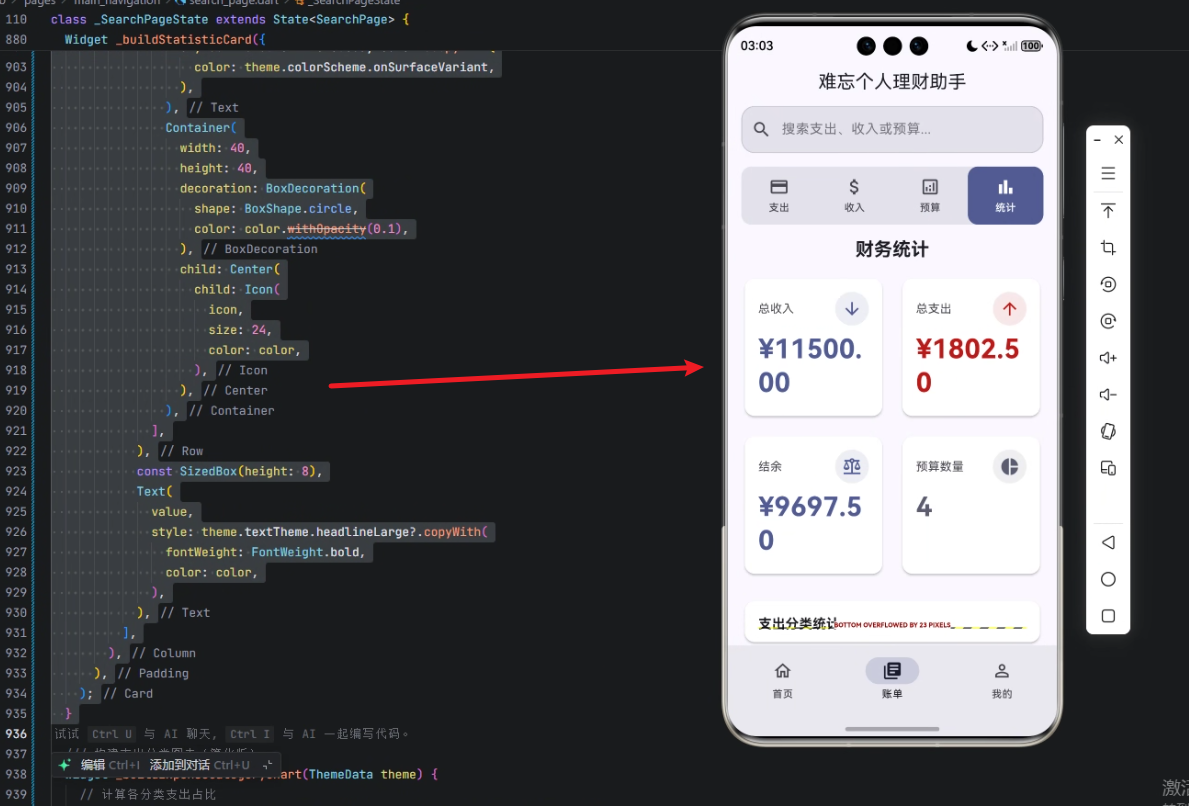
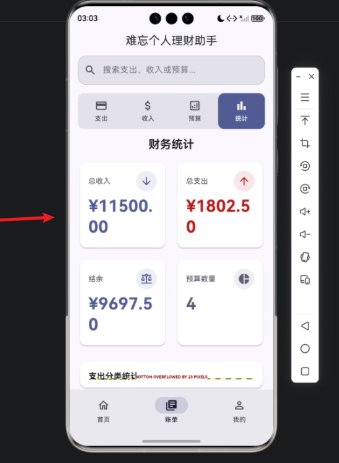
child: Text(
'财务统计',
style: theme.textTheme.titleLarge?.copyWith(fontWeight: FontWeight.bold),
),
),
const SizedBox(height: 16),
// 使用 GridView 显示统计卡片
Padding(
padding: const EdgeInsets.symmetric(horizontal: 16),
child: GridView.count(
crossAxisCount: 2,
mainAxisSpacing: 16,
crossAxisSpacing: 16,
shrinkWrap: true,
physics: const NeverScrollableScrollPhysics(),
children: [
_buildStatisticCard(
title: '总收入',
value: '¥${totalIncome.toStringAsFixed(2)}',
icon: Icons.arrow_downward,
color: theme.colorScheme.primary,
theme: theme,
),
_buildStatisticCard(
title: '总支出',
value: '¥${totalExpense.toStringAsFixed(2)}',
icon: Icons.arrow_upward,
color: theme.colorScheme.error,
theme: theme,
),
_buildStatisticCard(
title: '结余',
value: '¥${balance.toStringAsFixed(2)}',
icon: Icons.balance,
color: balance >= 0 ? theme.colorScheme.primary : theme.colorScheme.error,
theme: theme,
),
_buildStatisticCard(
title: '预算数量',
value: _budgets.length.toString(),
icon: Icons.pie_chart,
color: theme.colorScheme.secondary,
theme: theme,
),
],
),
),
const SizedBox(height: 24),
// 支出分类图表
Expanded(
child: Padding(
padding: const EdgeInsets.symmetric(horizontal: 16),
child: Card(
elevation: 2,
shape: RoundedRectangleBorder(
borderRadius: BorderRadius.circular(12),
),
child: Padding(
padding: const EdgeInsets.all(16),
child: Column(
crossAxisAlignment: CrossAxisAlignment.start,
children: [
Text(
'支出分类统计',
style: theme.textTheme.titleMedium?.copyWith(fontWeight: FontWeight.bold),
),
const SizedBox(height: 16),
Expanded(
child: _buildExpenseCategoryChart(theme),
),
],
),
),
),
),
),
],
);
}
1. 核心思路解析
- 使用
_income和_expenses两个列表计算总收入和总支出。 fold方法可以快速累加列表中每一项的金额。GridView.count布局可以灵活显示多个统计卡片,适合移动端网格展示。Expanded+Card实现可伸缩的图表区域,方便显示分类支出统计。
2. 统计卡片构建方法
/// 构建统计卡片
Widget _buildStatisticCard({
  required String title,
  required String value,
  required IconData icon,
  required Color color,
  required ThemeData theme,
}) {
  return Card(
    elevation: 2,
    shape: RoundedRectangleBorder(
      borderRadius: BorderRadius.circular(12),
    ),
    child: Padding(
      padding: const EdgeInsets.all(16),
      child: Column(
        crossAxisAlignment: CrossAxisAlignment.start,
        children: [
          Row(
            mainAxisAlignment: MainAxisAlignment.spaceBetween,
            children: [
              Text(
                title,
                style: theme.textTheme.bodyMedium?.copyWith(
                  color: theme.colorScheme.onSurfaceVariant,
                ),
              ),
              Container(
                width: 40,
                height: 40,
                decoration: BoxDecoration(
                  shape: BoxShape.circle,
                  color: color.withOpacity(0.1),
                ),
                child: Center(
                  child: Icon(
                    icon,
                    size: 24,
                    color: color,
                  ),
                ),
              ),
            ],
          ),
          const SizedBox(height: 8),
          Text(
            value,
            style: theme.textTheme.headlineLarge?.copyWith(
              fontWeight: FontWeight.bold,
              color: color,
            ),
          ),
        ],
      ),
    ),
  );
}
功能亮点:
- 卡片左侧显示统计标题,右侧显示图标,增强视觉层次。
- 数值显示采用
headlineLarge,突出重点信息。 - 图标圆形背景使用半透明色,保证界面美观统一。
心得
通过 Flutter × OpenHarmony 构建统计模块,体验到以下几点:
- 跨端统一开发:一套代码可在 Android、iOS、HarmonyOS 运行。
- UI 高度可定制:Flutter 的布局灵活,配合主题色可以快速适配不同设计。
- 可扩展性强:未来可在模块中加入更多图表或动画效果,实现丰富交互。
总结
本文展示了如何使用 Flutter × OpenHarmony 构建个人理财助手中的统计信息模块。通过合理利用 GridView、Card 和图表组件,我们能够直观展示收入、支出、结余及预算等信息,为用户提供清晰的财务概览。借助跨端框架,开发者可以一次编码,多端部署,提高开发效率,同时保持良好的 UI 体验。

【声明】本内容来自华为云开发者社区博主,不代表华为云及华为云开发者社区的观点和立场。转载时必须标注文章的来源(华为云社区)、文章链接、文章作者等基本信息,否则作者和本社区有权追究责任。如果您发现本社区中有涉嫌抄袭的内容,欢迎发送邮件进行举报,并提供相关证据,一经查实,本社区将立刻删除涉嫌侵权内容,举报邮箱:
cloudbbs@huaweicloud.com
- 点赞
- 收藏
- 关注作者
评论(0)