Linux 性能调优之CPU调优认知

写在前面
-
博文内容为 《性能之巅 系统、企业与云可观测性(第2版)》CPU 章节课后习题答案整理 -
内容涉及: -
CPU 术语,指标认知 -
CPU 性能问题分析解决 -
CPU 资源负载特征分析 -
应用程序用户态CPU用量分析
-
-
理解不足小伙伴帮忙指正
对每个人而言,真正的职责只有一个:找到自我。然后在心中坚守其一生,全心全意,永不停息。所有其它的路都是不完整的,是人的逃避方式,是对大众理想的懦弱回归,是随波逐流,是对内心的恐惧 ——赫尔曼·黑塞《德米安》
一、CPU 术语认知
进程(Process)与处理器(Processor)的区别
进程是操作系统分配资源(如内存、文件句柄)的基本单位,代表一个正在运行的程序实例。每个进程拥有独立的地址空间,不同进程间通信需通过 IPC 机制(如管道、共享内存)。
处理器(CPU)是物理硬件,负责执行指令和计算任务。一个处理器可包含多个物理核心(如多核 CPU),每个核心可并行处理线程。
硬件线程(Hardware Thread)是什么
硬件线程是物理 CPU 核心通过技术(如超线程)模拟出的逻辑处理单元。例如,Intel 的超线程技术允许一个物理核心同时执行两个线程,共享核心的计算资源(如 ALU),从而提升并行效率。
比如 Intel Core i7-12700H 是第12代 Alder Lake 架构的桌面处理器,其核心与线程配置: 核心总数:12核(8个性能核心 + 4个效率核心)
+ 性能核心(P核):基于 Golden Cove 架构,支持超线程技术,每个物理核心可处理 2个硬件线程。 + 效率核心(E核):基于 Gracemont 架构,不支持超线程,每个物理核心仅对应 1个硬件线程
运行队列(Run Queue)
运行队列是操作系统中等待 CPU 调度的任务队列。当任务数超过 CPU 核心数时,队列长度(饱和度指标)增加,可能导致响应延迟。例如,Linux 的 vmstat 命令中 r 列显示当前运行队列长度。b 列为被阻塞的进程
┌──[root@liruilongs.github.io]-[~]
└─$vmstat 1
procs -----------memory---------- ---swap-- -----io---- -system-- ------cpu-----
 r  b   swpd   free   buff  cache   si   so    bi    bo   in   cs us sy id wa st
69  0      0 7700836   4204 1441648    0    0   369   101  569 1819 11 35 45  8  0
26  1      0 7711264   4204 1441668    0    0     0    12 1209 1380  9 24 64  3  0
 8  0      0 7710592   4204 1441664    0    0     0    27  779 1215  4 11 78  7  0
13  0      0 7699752   4204 1441668    0    0     0     0  766 1313  3 25 72  0  0
...................
18  0      0 7715444   4204 1447356    0    0     0    56  935 7750  6 19 67  7  0
54  0      0 7766760   4204 1440632    0    0     0    64 1237 4686 11 26 56  7  0
52  0      0 7712752   4204 1441816    0    0     0     4 1265 6567 25 33 42  0  0
^C
┌──[root@vms100.liruilongs.github.io]-[~]
└─$
r:CPU上正在执行的和等待执行的进程数量。相比平均负载来说,这是一个更好的排查CPU饱和度的指标,因为它不包含IO。可以这样解释:一个比CPU数量多的 r 值代表 CPU 资源处于饱和状态。被阻塞的进程为(b)列
用户时间与内核时间的区别
用户时间:CPU 执行用户空间程序代码的时间(如应用程序逻辑),对应 top 命令的 %usr 指标。
stress 模拟对一个 CPU 进行计算负载
┌──[root@liruilongs.github.io]-[~]
└─$stress --cpu 1 --timeout 300
stress: info: [8467] dispatching hogs: 1 cpu, 0 io, 0 vm, 0 hdd
通过 mpstat 命令来查看 CPU 负载信息,mpstat 命令是 Linux 系统上的一个重要的性能监控工具,它用于报告各个 CPU 的统计信息。
┌──[root@liruilongs.github.io]-[~]
└─$ mpstat -P ALL 5
Linux 5.4.266-1.el7.elrepo.x86_64 (vms100.liruilongs.github.io)         2024年08月22日  _x86_64_     (4 CPU)

20时22分25秒  CPU    %usr   %nice    %sys %iowait    %irq   %soft  %steal  %guest  %gnice   %idle
20时22分30秒  all   30.43    0.00    2.95    0.00    0.00    0.78    0.00    0.00    0.00   65.84
20时22分30秒    0    5.53    0.00    3.62    0.00    0.00    1.70    0.00    0.00    0.00   89.15
20时22分30秒    1    5.24    0.00    3.56    0.00    0.00    0.63    0.00    0.00    0.00   90.57
20时22分30秒    2  100.00    0.00    0.00    0.00    0.00    0.00    0.00    0.00    0.00    0.00
20时22分30秒    3    7.66    0.00    4.97    0.00    0.00    0.83    0.00    0.00    0.00   86.54
可以看到 对于 CPU 逻辑核 2 中两个异常的指标:
-
CPU用户态使用率(%usr) 为 100% -
CPU 空闲率(%idle) 为 0%
内核时间:CPU 执行操作系统内核任务的时间(如系统调用、中断处理),对应 %sys 指标。高内核时间可能因频繁 I/O 或系统调用导致。
用 fio 模拟 IO 负载测试
fio --name=randwrite 是随机写入,对 CPU 利用率有较大影响,CPU 主要消耗在内核态处理 I/O 请求
┌──[root@vms100.liruilongs.github.io]-[~]
└─$fio --name=randwrite --ioengine=libaio --iodepth=1 --rw=randwrite --bs=4K --direct=1 --size=11512M --numjobs=6 --group_reporting --filename=/tmp/testfile
可以通过 iostat 观察 IO 负载情况,%util 设备使用率趋于饱和
┌──[root@vms100.liruilongs.github.io]-[~]
└─$iostat  -dk -x 5
Linux 5.4.266-1.el7.elrepo.x86_64 (vms100.liruilongs.github.io)         2024年08月22日  _x86_64_        (4 CPU)

Device:         rrqm/s   wrqm/s     r/s     w/s    rkB/s    wkB/s avgrq-sz avgqu-sz   await r_await w_await  svctm  %util
sda               0.00     0.40    1.00 8027.80    54.40 32112.80     8.01     0.07    0.18    0.20    0.18   0.12  99.56

Device:         rrqm/s   wrqm/s     r/s     w/s    rkB/s    wkB/s avgrq-sz avgqu-sz   await r_await w_await  svctm  %util
sda               0.00     3.00    0.00 8068.60     0.00 32352.90     8.02     0.04    0.18    0.00    0.18   0.12  99.62
.......
查看CPU 相关信息,可以看到 使用率大的部分在内核态(%sys)
┌──[root@vms100.liruilongs.github.io]-[~]
└─$mpstat  5
Linux 5.4.266-1.el7.elrepo.x86_64 (vms100.liruilongs.github.io)         2024年08月22日  _x86_64_        (4 CPU)

21时12分46秒  CPU    %usr   %nice    %sys %iowait    %irq   %soft  %steal  %guest  %gnice   %idle
21时12分51秒  all    9.10    0.00   43.52    0.12    0.00    7.89    0.00    0.00    0.00   39.38
21时12分56秒  all    9.52    0.00   42.50    0.18    0.00    8.70    0.00    0.00    0.00   39.11
21时13分01秒  all    7.65    0.00   43.98    0.00    0.00    7.42    0.00    0.00    0.00   40.95
......
二、CPU 指标认知
CPU 使用率与饱和度
使用率
在规定的时间间隔内,CPU资源用于服务工作的时间百分比。虽然资源繁忙,但是资源还有能力接受更多的工作,不能接受更多工作的程度被视为饱和度,CPU 工作时间占比(如 80%),高使用率可能掩盖瞬时峰值(如 100% 突发负载)。
一般CPU 使用率长时间达到 80% 左右即趋于饱和,可能对业务造成影响。
饱和度
资源不能再服务更多额外工作的程度,通常有等待队列,任务排队等待 CPU 资源的程度。例如,运行队列长度超过 CPU 核心数时,系统响应延迟显著增加。
一个100%使用率的CPU被称为是饱和的,线程在这种情况下会碰上调度器延时,因为它们需要等待才能在CPU上运行,降低了总体性能。这个延时是线程花在等待CPU运行队列或者其他管理线程的数据结构上的时间。
一个饱和运行的CPU不像其他类型资源那样问题重重,因为更高优先级的工作可以抢占当前线程。但往往持续的饱和是存在问题的
指令流水线/宽度提升吞吐量的原理
指令流水线将指令执行分解为多个阶段(如取指、译码、执行),允许不同指令的不同阶段并行处理。例如,五级流水线中,五条指令可同时处于不同阶段,显著提高指令吞吐量。
现代处理器也支持乱序执行,即后续的指令可以在前面指令停滞的时候执行,即对于流水线步骤,1,2,3,可以按照,1,3,2 的顺序执行,但是会存在流水线冲突(如数据依赖)需通过分支预测来解决。
如果指令中有了条件分支之后,处理器就不清楚后续的指令到底是什么了,处理器通常使用分支预测技术来进行优化,通过猜测的结果预先执行,如果预测错了,就需要丢弃之前的预执行指令并且影响性能。
可以使用 Linux 的 perf 命令来收集关于命令执行期间的分支预测相关统计信息
┌──[root@liruilongs.github.io]-[~]
└─$perf stat sleep 2

 Performance counter stats for 'sleep 2':

             12.04 msec task-clock                #    0.006 CPUs utilized
                 1      context-switches          #    0.083 K/sec
                 1      cpu-migrations            #    0.083 K/sec
                74      page-faults               #    0.006 M/sec
         3,328,860      cycles                    #    0.276 GHz
                 0      instructions              #    0.00  insn per cycle
           289,196      branches                  #   24.020 M/sec
            12,686      branch-misses             #    4.39% of all branches

       2.034208658 seconds time elapsed

       0.000000000 seconds user
       0.032226000 seconds sys


┌──[root@liruilongs.github.io]-[~]
└─$
分支预测相关的解释:
-
instructions:指令数,表示命令执行期间执行的指令数。 -
branches:分支数(分支预测的次数),表示命令执行期间执行的分支指令数。 -
branch-misses:分支未命中数,表示命令执行期间发生的分支预测错误次数。
CPU 缓存指令优化的一种方式即利用分支预测器
分支预测器在处理条件语句(如if、switch)时起着关键作用。分支预测器尝试预测程序执行路径,以便CPU可以提前获取和执行预测的分支。当预测正确时,这可以显著提高性能,因为CPU不需要等待从内存中获取指令。
分支预测器通常基于历史执行数据来预测未来的执行路径。有两种主要类型的分支预测器:
静态分支预测器:
基于代码结构进行预测,例如,如果if语句的条件总是为真,则预测器将始终预测if分支。
假设我们有一个函数,用于在数组中查找特定元素:
bool search(int array[], int size, int target) {
    for (int i = 0; i < size; ++i) {
        if (array[i] == target) {
            return true;
        }
    }
    return false;
}
有序数组:如果array是有序的,分支预测器可以很好地预测if语句的执行路径。因为数组是有序的,所以一旦找到目标元素,后续的比较将始终失败,这使得分支预测器可以预测if语句将不会执行。
无序数组:如果array是无序的,分支预测器将无法有效预测if语句的执行路径。每次比较的结果都是独立的,没有可预测的模式。
这也是为什么查找要先排序原因之一。
动态分支预测器:
基于历史执行数据进行预测。它们跟踪每个分支的执行历史,并根据这些历史数据预测未来的执行路径。
for(i = 0; i < N; i++) {
    if (array [i] < target){
           array[i] = 0;
    }
}
对于有序数组,分支预测器基于历史执行数据可以预测接下来要在哪段代码执行(比如 if 还是 else 中的指令),就可以提前把这些指令放在缓存中,需要对应的指令直接从指令缓存中获取,提高了指令缓存命中率
指令宽度
指 CPU 单周期可处理的指令数。例如,超标量架构(如 Intel 酷睿)支持多发射(如同时发射 4 条指令)
多进程与多线程模型的优点
多进程
资源隔离性强(独立地址空间),崩溃不影响其他进程;适合 CPU 密集型任务(如科学计算),多个进程之间彼此没有共享数据存在。所以进程间的上下文切换需要保存进程运行数据,是一个很耗资源的操作,需要保存当前进程数据,加载要分配CPU时间的其他进程数据。
多线程
资源共享高效(如内存共享),上下文切换开销小;适合 I/O 密集型或需快速响应的任务
上面讲到了上下文切换,这里简答来看一下
三、CPU 性能问题分析解决
CPU 过载的影响与空闲状态
过载影响:
-
运行队列积压导致任务延迟,高饱和度引发 系统卡顿甚至崩溃 -
应用程序响应时间显著增加(如网页加载变慢)。 -
多个任务争夺 CPU时间片,频繁的上下文切换(vmstat的cs列)会消耗额外资源,进一步降低有效处理能力 -
长时间高负载可能导致 CPU 过热,触发硬件保护机制(如降频、强制重启),甚至引发系统崩溃
所以避免过热关机需要从使用率,运行队列长度做监控,避免持续的高饱和,考虑动态资源限制,进程 CUP 带宽权重动态配置。
cs:表示每秒中的上下文切换数
┌──[root@liruilongs.github.io]-[~]
└─$vmstat -S m 1 3
procs -----------memory---------- ---swap-- -----io---- -system-- ------cpu-----
 r  b   swpd   free   buff  cache   si   so    bi    bo   in   cs us sy id wa st
 1  0      0  32658      9   3600    0    0     7     1   31   53  0  0 100  0  0
 0  0      0  32658      9   3600    0    0     0     0  440  794  0  0 100  0  0
 0  0      0  32658      9   3600    0    0     0     0  425  774  0  0 100  0  0
┌──[root@liruilongs.github.io]-[~]
└─$
空闲状态:
CPU 执行 HLT 指令进入低功耗模式,运行空闲任务(如 Linux 的 swapper 进程),等待中断唤醒。CPU 休眠期间仍监听外部中断(如键盘输入、网络包到达),一旦触发立即唤醒处理,确保响应实时性。现代 CPU 会动态调节电压和频率(如 Intel 的 SpeedStep),空闲时自动降频至基础水平以节省能源
CPU 性能问题排查常用的三个命令
优先调查的方法:
-
监控工具定位高负载进程 :使用 top/htop或mpstat快速定位占用 CPU 的进程或线程(如 Java 服务线程死循环)。
top 命令观察 CPU 指标,平均负载,mpstat 命令观察 CPU 指标
top - 18:18:25 up 4 days, 17 min,  2 users,  load average: 0.51, 0.62, 0.77
Tasks: 249 total,   2 running, 247 sleeping,   0 stopped,   0 zombie
%Cpu(s): 52.5 us,  0.2 sy,  0.0 ni, 47.0 id,  0.3 wa,  0.0 hi,  0.0 si,  0.0 st
KiB Mem :  2031912 total,    77056 free,  1712644 used,   242212 buff/cache
KiB Swap: 10485756 total,  8991960 free,  1493796 used.    88756 avail Mem

   PID USER      PR  NI    VIRT    RES    SHR S  %CPU %MEM     TIME+ COMMAND
134004 root      20   0    7264    100      0 R 100.0  0.0   0:37.87 stress
  8079 chrony    20   0  889220 349276   1624 S   1.3 17.2  98:16.80 bundle
   843 etcd      20   0 10.308g   5488    824 S   1.0  0.3  83:53.19 etcd
  8156 992       20   0  348680  56736   3920 S   1.0  2.8  71:08.16 prometheus
  7467 tom       20   0 3109092 213956    764 S   0.7 10.5  30:15.35 java
  8060 nginx     20   0   41636   3676    888 S   0.7  0.2  70:50.13 redis-server
  8099 chrony    20   0  401332  16700   1964 S   0.7  0.8  15:00.93 gitaly
     9 root      20   0       0      0      0 S   0.3  0.0  20:37.39 rcu_sched
  8196 chrony    20   0 1314608     36      0 S   0.3  0.0  34:57.02 ruby
121037 root      20   0  151984    428    268 S   0.3  0.0   0:01.30 sshd
132973 root      20   0       0      0      0 S   0.3  0.0   0:00.21 kworker/1:1
134044 root      20   0  162032   2360   1556 R   0.3  0.1   0:00.05 top
........
    15 root       0 -20       0      0      0 S   0.0  0.0   0:00.00 kworker/1:0H
-
分析代码热点 :通过 perf/profile/Jprofile(生成火焰图,方法调用栈)确定调用栈,详细查看可疑进程lsof -p PID
┌──[root@liruilongs.github.io]-[~]
└─$lsof -p 134004
COMMAND    PID USER   FD   TYPE DEVICE SIZE/OFF      NODE NAME
stress  134004 root  cwd    DIR    8,1     4096 134217793 /root
stress  134004 root  rtd    DIR    8,1     4096        64 /
stress  134004 root  txt    REG    8,1    27704 277828820 /usr/bin/stress
stress  134004 root  mem    REG    8,1  2127336 402654082 /usr/lib64/libc-2.17.so
stress  134004 root  mem    REG    8,1  1139680 402654090 /usr/lib64/libm-2.17.so
stress  134004 root  mem    REG    8,1   164264 402654075 /usr/lib64/ld-2.17.so
stress  134004 root    0w   CHR    1,3      0t0        18 /dev/null
stress  134004 root    1w   REG    8,1       66 145012428 /root/nohup.out
stress  134004 root    2w   REG    8,1       66 145012428 /root/nohup.out
┌──[root@liruilongs.github.io]-[~]
└─$
3. **检查系统负载与资源争用** :使用vmstat或sar分析运行队列长度、上下文切换频率,结合iostat` 排除 I/O 瓶颈导致的间接 CPU 压力。
┌──[root@liruilongs.github.io]-[~]
└─$ vmstat 1 1
procs -----------memory---------- ---swap-- -----io---- -system-- ------cpu-----
 r  b   swpd   free   buff  cache   si   so    bi    bo   in   cs us sy id wa st
 2  0      0 23268840   3104 849968    0    0   168    26  239  296  2  3 96  0  0
CPU资源的USE方法检查清单
使用率
每个CPU
实时统计: mpstat -P ALL查看每个CPU的使用率,%idle指CPU的空闲率,通过检查单个热点(繁忙)CPU,挑出一个可能的线程扩展性问题。
┌──[root@liruilongs.github.io]-[~]
└─$ mpstat -P ALL
Linux 3.10.0-1160.71.1.el7.x86_64 (liruilongs.github.io)        2022年09月05日  _x86_64_        (6 CPU)

22时59分30秒  CPU    %usr   %nice    %sys %iowait    %irq   %soft  %steal  %guest  %gnice   %idle
22时59分30秒  all    5.44    0.00    7.91    0.51    0.00    0.30    0.00    0.00    0.00   85.85
22时59分30秒    0    5.65    0.00    7.43    0.60    0.00    0.29    0.00    0.00    0.00   86.02
22时59分30秒    1    5.34    0.00    9.01    0.47    0.00    0.33    0.00    0.00    0.00   84.85
22时59分30秒    2    5.80    0.00    7.12    0.40    0.00    0.36    0.00    0.00    0.00   86.32
22时59分30秒    3    5.68    0.00    7.74    0.50    0.00    0.30    0.00    0.00    0.00   85.77
22时59分30秒    4    3.84    0.00    6.08    0.23    0.00    0.23    0.00    0.00    0.00   89.62
22时59分30秒    5    6.30    0.00   10.04    0.86    0.00    0.27    0.00    0.00    0.00   82.54
┌──[root@liruilongs.github.io]-[~]
└─$
历史统计:也可用通过 sar -P ALL的命令来查看,sar可以获取平均数据,%idle指CPU的空闲率,反过来即为使用率
空闲率很高
┌──[root@liruilongs.github.io]-[~]
└─$ sar -P ALL
Linux 3.10.0-1160.71.1.el7.x86_64 (liruilongs.github.io)        2022年09月05日  _x86_64_        (6 CPU)

22时56分20秒       LINUX RESTART

23时00分01秒     CPU     %user     %nice   %system   %iowait    %steal     %idle
23时10分01秒     all      0.21      0.00      0.39      0.01      0.00     99.39
23时10分01秒       0      0.20      0.00      0.42      0.01      0.00     99.36
23时10分01秒       1      0.33      0.00      0.60      0.01      0.00     99.06
23时10分01秒       2      0.30      0.00      0.45      0.01      0.00     99.24
23时10分01秒       3      0.14      0.00      0.25      0.01      0.00     99.61
23时10分01秒       4      0.19      0.00      0.33      0.01      0.00     99.48
23时10分01秒       5      0.12      0.00      0.27      0.02      0.00     99.60

平均时间:     CPU     %user     %nice   %system   %iowait    %steal     %idle
平均时间:     all      0.21      0.00      0.39      0.01      0.00     99.39
平均时间:       0      0.20      0.00      0.42      0.01      0.00     99.36
平均时间:       1      0.33      0.00      0.60      0.01      0.00     99.06
平均时间:       2      0.30      0.00      0.45      0.01      0.00     99.24
平均时间:       3      0.14      0.00      0.25      0.01      0.00     99.61
平均时间:       4      0.19      0.00      0.33      0.01      0.00     99.48
平均时间:       5      0.12      0.00      0.27      0.02      0.00     99.60
┌──[root@liruilongs.github.io]-[~]
系统范围
vmstat 1 1 查看所有的CPU使用率,id列为系统空闲消耗的总CPU时间的百分比,当等于0的时候,即没有空闲
可以每秒运行vmstat,然后检查空闲列,看看还有多少余量。少于10%可能相关进程存在问题
┌──[root@liruilongs.github.io]-[~]
└─$ vmstat 1 1
procs -----------memory---------- ---swap-- -----io---- -system-- ------cpu-----
 r  b   swpd   free   buff  cache   si   so    bi    bo   in   cs us sy id wa st
 2  0      0 23268840   3104 849968    0    0   168    26  239  296  2  3 96  0  0
sar -u的方式,%idle指CPU的空闲率,获取启动以来的平均数据
┌──[root@liruilongs.github.io]-[~]
└─$ sar -u
Linux 3.10.0-1160.71.1.el7.x86_64 (liruilongs.github.io)        2022年09月05日  _x86_64_        (6 CPU)

22时56分20秒       LINUX RESTART

23时00分01秒     CPU     %user     %nice   %system   %iowait    %steal     %idle
23时10分01秒     all      0.21      0.00      0.39      0.01      0.00     99.39
平均时间:     all      0.21      0.00      0.39      0.01      0.00     99.39
09时20分01秒     CPU     %user     %nice   %system   %iowait    %steal     %idle
09时30分02秒     all     37.08      0.00      8.35      0.00      0.02     54.54
09时40分01秒     all     40.96      0.00      9.17      0.00      0.02     49.85
09时50分01秒     all     42.17      0.00      9.58      0.00      0.03     48.22
10时00分01秒     all     42.92      0.00      9.83      0.00      0.03     47.22
10时10分01秒     all     43.08      0.00      9.53      0.00      0.02     47.36
10时20分01秒     all     43.74      0.00      9.93      0.00      0.02     46.31
10时30分02秒     all     45.14      0.00     10.22      0.00      0.02     44.62
10时40分01秒     all     44.81      0.00     10.24      0.00      0.02     44.93
10时50分02秒     all     45.24      0.00     10.33      0.00      0.02     44.41
11时00分01秒     all     44.66      0.00     10.30      0.00      0.02     45.01
11时10分01秒     all     44.35      0.00     10.24      0.00      0.02     45.39
11时20分01秒     all     43.37      0.00     10.08      0.00      0.02     46.53
11时30分02秒     all     41.68      0.00      9.83      0.00      0.03     48.45
11时40分01秒     all     42.68      0.00      9.92      0.00      0.02     47.37
11时50分01秒     all     40.55      0.00      9.63      0.00      0.03     49.79
dstat 工具,需要单独装包,idl:指CPU的空闲率
┌──[root@liruilongs.github.io]-[~]
└─$ dstat -c 1 2
----total-cpu-usage----
usr sys idl wai hiq siq
  1   2  97   0   0   0
  0   0  99   0   0   0
  0   0 100   0   0   0
┌──[root@liruilongs.github.io]-[~]
└─$
每个进程
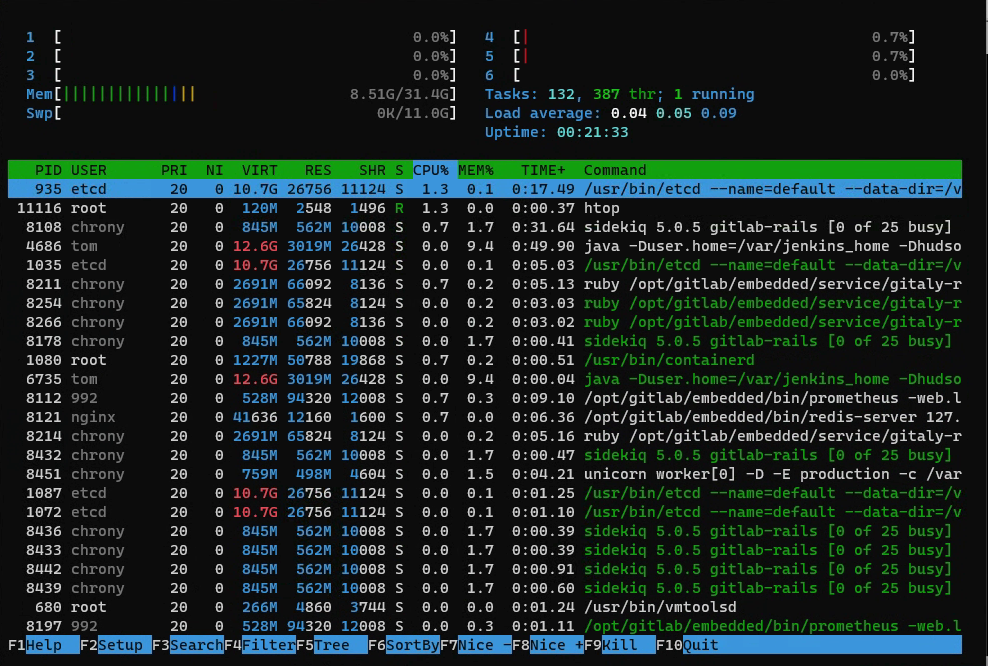
top命令,%CPU:CPU消耗, 默认会按照CPU用量排序
-
最上面会显示当前系统平均负载,以及CUP相关的平局值 %Cpu(s): 0.2 us, 0.2 sy, 0.0 ni, 99.6 id, 0.0 wa, 0.0 hi, 0.0 si, 0.0 st -
每个进程的CPU用量通过 TIME+和%CPU列表示,TIME列显示了进程自从创建开始消耗的CPU总时间(用户态+系统态),格式为“小时:分钟:秒”。 -
Linux上, CPU列显示了在前一秒内所有CPU上的CPU用量之和。一个单线程的CPU型进程会报告100%。而一个双线程的CPU型进程则会报告200%。
top - 23:15:42 up 19 min,  1 user,  load average: 0.01, 0.05, 0.10
Tasks: 279 total,   1 running, 278 sleeping,   0 stopped,   0 zombie
%Cpu(s):  0.2 us,  0.2 sy,  0.0 ni, 99.6 id,  0.0 wa,  0.0 hi,  0.0 si,  0.0 st
KiB Mem : 32927488 total, 22911768 free,  8894024 used,  1121696 buff/cache
KiB Swap: 11534328 total, 11534328 free,        0 used. 23608488 avail Mem

   PID USER      PR  NI    VIRT    RES    SHR S  %CPU %MEM     TIME+ COMMAND
   935 etcd      20   0   10.7g  26756  11124 S   1.3  0.1   0:15.74 etcd
  8108 chrony    20   0  863480 578404   9964 S   1.3  1.8   0:30.36 bundle
  8112 992       20   0  541256  93800  12008 S   1.3  0.3   0:08.27 prometheus
   955 root      20   0 1256580  50788  19868 S   0.3  0.2   0:02.40 containerd
  4686 tom       20   0   12.6g   2.9g  26428 S   0.3  9.4   0:49.63 java
  8113 chrony    20   0  583592  24052   6168 S   0.3  0.1   0:01.47 gitaly
  8121 nginx     20   0   41636  12160   1600 S   0.3  0.0   0:05.71 redis-server
  8214 chrony    20   0 2756524  65824   8124 S   0.3  0.2   0:04.84 ruby
  。。。。。。。。。。。。。。。。
也可以使用 htop工具
 在这里插入图片描述
或者 ps :%CPU
┌──[root@liruilongs.github.io]-[~]
└─$ ps -o pcpu,cmd
%CPU CMD
 0.0 /bin/bash /assets/wrapper
 0.0 runsvdir -P /opt/gitlab/service log: ................................................................
 0.0 /bin/bash /opt/gitlab/bin/gitlab-ctl tail
 0.0 /opt/gitlab/embedded/bin/ruby /opt/gitlab/embedded/bin/omnibus-ctl gitlab /opt/gitlab/embedded/servic
 0.0 sh -c find /var/log/gitlab -type f -not -path */sasl/* | grep -E -v '(config|lock|@|gzip|tgz|gz)' | x
 0.0 xargs tail --follow=name --retry
 0.0 tail --follow=name --retry /var/log/gitlab/sshd/current /var/log/gitlab/gitlab-shell/gitlab-shell.log
 0.0 -bash
 0.0 ps -o pcpu,cmd
pidstat 1 1命令会按照进程打印CPU的用量,包括用户态和系统态时间的分解,
-
%CPU:进程占用cpu的百分比 -
CPU:处理进程的cpu编号
┌──[root@liruilongs.github.io]-[~]
└─$ pidstat 1 1
Linux 3.10.0-1160.71.1.el7.x86_64 (liruilongs.github.io)        2022年09月05日  _x86_64_        (6 CPU)

23时20分54秒   UID       PID    %usr %system  %guest    %CPU   CPU  Command
23时20分55秒   996       935    0.00    0.99    0.00    0.99     0  etcd
23时20分55秒   998      8108    0.00    0.99    0.00    0.99     2  bundle
23时20分55秒   998      8211    0.99    0.00    0.00    0.99     4  ruby
23时20分55秒     0     11670    0.00    0.99    0.00    0.99     2  pidstat

平均时间:   UID       PID    %usr %system  %guest    %CPU   CPU  Command
平均时间:   996       935    0.00    0.99    0.00    0.99     -  etcd
平均时间:   998      8108    0.00    0.99    0.00    0.99     -  bundle
平均时间:   998      8211    0.99    0.00    0.00    0.99     -  ruby
平均时间:     0     11670    0.00    0.99    0.00    0.99     -  pidstat
┌──[root@liruilongs.github.io]-[~]
└─$
CUP 饱和度
系统范围
vmstat 1 2 虚拟内存统计命令,最后的几列会打印全局范围的CUP平均负载, 当 r > CUP数量即为饱和状态,列r报告了那些正在等待以及正在CPU上运行的线程。
-
r:当前可运行的进程数(运行队列的长度)。这些进程没有等待I/0,而是已经准备好运行。理想状态下, 可运行进程数应与可用CPU的数量相等 -
b:等待1/0完成的被阻塞进程数 -
us:用户态时间。 -
sy:系统态时间(内核)。 -
id:空闲。 -
wa:等待I/O,即线程被阻塞等待磁盘I/O时的CPU空闲时间。 -
st:偷取(未在输出里显示),CPU在虚拟化的环境下在其他租户上的开销。
┌──[root@liruilongs.github.io]-[~]
└─$ vmstat  1 2
procs -----------memory---------- ---swap-- -----io---- -system-- ------cpu-----
 r  b   swpd   free   buff  cache   si   so    bi    bo   in   cs us sy id wa st
 1  0      0 22877932   3104 1122588    0    0    74    35  173  246  1  1 98  0  0
 0  0      0 22878064   3104 1122592    0    0     0    25  663 1094  0  0 100  0  0
sar -q 系统活动报告器,-q 参数展示包括运行队列长度列runq-sz(等待数加上运行数,与vmstat的r列相同)和平均负载ldavg-1 ldavg-5 ldavg-15 。当 runq-sz > CUP数量时CPU饱和
┌──[root@liruilongs.github.io]-[~]
└─$ sar -q
Linux 3.10.0-1160.71.1.el7.x86_64 (liruilongs.github.io)        2022年09月05日  _x86_64_        (6 CPU)

22时56分20秒       LINUX RESTART

23时00分01秒   runq-sz  plist-sz   ldavg-1   ldavg-5  ldavg-15   blocked
23时10分01秒         1       665      0.11      0.09      0.12         0
23时20分01秒         0       667      0.00      0.03      0.08         0
平均时间:         0       666      0.06      0.06      0.10         0
dstat -p 1 2命令,当run > CPU 数量时,CPU饱和
┌──[root@liruilongs.github.io]-[~]
└─$ dstat -p 1 2
---procs---
run blk new
  0   0 7.0
  0   0 1.0
  0   0 4.0
四、CCPU资源的负载特征归纳检查清单
包括如何获取每项指标’首先尽量使用己有的操作系统观测工具.
execsnoop
execsnoop(8) 可以列出新进程运行信息,是一个CPU调度监控工具,用于跟踪全系统中的新进程执行信息。利用这个工具可以找到 消耗大量CPU的短期进程,并且可以用来分析软件执行过程,包括启动脚本等。
execsnoop(8)直接跟踪 execve(2)系统调用(是最常用的exec(2)变体),可以直接打印 execve(2)的调用参数和返回值。
┌──[root@liruilongs.github.io]-[/usr/share/bcc/tools]
└─$./execsnoop
PCOMM            PID     PPID    RET ARGS
sshd             50066   1076      0 /usr/sbin/sshd -D -R
unix_chkpwd      50068   50066     0  root
unix_chkpwd      50069   50066     0  root
bash             50071   50070     0 /bin/bash
id               50072   50071     0 /usr/bin/id -un
hostnamectl      50074   50073     0 /usr/bin/hostnamectl --transient
8                50075   1         0 /proc/self/fd/8 --deserialize 76 --log-level info --log-target journal-or-kmsg
systemd-hostnam  50075   1         0 /usr/lib/systemd/systemd-hostnamed
grepconf.sh      50077   50071     0 /usr/libexec/grepconf.sh -c
grep             50078   50077     0 /usr/bin/grep -qsi ^COLOR.*none /etc/GREP_COLORS
.................................
一般情况下 execsnoop(8)用来寻找高频出现、消耗资源的短期进程,比如那种频繁创建销毁的,或者是那种一直新建连接的。
列表解释:
-
PCOMM:进程名称 -
PID:进程ID -
PPID:父进程ID -
RET:系统调用返回值,0表示成功 -
ARGS:系统调用的参数
exitsnoop
exitsnoop(8)'是一个BCC 工具,用于跟踪进程的退出事件,打印出进程的总运行时长和退出原因。运行时长是指进程从创建到终止的时长,包括CPU运行时间和非运行时间(就绪和等待)。
使用的是sched:sched_process_exit内核跟踪点和它的参数信息,同时利用 bpf_get_current_task()以便从task 结构体中读取起始信息(这并不是一个稳定接口)。
这里我们使用上面的创建进程的 py 脚本来观察 exitsnoop
┌──[root@vms99.liruilongs.github.io]-[~]
└─$python jc.py
Task started, will run for 2 seconds.
Task started, will run for 2 seconds.
Task started, will run for 2 seconds.
Task started, will run for 2 seconds.
Task started, will run for 2 seconds.
Task finished.
Task finished.
Task finished.
Task finished.
Task finished.
All tasks completed.
通过下面的输出可以看到,exitsnoop 和 execsnoop 虽然都可以用来调试短期进程,但是是的有区别的,exitsnoop 可以跟踪那些 没有调用 exec以及变体创建进程的进程,他同时会输出父进程和子进程的数据。
┌──[root@vms99.liruilongs.github.io]-[/usr/share/bcc/tools]
└─$./exitsnoop
PCOMM            PID     PPID    TID     AGE(s)  EXIT_CODE
python3          37904   37903   37904   2.00    0
python3          37908   37903   37908   2.00    0
python3          37907   37903   37907   2.00    0
python3          37906   37903   37906   2.00    0
python3          37905   37903   37905   2.01    0
python3          37903   2082    37903   2.04    0
输出信息中可以看到,最长时间的进程为父进程,上面的进程都为子进程。同时展示了线程ID,EXIT_CODE 列可以看到线程的退出状态码
cpudist
通过 cpudist 可以展示每次线程唤醒之后在CPU上执行的时长分布的直方图。
需要说明 cpudist 在内部跟踪 CPU 调度器的上下文切换事件,在生产环境中如果频繁的上下文切换,那么这个工具的额外开销就很严重。
可以看到在 10 秒中 8192 -> 16383 us 为最多的时间区间,即线程在CPU上执行的时间相对较长,没有发生频繁的上下文切换。
┌──[root@vms99.liruilongs.github.io]-[/usr/share/bcc/tools]
└─$cpudist 10 1
Tracing on-CPU time... Hit Ctrl-C to end.

     usecs               : count     distribution
         0 -> 1          : 0        |                                        |
         2 -> 3          : 16       |                                        |
         4 -> 7          : 250      |***                                     |
         8 -> 15         : 232      |***                                     |
        16 -> 31         : 471      |*******                                 |
        32 -> 63         : 158      |**                                      |
        64 -> 127        : 70       |*                                       |
       128 -> 255        : 34       |                                        |
       256 -> 511        : 5        |                                        |
       512 -> 1023       : 0        |                                        |
      1024 -> 2047       : 12       |                                        |
      2048 -> 4095       : 45       |                                        |
      4096 -> 8191       : 160      |**                                      |
      8192 -> 16383      : 2621     |****************************************|
     16384 -> 32767      : 602      |*********                               |
     32768 -> 65535      : 288      |****                                    |
     65536 -> 131071     : 27       |                                        |
    131072 -> 262143     : 2        |                                        |
┌──[root@vms99.liruilongs.github.io]-[/usr/share/bcc/tools]
└─$
使用 -m 参数可以按照毫秒数输出,这时可以看到 CPU 上线文切换非常快,每个线程运行时间为 0-1 毫秒,也就是 0-1000 微秒。实际上这是在一个空闲的机器的执行的。如果在一个生产系统,频繁的上线文切换,而且CPU 唤醒之后执行时间很少,就可能存在性能问题
┌──[root@vms99.liruilongs.github.io]-[/usr/share/bcc/tools]
└─$cpudist -m
Tracing on-CPU time... Hit Ctrl-C to end.

^C
     msecs               : count     distribution
         0 -> 1          : 1019     |****************************************|
         2 -> 3          : 0        |                                        |
         4 -> 7          : 0        |                                        |
         8 -> 15         : 1        |                                        |
┌──[root@vms99.liruilongs.github.io]-[/usr/share/bcc/tools]
└─$cpu
profile
profile 是一个定时采样调用栈信息并汇报调用栈出现频率信息的一个工具,该工具的消耗基本可以忽略不计,而且采样频率可以随时调整。
默认情况下,该工具会以 49Hz 的频率同时采样所有的 CPU 内核态和用户态的调用栈信息。但是用户态的栈信息往往会获取不到
┌──[root@vms99.liruilongs.github.io]-[/usr/share/bcc/tools]
└─$profile
Sampling at 49 Hertz of all threads by user + kernel stack... Hit Ctrl-C to end.
^C
    _raw_spin_unlock_irqrestore
    _raw_spin_unlock_irqrestore
    prepare_to_swait_event
    rcu_gp_kthread
    kthread
    ret_from_fork
    -                rcu_sched (14)
        1

    kmem_cache_alloc_node
    kmem_cache_alloc_node
    __alloc_skb
    __ip_append_data.isra.50
    ip_append_data.part.51
    ip_send_unicast_reply
    tcp_v4_send_reset
    tcp_v4_rcv
    ip_protocol_deliver_rcu
    ip_local_deliver_finish
    ip_local_deliver
    ip_rcv
    __netif_receive_skb_core
    process_backlog
    __napi_poll
    net_rx_action
    __softirqentry_text_start
    do_softirq_own_stack
    do_softirq.part.16
    __local_bh_enable_ip
    ip_finish_output2
    ip_output
    __ip_queue_xmit
    __tcp_transmit_skb
    tcp_connect
    tcp_v4_connect
    __inet_stream_connect
    inet_stream_connect
    __sys_connect
    __x64_sys_connect
    do_syscall_64
    entry_SYSCALL_64_after_hwframe
    [unknown]
    -                haproxy (1203)
        1

    show_vma_header_prefix
    show_vma_header_prefix
    show_map_vma
    show_map
    seq_read
    vfs_read
    ksys_read
    do_syscall_64
    entry_SYSCALL_64_after_hwframe
    [unknown]
    [unknown]
    -                awk (39726)
        1
.............
┌──[root@vms99.liruilongs.github.io]-[/usr/share/bcc/tools]
└─$
通过输出我们可以看到,第一个采集的线程为 rcu_sched,PID 为 14, 采集可一次。与内核的 RCU 机制有关。
第二个调用栈数据为 haproxy 进程,pid 为 1203,通过内核态函数的调用可以看到主要进网络数据包的处理,以及TCP 连接的建立。
-
kmem_cache_alloc_node表示分配内存。 -
__ip_append_data 和 ip_send_unicast_reply表示处理 IP 数据。 -
tcp_v4_send_reset 和 tcp_v4_rcv表示 TCP 协议的处理。 -
__sys_connect 和 __x64_sys_connect表示进行系统调用以建立连接。
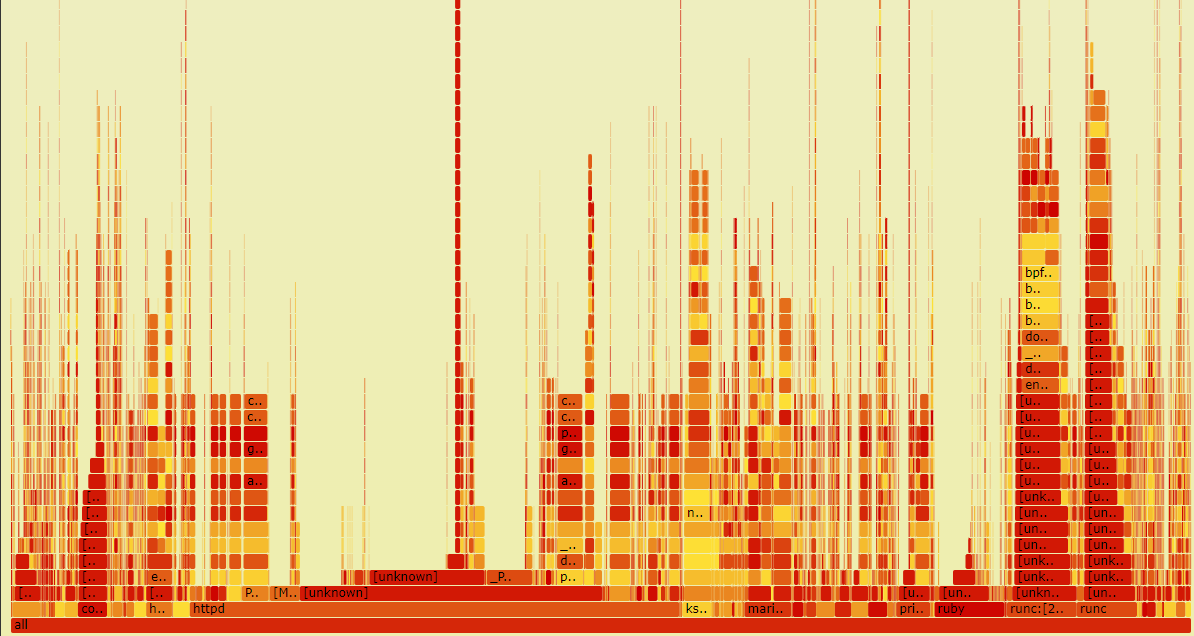
实际中生产环境, 上面的输出会很多,所以一般情况会通过火焰图快速理解 prefile 的命令的输出。
火焰图
通过 -f 折叠输出,通过 -a 来标记 内核态和用户态函数。
┌──[root@vms99.liruilongs.github.io]-[~]
└─$profile -af 20 > profilelrl.log
需要使用 FlameGraph 项目来输出,所以这里我们克隆项目
┌──[root@vms99.liruilongs.github.io]-[~]
└─$git clone https://github.com/brendangregg/FlameGraph.git
正克隆到 'FlameGraph'...
remote: Enumerating objects: 1285, done.
remote: Counting objects: 100% (707/707), done.
remote: Compressing objects: 100% (146/146), done.
remote: Total 1285 (delta 584), reused 575 (delta 561), pack-reused 578
接收对象中: 100% (1285/1285), 1.92 MiB | 174.00 KiB/s, 完成.
处理 delta 中: 100% (761/761), 完成.
┌──[root@vms99.liruilongs.github.io]-[~]
└─$cd FlameGraph/
然后通过下面的命令生成对应的 火焰图 矢量图
┌──[root@vms99.liruilongs.github.io]-[~/FlameGraph]
└─$./flamegraph.pl  --hash --bgcolors=grey <  ../out.txt > out.svg
Can't locate open.pm in @INC (you may need to install the open module) (@INC contains: /usr/local/lib64/perl5 /usr/local/share/perl5 /usr/lib64/perl5/vendor_perl /usr/share/perl5/vendor_perl /usr/lib64/perl5 /usr/share/perl5) at ./flamegraph.pl line 97.
BEGIN failed--compilation aborted at ./flamegraph.pl line 97.
可以看到报错了,这个错误消息表明在运行 ./flamegraph.pl 脚本时,Perl 解释器无法找到所需的 open.pm 模块。该模块可能没有正确安装或没有包含在 Perl 解释器的模块搜索路径中。
要解决这个问题,你可以尝试以下几个步骤:
检查模块安装:确保 open.pm 模块已经正确安装。你可以使用 CPAN 或其他 Perl 模块管理工具来安装该模块。
安装模块管理器
┌──[root@vms99.liruilongs.github.io]-[~/FlameGraph]
└─$yum install perl-CPAN -y
安装模块
┌──[root@vms99.liruilongs.github.io]-[~/FlameGraph]
└─$cpan open
Loading internal null logger. Install Log::Log4perl for logging messages

CPAN.pm requires configuration, but most of it can be done automatically.
If you answer 'no' below, you will enter an interactive dialog for each
configuration option instead.

Would you like to configure as much as possible automatically? [yes] yes
CPAN: HTTP::Tiny loaded ok (v0.074)
...............
http://www.cpan.org/modules/03modlist.data.gz
Reading '/root/.cpan/sources/modules/03modlist.data.gz'
DONE
Writing /root/.cpan/Metadata
Running install for module 'open'
The most recent version "1.13" of the module "open"
is part of the perl-5.38.2 distribution. To install that, you need to run
  force install open   --or--
  install P/PE/PEVANS/perl-5.38.2.tar.gz
安装完之后提示我们需要安装对应的 perl 版本
┌──[root@vms99.liruilongs.github.io]-[~/FlameGraph]
└─$perl -v

This is perl 5, version 26, subversion 3 (v5.26.3) built for x86_64-linux-thread-multi
(with 58 registered patches, see perl -V for more detail)

Copyright 1987-2018, Larry Wall

Perl may be copied only under the terms of either the Artistic License or the
GNU General Public License, which may be found in the Perl 5 source kit.

Complete documentation for Perl, including FAQ lists, should be found on
this system using "man perl" or "perldoc perl".  If you have access to the
Internet, point your browser at http://www.perl.org/, the Perl Home Page.

┌──[root@vms99.liruilongs.github.io]-[~/FlameGraph]
└─$yum -y install  perl -y
升级 perl 版本之后,火焰图可以正常生成,通过帮助文档可以简单了解命令的使用
┌──[root@vms99.liruilongs.github.io]-[~]
└─$./FlameGraph/flamegraph.pl  --help
USAGE: ./FlameGraph/flamegraph.pl [options] infile > outfile.svg

        --title TEXT     # change title text
        --subtitle TEXT  # second level title (optional)
        --width NUM      # width of image (default 1200)
        --height NUM     # height of each frame (default 16)
        --minwidth NUM   # omit smaller functions. In pixels or use "%" for
                         # percentage of time (default 0.1 pixels)
        --fonttype FONT  # font type (default "Verdana")
        --fontsize NUM   # font size (default 12)
        --countname TEXT # count type label (default "samples")
        --nametype TEXT  # name type label (default "Function:")
        --colors PALETTE # set color palette. choices are: hot (default), mem,
                         # io, wakeup, chain, java, js, perl, red, green, blue,
                         # aqua, yellow, purple, orange
        --bgcolors COLOR # set background colors. gradient choices are yellow
                         # (default), blue, green, grey; flat colors use "#rrggbb"
        --hash           # colors are keyed by function name hash
        --random         # colors are randomly generated
        --cp             # use consistent palette (palette.map)
        --reverse        # generate stack-reversed flame graph
        --inverted       # icicle graph
        --flamechart     # produce a flame chart (sort by time, do not merge stacks)
        --negate         # switch differential hues (blue<->red)
        --notes TEXT     # add notes comment in SVG (for debugging)
        --help           # this message

        eg,
        ./FlameGraph/flamegraph.pl --title="Flame Graph: malloc()" trace.txt > graph.svg
输出我们上面的采集数据,启动一个 http 服务访问
┌──[root@vms99.liruilongs.github.io]-[~]
└─$./FlameGraph/flamegraph.pl  < profilelrl.log > profilelrl.svg
┌──[root@vms99.liruilongs.github.io]-[~]
└─$python -m http.server
Serving HTTP on 0.0.0.0 port 8000 (http://0.0.0.0:8000/) ...
192.168.26.1 - - [18/Oct/2024 05:15:37] "GET / HTTP/1.1" 200 -
192.168.26.1 - - [18/Oct/2024 05:15:37] code 404, message File not found
192.168.26.1 - - [18/Oct/2024 05:15:37] "GET /favicon.ico HTTP/1.1" 404 -
192.168.26.1 - - [18/Oct/2024 05:15:52] "GET /profilelrl.svg HTTP/1.1" 200 -
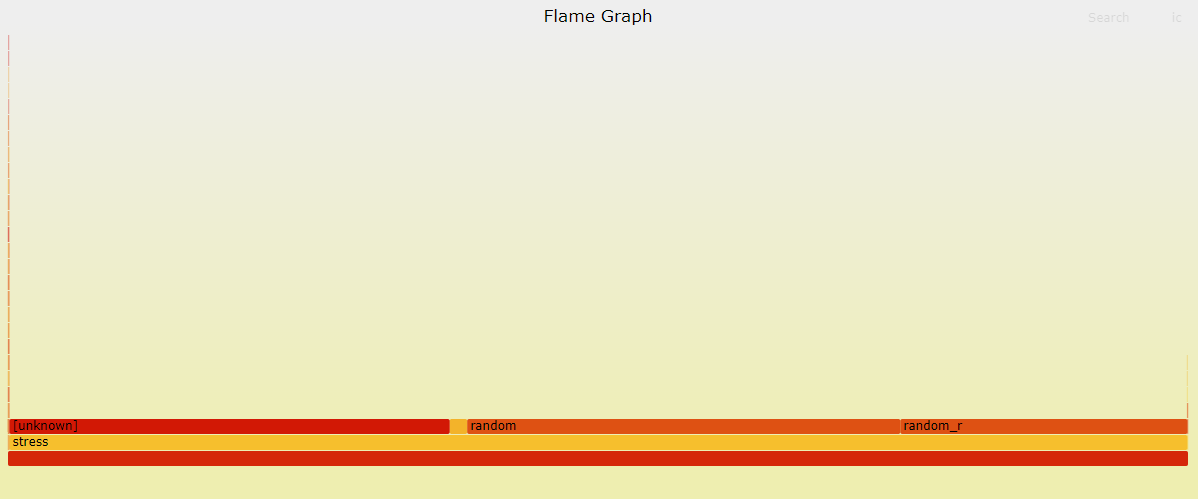
可以看到采集的应用程序调用栈很少,当前系统是一个空闲的系统,我们使用 stress 来做 CPU 负载模拟,所以看到的基本上是 stress 的调用栈
实际上生产场景的火焰图相对复杂
runqlat
CPU 调度的最小单位为线程,线程的运行队列长度可以反应CPU 是否处于饱和状态, runqlat 是基于 BCC 和 bpftrace 的 CPU 调度器延迟分析工具,CPU 调度器延迟通常被称为运行队列延迟,实际上不是简单的队列, runqlat 统计的是每个线程等待CPU的耗时。
这里我们通过 stress 来模拟CPU 的饱和状态。启动 100 个线程
┌──[root@vms99.liruilongs.github.io]-[~]
└─$stress --cpu 100 --timeout 100s
stress: info: [38244] dispatching hogs: 100 cpu, 0 io, 0 vm, 0 hdd
stress: info: [38244] successful run completed in 100s
┌──[root@vms99.liruilongs.github.io]-[~]
└─$
下面的命令使用 runqlat 每隔 10 秒输出一次, 就输出一次的的直方图数据,
-
usecs:表示延迟的时间区间(以微秒为单位)。 -
count:表示在该时间区间内发生的事件数量。 -
distribution:通过星号 (*) 表示的分布图,用于可视化延迟的分布。
┌──[root@vms99.liruilongs.github.io]-[/usr/share/bcc/tools]
└─$./runqlat 10 1
Tracing run queue latency... Hit Ctrl-C to end.

     usecs               : count     distribution
         0 -> 1          : 13       |                                        |
         2 -> 3          : 119      |**                                      |
         4 -> 7          : 355      |******                                  |
         8 -> 15         : 183      |***                                     |
        16 -> 31         : 144      |**                                      |
        32 -> 63         : 219      |***                                     |
        64 -> 127        : 72       |*                                       |
       128 -> 255        : 21       |                                        |
       256 -> 511        : 22       |                                        |
       512 -> 1023       : 74       |*                                       |
      1024 -> 2047       : 143      |**                                      |
      2048 -> 4095       : 214      |***                                     |
      4096 -> 8191       : 326      |*****                                   |
      8192 -> 16383      : 247      |****                                    |
     16384 -> 32767      : 200      |***                                     |
     32768 -> 65535      : 331      |*****                                   |
     65536 -> 131071     : 586      |**********                              |
    131072 -> 262143     : 2295     |****************************************|
    262144 -> 524287     : 1589     |***************************             |
    524288 -> 1048575    : 554      |*********                               |
   1048576 -> 2097151    : 31       |                                        |
   2097152 -> 4194303    : 1        |                                        |
┌──[root@vms99.liruilongs.github.io]-[/usr/share/bcc/tools]
└─$
可以看到,离群点为较高的延迟 131072 微秒及以上 占整个延迟区间的大部分,通过分布图也可以直观的感受。大部分线程处于等待状态,并且等待时间较长,可以确定当前CPU 呈现饱和状态。
runqlat(8)利用对 CPU 调度器的线程唤醒事件和线程上线文切换事件的跟踪来计算线程从唤醒到运行之前的时间间隔。
在比较繁忙的系统中,这类事件的发生频率可能很好,每秒超过10000次,所以在使用这个命令的时候需要多加注意。
也可以通过 sar(1) 来同时展示 CPU 利用率(-u) 和 运行队列性能指标(-q)。
┌──[root@vms99.liruilongs.github.io]-[/usr/share/bcc/tools]
└─$sar -uq 1
Linux 4.18.0-513.9.1.el8_9.x86_64 (vms99.liruilongs.github.io)  2024年10月09日  _x86_64_        (6 CPU)

11时27分08秒     CPU     %user     %nice   %system   %iowait    %steal     %idle
11时27分09秒     all     96.13      0.00      3.87      0.00      0.00      0.00

11时27分08秒   runq-sz  plist-sz   ldavg-1   ldavg-5  ldavg-15   blocked
11时27分09秒       100       592     15.81     14.33     11.57         0

11时27分09秒     CPU     %user     %nice   %system   %iowait    %steal     %idle
11时27分10秒     all     95.51      0.00      4.49      0.00      0.00      0.00

11时27分09秒   runq-sz  plist-sz   ldavg-1   ldavg-5  ldavg-15   blocked
11时27分10秒       101       592     15.81     14.33     11.57         0
可以看到 用户态CPU 利用率为 趋于饱和,空闲时间为0,同时平均运行队列长度为 100左右,包括正在运行 + 等待的线程(与vmstat的r列相同), 1,5,15 分钟的负载为 15 左右,但是通过下面的输出可以看到当前我们只有6个逻辑核。
┌──[root@vms99.liruilongs.github.io]-[/usr/share/bcc/tools]
└─$lscpu | grep CPU:
CPU:             6
一般情况下,平均负载ldavg-1 ldavg-5 ldavg-15远远超过 CPU 逻辑核数的的时候,认为系统负载非常高,CPU 趋于饱和状态 ,通过 runq-sz > CUP数量 我们可以推断出 平局负载高的原因之一是因为 存在大量的线程在等待CPU调度,堆积在运行队列
实际上对于运行队列的长度我们也可以通过专门的 BPF 工具来采集
runqlen
runqlen 是一个基于 BCC 和 bpftrace 的工具,用于采样 CPU运行队列的长度信息,统计有多少线程正在等待运行,同样可以以直方图的形式展现。
下面的输出为一台空闲的机器的 运行队列长度采集输出。可以看到,大部分时间的运行队列的长度都为0,即线程不需要等待可以立即执行。
┌──[root@vms99.liruilongs.github.io]-[/usr/share/bcc/tools]
└─$./runqlen 10 1
Sampling run queue length... Hit Ctrl-C to end.

     runqlen       : count     distribution
        0          : 5123     |****************************************|
通过 stress 来模拟 CPU 饱和
┌──[root@vms99.liruilongs.github.io]-[~]
└─$stress --cpu 100 --timeout 100s
stress: info: [38556] dispatching hogs: 100 cpu, 0 io, 0 vm, 0 hdd
同样的命令再次执行,可以很明显的看到变化,队列长度集中在 10 到 25 之间,即大部分的CPU任务存在积压,线程需要等待才能执行。
┌──[root@vms99.liruilongs.github.io]-[/usr/share/bcc/tools]
└─$./runqlen 10 1
Sampling run queue length... Hit Ctrl-C to end.

     runqlen       : count     distribution
        0          : 367      |*******************************         |
        1          : 73       |******                                  |
        2          : 39       |***                                     |
        3          : 53       |****                                    |
        4          : 57       |****                                    |
        5          : 45       |***                                     |
        6          : 83       |*******                                 |
        7          : 90       |*******                                 |
        8          : 97       |********                                |
        9          : 84       |*******                                 |
        10         : 118      |**********                              |
        11         : 135      |***********                             |
        12         : 189      |****************                        |
        13         : 110      |*********                               |
        14         : 166      |**************                          |
        15         : 170      |**************                          |
        16         : 318      |***************************             |
        17         : 297      |*************************               |
        18         : 459      |****************************************|
        19         : 232      |********************                    |
        20         : 308      |**************************              |
        21         : 358      |*******************************         |
        22         : 213      |******************                      |
        23         : 137      |***********                             |
        24         : 141      |************                            |
        25         : 143      |************                            |
        26         : 93       |********                                |
        27         : 42       |***                                     |
        28         : 63       |*****                                   |
        29         : 58       |*****                                   |
        30         : 33       |**                                      |
        31         : 29       |**                                      |
        32         : 8        |                                        |
        33         : 33       |**                                      |
        34         : 10       |                                        |
        35         : 13       |*                                       |
        36         : 0        |                                        |
        37         : 0        |                                        |
        38         : 3        |                                        |
┌──[root@vms99.liruilongs.github.io]-[/usr/share/bcc/tools]
└─$
原书作者把运行队列被定义为二级指标,而且运行时间延迟被定义为一级指标,因为运行队列延迟会直接的按比例影响系统性能,而运行队列长度则不一样。
runqlen 可以进一步定性 runqlat 发现的问题,同时,runqlen 的采样频率为 99HZ,而 runqlat 需要跟踪 CPU 调度器,后者比前者有更多的性能消耗,一般情况下,会通过 runqlen 来发现问题,通过runqlat 的量化延迟,确定问题。
当进程进行单CPU亲和性配置的时候,一个进程的多个线程始终中一个CPU运行,这个时候,如果队列长度为3,即可确定该进程,有一个线程中运行,3线程位于队列中。
runqlat 和 runqlen 可以分析当前系统CPU使用异常是否存在由CPU调度延迟影响的,那么如果确定之后,如何定位到具体的线程,或者说应用程序?
runqslower
runqslower 可以列出运行队列中等待延迟超过阈值的线程名字,同时输出受延迟影响的进程名字和对应的延迟时长
┌──[root@vms99.liruilongs.github.io]-[/usr/share/bcc/tools]
└─$./runqslower
Tracing run queue latency higher than 10000 us
TIME     COMM             TID           LAT(us)
12:11:12 b'stress'        39402           13089
12:11:12 b'stress'        39401           14679
12:11:12 b'stress'        39397           23660
12:11:12 b'stress'        39395           17852
12:11:12 b'kworker/u256:28' 573             22854
12:11:12 b'stress'        39398           34532
12:11:12 b'stress'        39399           52749
12:11:12 b'stress'        39400          107725
12:11:12 b'runqslower'    39303           76346
12:11:12 b'kworker/u256:28' 573             11797
12:11:12 b'stress'        39408           10779
12:11:12 b'stress'        39405          134470
12:11:12 b'runqslower'    39303           10063
12:11:12 b'stress'        39410           19963
12:11:12 b'stress'        39407          150640
12:11:12 b'runqslower'    39303           11418
12:11:12 b'stress'        39370           13291
12:11:12 b'stress'        39403          132886
12:11:12 b'runqslower'    39303           33169
12:11:12 b'stress'        39390          121633
上面的输出为超过默认阈值 10000 us 毫秒的的运行队列发生的次数,可以看到大多为上面的测试工具 stress 的线程。LAT(us)为线程在运行队列中的等待延迟,单位是微秒。
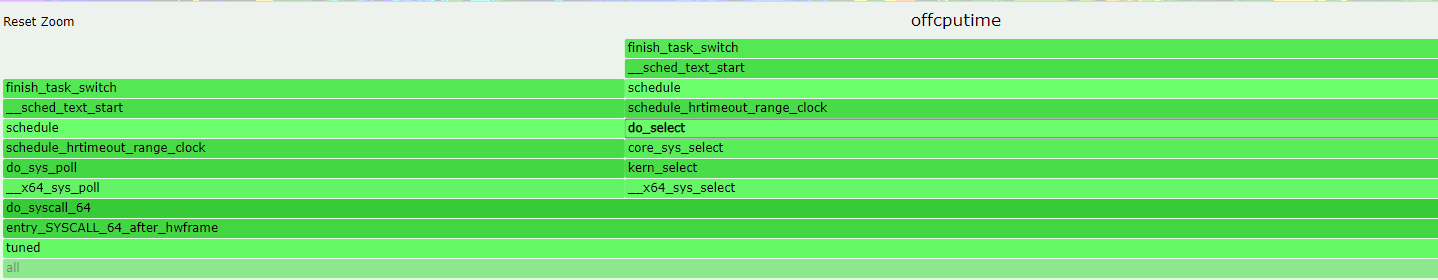
offcputime
offcputime(8) 用于统计线程阻塞和脱离CPU 运行的时间,同时会输出调用栈信息,
输出顺序依次为 内核态函数,用户态件函数,之后是进程名字,ID 以及调用栈出现的全部时间,也就是脱离时间。
┌──[root@vms99.liruilongs.github.io]-[/usr/share/bcc/tools]
└─$offcputime 1
Tracing off-CPU time (us) of all threads by user + kernel stack for 1 secs.

    。。。。。。。。。。。。。。。。。。。。。。。。。。

    finish_task_switch
    __sched_text_start
    schedule
    schedule_hrtimeout_range_clock
    do_select
    core_sys_select
    kern_select
    __x64_sys_select
    do_syscall_64
    entry_SYSCALL_64_after_hwframe
    __select
    -                httpd (38029)
        921073

    finish_task_switch
    __sched_text_start
    schedule
    schedule_hrtimeout_range_clock
    do_select
    core_sys_select
    kern_select
    __x64_sys_select
    do_syscall_64
    entry_SYSCALL_64_after_hwframe
    __select
    -                tuned (1713)
        947681

。。。。。。。。
┌──[root@vms99.liruilongs.github.io]-[/usr/share/bcc/tools]
└─$
以上面的 httpd 为例,httpd 服务被阻塞,进程号为38029,脱离时长为 38029 微秒。
可以看到只有内核态函数,没有用户态函数,栈顶函数为 __select,用于在内核中处理文件描述符的状态检查。一旦某个文件描述符变为可用,或超时发生,__select 将返回,表明可以开始进行相应的 I/O 操作。即可以立即为当前进行脱离CPU的原因为 IO 阻塞。
offcputime 同时也可以用来分析并发的场景,比如长时间的锁等待之类,通过对函数的调用栈进行分析。
看一个 lock 的 Demo
┌──[root@vms99.liruilongs.github.io]-[~]
└─$cat lock_demo.py
import threading
import time

lock = threading.Lock()

def worker(id):
    print(f"Worker {id} started")
    with lock:
        print(f"Worker {id} acquired lock")
        time.sleep(2)  # 模拟长时间的计算或 I/O
    print(f"Worker {id} released lock")

threads = []
for i in range(5):
    t = threading.Thread(target=worker, args=(i,))
    threads.append(t)
    t.start()

for t in threads:
    t.join()

print("All workers finished")
一个基本的线程安全Demo,执行分析
┌──[root@vms99.liruilongs.github.io]-[~]
└─$python lock_demo.py
Worker 0 started
Worker 0 acquired lock
Worker 1 started
Worker 2 started
Worker 3 started
Worker 4 started
Worker 0 released lock
Worker 1 acquired lock
Worker 1 released lock
Worker 2 acquired lock
Worker 2 released lock
Worker 3 acquired lock
Worker 3 released lock
Worker 4 acquired lock
Worker 4 released lock
All workers finished
threadsnoop 观察线程创建情况
┌──[root@vms99.liruilongs.github.io]-[~]
└─$threadsnoop
TIME(ms)   PID     COMM             FUNC
0          51671   b'python3'       b'[unknown]'
0          51671   b'python3'       b'[unknown]'
0          51671   b'python3'       b'[unknown]'
0          51671   b'python3'       b'[unknown]'
0          51671   b'python3'       b'[unknown]'
offcputime 观察脱离情况
┌──[root@vms99.liruilongs.github.io]-[~/FlameGraph]
└─$offcputime  -p `pgrep -f lock_demo.py`
Tracing off-CPU time (us) of PID 51397 by user + kernel stack... Hit Ctrl-C to end.
^C
    .......................
    finish_task_switch
    __sched_text_start
    schedule
    futex_wait_queue_me
    futex_wait
    do_futex
    __x64_sys_futex
    do_syscall_64
    entry_SYSCALL_64_after_hwframe
    [unknown]
    -                python3 (51402)
        157

    finish_task_switch
    __sched_text_start
    schedule
    futex_wait_queue_me
    futex_wait
    do_futex
    __x64_sys_futex
    do_syscall_64
    entry_SYSCALL_64_after_hwframe
    [unknown]
    -                python3 (51400)
        213

    finish_task_switch
    __sched_text_start
    schedule
    futex_wait_queue_me
    futex_wait
    do_futex
    __x64_sys_futex
    do_syscall_64
    entry_SYSCALL_64_after_hwframe
    [unknown]
    -                python3 (51397)
        267

    finish_task_switch
    __sched_text_start
    schedule
    do_nanosleep
    hrtimer_nanosleep
    common_nsleep_timens
    __x64_sys_clock_nanosleep
    do_syscall_64
    entry_SYSCALL_64_after_hwframe
    [unknown]
    [unknown]
    -                python3 (51400)
        2002609

    finish_task_switch
    __sched_text_start
    schedule
    do_nanosleep
    hrtimer_nanosleep
    common_nsleep_timens
    __x64_sys_clock_nanosleep
    do_syscall_64
    entry_SYSCALL_64_after_hwframe
    [unknown]
    [unknown]
    -                python3 (51402)
        2003178
..................
┌──[root@vms99.liruilongs.github.io]-[~/FlameGraph]
└─$
简单分析调用栈中的函数:
futex_wait_queue_me 和 futex_wait:这些函数表明线程正在等待一个 futex(快速用户空间锁),通常是由于线程在等待某个锁或条件变量。
do_futex 和 __x64_sys_futex:这些函数表示进行系统调用以处理 futex。
do_nanosleep 和 hrtimer_nanosleep:这些函数表明线程正在进行睡眠操作(例如,使用 time.sleep()),使其在指定的时间内脱离 CPU。
unknown 这是一个用户态方法没有捕获到函数名字
多个线程在竞争同一个锁,导致它们在 futex 等待队列中排队。这是并发编程中常见的问题,尤其是在使用锁或条件变量时。
脱离CPU 火焰图
和火焰图一样,实际上面的输出会很多,通过脱离火焰图可以更方便的查看。
┌──[root@vms99.liruilongs.github.io]-[~]
└─$./FlameGraph/flamegraph.pl  --bgcolors=green  --colors=green   --title='offcputime' --height=20  --width=1926  < offcputime.log > offcputime.log.svg
当前系统的所以脱离CPU数据
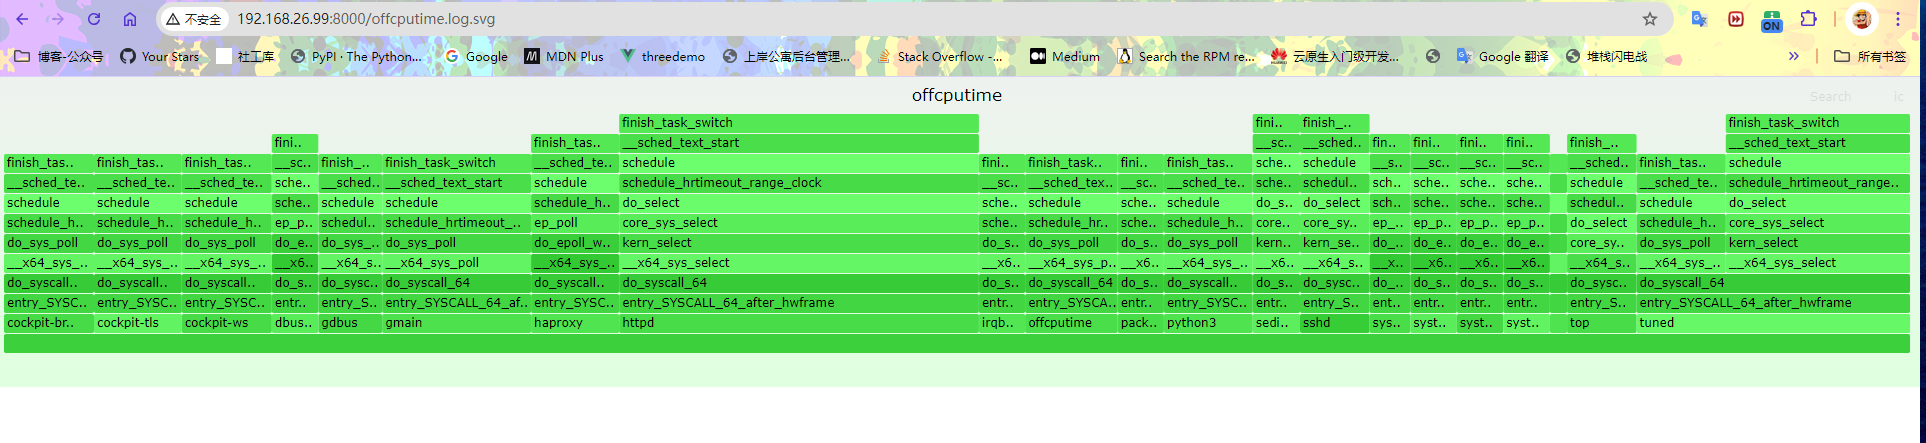
下转到某个线程查看
softirqs
softirqs(8) 用于显示系统中软中断消耗的CPU 时间,软中断事件的计数记录在 /proc/softirqs 中,全系统的软中断可以通过 mpstat(1) 中的 %soft 列显示
BCC版本的 softirqs 可以计数,同时可以输出每个 IRQ 的处理时间。
┌──[root@vms99.liruilongs.github.io]-[/usr/share/bcc/tools]
└─$softirqs  10 1
Tracing soft irq event time... Hit Ctrl-C to end.

SOFTIRQ          TOTAL_usecs
net_tx                     6
block                     21
net_rx                   203
sched                   3456
timer                   7674
rcu                    72515
┌──[root@vms99.liruilongs.github.io]-[/usr/share/bcc/tools]
└─$
列明解释:
-
SOFTIRQ:软中断的类型。 -
TOTAL_usecs:每种软中断类型在采样期间消耗的总微秒数。
上面的软中断类型:
-
net_tx:网络数据包发送软中断,消耗了6微秒。 -
block:块设备I/O软中断,消耗了21微秒。 -
net_rx:网络数据包接收软中断,消耗了203微秒。 -
sched:调度软中断,消耗了3456微秒。例如进程切换 -
timer:定时器软中断,消耗了7674微秒。例如周期性任务 -
rcu:RCU(Read-Copy-Update)软中断,消耗了72515微秒。主要用于并发数据结构的更新。
-d 将 IRQ 时间以直方图显示,可以直观的识别中断处理中某些耗时很长的情况。
┌──[root@vms99.liruilongs.github.io]-[~/FlameGraph]
└─$softirqs -d 10 1
Tracing soft irq event time... Hit Ctrl-C to end.


softirq = sched
     usecs               : count     distribution
         0 -> 1          : 34       |***                                     |
         2 -> 3          : 318      |********************************        |
         4 -> 7          : 394      |****************************************|
         8 -> 15         : 31       |***                                     |
        16 -> 31         : 10       |*                                       |
        32 -> 63         : 8        |                                        |
        64 -> 127        : 0        |                                        |
       128 -> 255        : 1        |                                        |

softirq = timer
     usecs               : count     distribution
         0 -> 1          : 2        |                                        |
         2 -> 3          : 41       |*****                                   |
         4 -> 7          : 228      |********************************        |
         8 -> 15         : 280      |****************************************|
        16 -> 31         : 26       |***                                     |
        32 -> 63         : 36       |*****                                   |
        64 -> 127        : 15       |**                                      |
       128 -> 255        : 2        |                                        |

softirq = net_rx
     usecs               : count     distribution
         0 -> 1          : 20       |****************************************|
         2 -> 3          : 4        |********                                |
         4 -> 7          : 10       |********************                    |
         8 -> 15         : 17       |**********************************      |
        16 -> 31         : 8        |****************                        |
        32 -> 63         : 5        |**********                              |
        64 -> 127        : 4        |********                                |
       128 -> 255        : 1        |**                                      |

softirq = rcu
     usecs               : count     distribution
         0 -> 1          : 377      |****************************************|
         2 -> 3          : 37       |***                                     |
         4 -> 7          : 65       |******                                  |
         8 -> 15         : 30       |***                                     |
        16 -> 31         : 59       |******                                  |
        32 -> 63         : 7        |                                        |
        64 -> 127        : 2        |                                        |
       128 -> 255        : 1        |                                        |

softirq = tasklet
     usecs               : count     distribution
         0 -> 1          : 0        |                                        |
         2 -> 3          : 0        |                                        |
         4 -> 7          : 0        |                                        |
         8 -> 15         : 0        |                                        |
        16 -> 31         : 0        |                                        |
        32 -> 63         : 1        |****************************************|

softirq = block
     usecs               : count     distribution
         0 -> 1          : 0        |                                        |
         2 -> 3          : 0        |                                        |
         4 -> 7          : 0        |                                        |
         8 -> 15         : 0        |                                        |
        16 -> 31         : 4        |****************************************|

softirq = net_tx
     usecs               : count     distribution
         0 -> 1          : 0        |                                        |
         2 -> 3          : 2        |****************************************|
         4 -> 7          : 1        |********************                    |
┌──[root@vms99.liruilongs.github.io]-[~/FlameGraph]
└─$
可以看到大部分软中断处理时间都在 0 到 15 微秒之间,这表明系统对于大多数常见事件(如网络接收、定时器等)的响应是高效的。
一些软中断的处理时间较长(如 RCU 和定时器),可能需要进一步调查以优化性能。
tasklet 和 block 软中断的触发频率较低,可能表明这些功能在当前负载下使用不多。
hardirqs
hardirqs 用来显示 硬中断的时间,和软中断的使用方法一样,
┌──[root@vms99.liruilongs.github.io]-[/usr/share/bcc/tools]
└─$hardirqs 10 1
Tracing hard irq event time... Hit Ctrl-C to end.

HARDIRQ                    TOTAL_usecs
ens160-rxtx-0                        5
ens160-rxtx-2                        6
nvme0q3                             22
nvme0q4                             22
nvme0q2                             23
ahci[0000:02:03.0]                  39
┌──[root@vms99.liruilongs.github.io]-[/usr/share/bcc/tools]
└─$
-
ens160-rxtx*: 网络相关的收发操作,中断时间很少 -
nvme0q*: 与 NVMe 存储设备的队列相关的硬中断 -
ahci[0000:02:03.0]: 与AHCI控制器相关的硬中断,处理时间为 39 微秒。这个时间相对较长,可能指示在处理 SATA 设备数据时存在一些延迟
也可以以直方图的形式输出 IRQ 时间信息
┌──[root@vms99.liruilongs.github.io]-[~/FlameGraph]
└─$hardirqs -Td  10 1
Tracing hard irq event time... Hit Ctrl-C to end.

06:37:27

hardirq = nvme0q5
     usecs               : count     distribution
         0 -> 1          : 0        |                                        |
         2 -> 3          : 0        |                                        |
         4 -> 7          : 0        |                                        |
         8 -> 15         : 1        |*************                           |
        16 -> 31         : 3        |****************************************|
        32 -> 63         : 1        |*************                           |

hardirq = ens160-rxtx-0
     usecs               : count     distribution
         0 -> 1          : 26       |******************************          |
         2 -> 3          : 26       |******************************          |
         4 -> 7          : 34       |****************************************|
         8 -> 15         : 8        |*********                               |

hardirq = ens160-rxtx-1
     usecs               : count     distribution
         0 -> 1          : 9        |***************************             |
         2 -> 3          : 13       |****************************************|
         4 -> 7          : 6        |******************                      |

.................
syscount
syscount 用来统计系统中的系统调用数量,用于解决内核态使用率高是不是由于系统调用导致的?具体是哪些系统调用?
每 10 秒的系统调用输出,可以看到最频繁的是 select,用于 I/O 处理
┌──[root@vms99.liruilongs.github.io]-[/usr/share/bcc/tools]
└─$syscount -i 10
Tracing syscalls, printing top 10... Ctrl+C to quit.
[12:28:20]
SYSCALL                   COUNT
select                      729
semop                       188
bpf                          55
epoll_wait                   52
setsockopt                   51
connect                      50
close                        29
socket                       26
fcntl                        25
read                         15
..............

Detaching...
┌──[root@vms99.liruilongs.github.io]-[/usr/share/bcc/tools]
└─$
如果我们确定了某个系统调用很频繁,需要进一步分析,可以使用 argdist 来通过内核跟踪点或者内核函数来统计调用的参数和返回值
argdist
以上文的 read 内核函数为例,通过 tplist 方法获取参数信息
┌──[root@vms99.liruilongs.github.io]-[~/FlameGraph]
└─$tplist -v syscalls:sys_enter_read
syscalls:sys_enter_read
    int __syscall_nr;
    unsigned int fd;
    char * buf;
    size_t count;
count 为调用的读缓存大小,然后使用 argdist 来输出直方图信息
┌──[root@vms99.liruilongs.github.io]-[~/FlameGraph]
└─$argdist -H 't:syscalls:sys_enter_read():int:args->count'
..............
[06:20:16]
     args->count         : count     distribution
         0 -> 1          : 0        |                                        |
         2 -> 3          : 0        |                                        |
         4 -> 7          : 0        |                                        |
         8 -> 15         : 0        |                                        |
        16 -> 31         : 0        |                                        |
        32 -> 63         : 0        |                                        |
        64 -> 127        : 0        |                                        |
       128 -> 255        : 0        |                                        |
       256 -> 511        : 0        |                                        |
       512 -> 1023       : 0        |                                        |
      1024 -> 2047       : 0        |                                        |
      2048 -> 4095       : 0        |                                        |
      4096 -> 8191       : 0        |                                        |
      8192 -> 16383      : 0        |                                        |
     16384 -> 32767      : 1        |****************************************|
^C┌──[root@vms99.liruilongs.github.io]-[~/FlameGraph]
└─$
可以看到,当前的read 调用缓存集中在 16384 -> 32767 字节
然后将这个值与系统调用的返回值进行比对,也就是实际读取的字节数量,进一步分析
┌──[root@vms99.liruilongs.github.io]-[~/FlameGraph]
└─$tplist -v syscalls:sys_exit_read
syscalls:sys_exit_read
    int __syscall_nr;
    long ret;
┌──[root@vms99.liruilongs.github.io]-[~/FlameGraph]
└─$
┌──[root@vms99.liruilongs.github.io]-[~/FlameGraph]
└─$argdist -H 't:syscalls:sys_exit_read():int:args->ret'
。。。。。。。。
[06:22:02]
     args->ret           : count     distribution
         0 -> 1          : 0        |                                        |
         2 -> 3          : 0        |                                        |
         4 -> 7          : 0        |                                        |
         8 -> 15         : 17       |****************************************|
        16 -> 31         : 0        |                                        |
        32 -> 63         : 1        |**                                      |
        64 -> 127        : 0        |                                        |
       128 -> 255        : 1        |**                                      |
       256 -> 511        : 0        |                                        |
       512 -> 1023       : 1        |**                                      |
^C┌──[root@vms99.liruilongs.github.io]-[~/FlameGraph]
└─$
对于系统调用的统计,也可以使用 -P 选项指定跟踪某个进程,这里的1 为 systemd,这样会以进程的维度来统计系统调用。
┌──[root@vms99.liruilongs.github.io]-[~]
└─$syscount -Pi 1
Tracing syscalls, printing top 10... Ctrl+C to quit.
[06:14:09]
PID    COMM               COUNT
12442  cockpit-bridge     11603
51948  top                 2027
955    tuned                 47
55669  syscount              23
2681   httpd                 20
1126   haproxy               19
2680   httpd                 18
12122  sshd                   9
2679   httpd                  9
51745  sshd                   9

.............
可以看到调用最多的为 cockpit-bridge,是一个自带的系统工具,用于远程管理。
llcstat
llcstat 用于利用性能监控计数器(PMC)来按进程输出最后一级缓存的命中率,LLC ,一般指多核共享缓存。
在虚拟机中执行会报错,没有PMC 信息,下面为文档的Demo
# ./llcstat.py 20 -c 5000
Running for 20 seconds or hit Ctrl-C to end.
PID      NAME             CPU     REFERENCE         MISS   HIT%
0        swapper/15       15        3515000       640000  81.79%
238      migration/38     38           5000            0 100.00%
4512     ntpd             11           5000            0 100.00%
150867   ipmitool         3           25000         5000  80.00%
150895   lscpu            17         280000        25000  91.07%
151807   ipmitool         15          15000         5000  66.67%
150757   awk              2           15000         5000  66.67%
151213   chef-client      5         1770000       240000  86.44%
151822   scribe-dispatch  12          15000            0 100.00%
123386   mysqld           5            5000            0 100.00%
[...]
列说明:
-
CPU:执行该进程的 CPU 核心。 -
REFERENCE:访问缓存的总次数(缓存引用)。 -
MISS:缓存未命中的次数。 -
HIT%:缓存命中率,表示成功访问缓存的比例。
五、应用程序用户态CPU用量分析
应用程序用户态CPU用量分析,展示出哪条代码路径消耗了最多的CPU,对于内核态,使用一些常用的生成火焰图的工具可以快速定位,上面我们也有讲到,比如 perf 或者 profile 之类,通过生成的火焰图可以定位到使用内核态函数的CPU使用情况
perf top,类似于 top,它能够实时显示占用 CPU 时钟最多的函数或者指令,因此可以用来查找热点函数,
$ perf top
Samples: 833  of event 'cpu-clock', Event count (approx.): 97742399
Overhead  Shared Object       Symbol
   7.28%  perf                [.] 0x00000000001f78a4
   4.72%  [kernel]            [k] vsnprintf
   4.32%  [kernel]            [k] module_get_kallsym
   3.65%  [kernel]            [k] _raw_spin_unlock_irqrestore
...
对于用户态调用栈的使用情况,不同编程语言需要有专门的工具
下面是一个 Java 代码的Demo 使用了 Arthas 中的 async-profiler
使用的项目,这里主要基于 async-profiler 进行 Java 调用栈数据火焰图调用生成
https://github.com/alibaba/arthas
https://github.com/async-profiler/async-profiler
需要注意的是,需要 JDK 环境,会用到JDK 内置的一些 jar,生产的容器环境大部分 项目基于 JRE 部署。需要调整
bash-4.4# curl -O https://arthas.aliyun.com/arthas-boot.jar
  % Total    % Received % Xferd  Average Speed   Time    Time     Time  Current
                                 Dload  Upload   Total   Spent    Left  Speed
100  141k  100  141k    0     0  1518k      0 --:--:-- --:--:-- --:--:-- 1518k
bash-4.4# java -jar arthas-boot.jar
[INFO] JAVA_HOME: /opt/jdk1.8.0_192/jre
[INFO] arthas-boot version: 4.0.5
[INFO] Found existing java process, please choose one and input the serial number of the process, eg : 1. Then hit ENTER.
* [1]: 1 ruoyi-admin.jar
1
[INFO] Start download arthas from remote server: https://arthas.aliyun.com/download/4.0.5?mirror=aliyun
[INFO] Download arthas success.
[INFO] arthas home: /root/.arthas/lib/4.0.5/arthas
[INFO] Try to attach process 1
Picked up JAVA_TOOL_OPTIONS:
[INFO] Attach process 1 success.
[INFO] arthas-client connect 127.0.0.1 3658
  ,---.  ,------. ,--------.,--.  ,--.  ,---.   ,---.
 /  O  \ |  .--. ''--.  .--'|  '--'  | /  O  \ '   .-'
|  .-.  ||  '--'.'   |  |   |  .--.  ||  .-.  |`.  `-.
|  | |  ||  |\  \    |  |   |  |  |  ||  | |  |.-'    |
`--' `--'`--' '--'   `--'   `--'  `--'`--' `--'`-----'

wiki        https://arthas.aliyun.com/doc
tutorials   https://arthas.aliyun.com/doc/arthas-tutorials.html
version     4.0.5
main_class  ruoyi-admin.jar
pid         1
start_time  2025-01-07 14:03:52.054
currnt_time 2025-04-05 01:16:29.489
.................                                                                                            Sat Apr 05 01:17:01 CST 2025/7557189s
[arthas@1]$
[arthas@1]$ profiler start
Profiling started
[arthas@1]$ profiler stop --format flamegraph
OK
profiler output file: /arthas-output/20250405-012029.html
[arthas@1]$
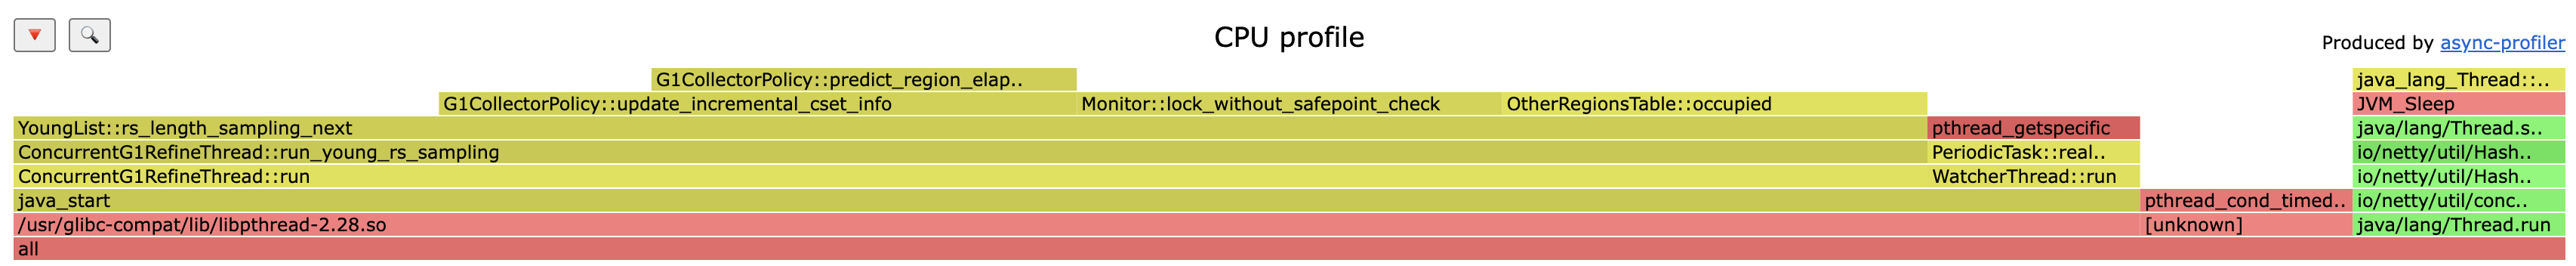 在这里插入图片描述
通过生成的火焰图我们可以直接定位CPU 热点代码
博文部分内容参考
© 文中涉及参考链接内容版权归原作者所有,如有侵权请告知 :)
《性能之巅 系统、企业与云可观测性(第2版)》
© 2018-至今 liruilonger@gmail.com, All rights reserved. 保持署名-非商用-相同方式共享(CC BY-NC-SA 4.0)

- 点赞
- 收藏
- 关注作者
评论(0)