Pyecharts桑基图教程:绘制炫酷桑基图的实战技巧与参数详解
Pyecharts桑基图教程:绘制炫酷桑基图的实战技巧与参数详解
桑基图简介
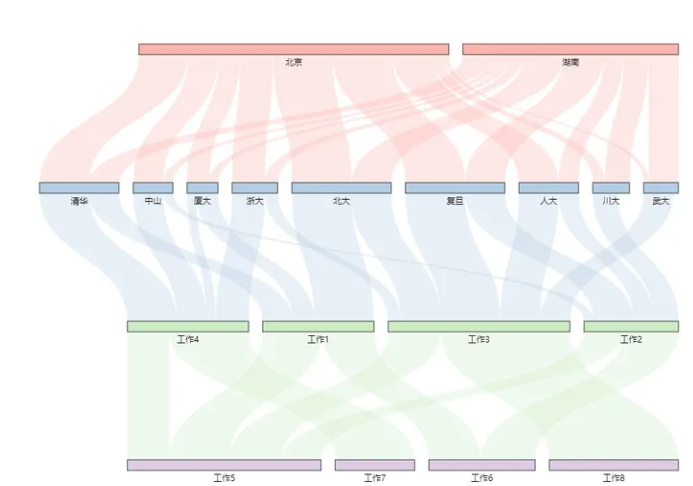
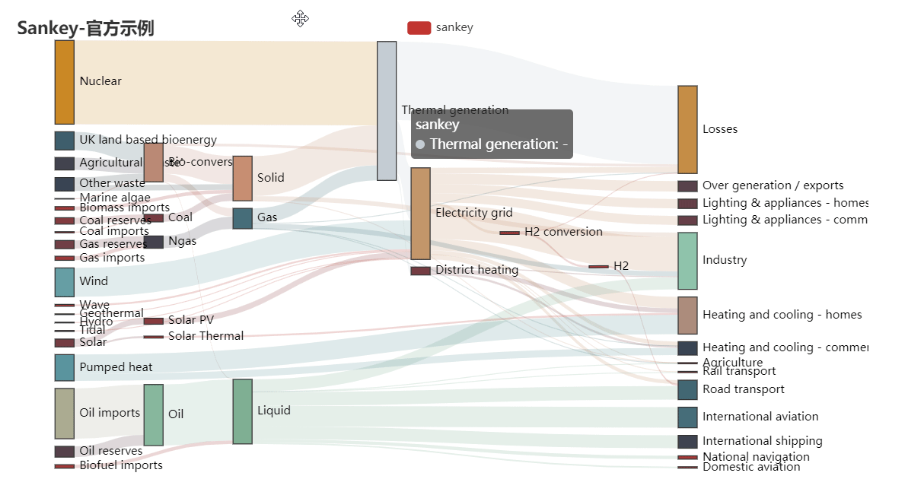
桑基图(Sankey Diagram)是一种流程图,用于显示一组元素之间的关系和流动。它主要用于展示资源、能量、信息等在各个环节之间的流向,以及流向的数量关系。在数据可视化领域,桑基图常常被用来展示复杂系统中各个组成部分之间的相互影响和交互。
Pyecharts 是一个基于 Echarts 的 Python 数据可视化库,提供了丰富的图表类型,包括了桑基图。在本篇技术博客中,我们将深入介绍 Pyecharts 中绘制桑基图的多种炫酷效果,并提供相应的代码实例。

安装 Pyecharts
首先,确保你已经安装了 Pyecharts。可以通过以下命令进行安装:
pip install pyecharts
简单桑基图的绘制
在 Pyecharts 中,绘制简单的桑基图非常容易。以下是一个基本的桑基图绘制代码示例:
from pyecharts.charts import Sankey
from pyecharts import options as opts

nodes = [
    {"name": "A"},
    {"name": "B"},
    {"name": "C"},
]

links = [
    {"source": "A", "target": "B", "value": 10},
    {"source": "B", "target": "C", "value": 15},
]

sankey = (
    Sankey()
    .add(
        "Sankey",
        nodes,
        links,
        linestyle_opt=opts.LineStyleOpts(opacity=0.2, curve=0.5, color="source"),
        label_opts=opts.LabelOpts(position="right"),
    )
    .set_global_opts(title_opts=opts.TitleOpts(title="Basic Sankey"))
)

sankey.render("basic_sankey.html")
在这个例子中,我们定义了三个节点(A、B、C)和两个链接(A到B,B到C),每个链接都有一个数值表示流向的强度。通过调整 linestyle_opt 和 label_opts 的参数,你可以改变桑基图的线条样式和标签显示位置。
自定义桑基图的炫酷效果
高级样式定制
Pyecharts 提供了许多参数,可以用于定制桑基图的外观。以下是一些常用的高级样式定制参数:
linestyle_opt:线条样式的配置,包括透明度、曲率、颜色等。label_opts:标签样式的配置,包括位置、颜色、字体大小等。tooltip_opts:鼠标悬停提示框的配置,可以显示额外的信息。
下面是一个高级样式定制的示例代码:
from pyecharts.charts import Sankey
from pyecharts import options as opts

nodes = [
    {"name": "Source"},
    {"name": "Step1"},
    {"name": "Step2"},
    {"name": "Step3"},
    {"name": "Target"},
]

links = [
    {"source": "Source", "target": "Step1", "value": 100},
    {"source": "Step1", "target": "Step2", "value": 60},
    {"source": "Step2", "target": "Step3", "value": 30},
    {"source": "Step3", "target": "Target", "value": 15},
]

sankey = (
    Sankey()
    .add(
        "Sankey",
        nodes,
        links,
        linestyle_opt=opts.LineStyleOpts(
            opacity=0.5, curve=0.5, color="target", type_="dashed"
        ),
        label_opts=opts.LabelOpts(position="top", font_size=12),
        tooltip_opts=opts.TooltipOpts(trigger="item", formatter="{b}: {c}"),
    )
    .set_global_opts(title_opts=opts.TitleOpts(title="Customized Sankey"))
)

sankey.render("custom_sankey.html")
在这个例子中,我们通过设置不同的样式参数,使得桑基图线条具有透明度、曲线、虚线等效果,同时调整标签的位置和字体大小,以及鼠标悬停提示框的格式。
多组数据桑基图的展示
在实际应用中,可能需要同时展示多组数据的桑基图,以比较它们之间的差异或趋势。Pyecharts 提供了支持多系列的桑基图,以下是一个示例代码:
from pyecharts.charts import Sankey
from pyecharts import options as opts

nodes = [
    {"name": "A"},
    {"name": "B"},
    {"name": "C"},
    {"name": "D"},
]

links_series = [
    {"source": "A", "target": "B", "value": 10},
    {"source": "B", "target": "C", "value": 15},
    {"source": "C", "target": "D", "value": 20},
]

sankey = (
    Sankey()
    .add("Series 1", nodes, links_series, is_selected=True)
    .add("Series 2", nodes, links_series, is_selected=False)
    .set_global_opts(title_opts=opts.TitleOpts(title="Multiple Series Sankey"))
)

sankey.render("multiple_series_sankey.html")
在这个例子中,我们使用了 add 方法来添加多个系列,每个系列可以有不同的数据,通过 is_selected 参数来设置默认选中的系列。这样,我们可以在同一图表中展示多组数据的桑基图,方便对比分析。

动态桑基图的绘制
除了静态的桑基图,Pyecharts 还支持绘制动态桑基图,通过时间轴展示数据变化的过程。以下是一个动态桑基图的示例代码:
from pyecharts.charts import Sankey, Timeline
from pyecharts import options as opts

nodes = [
    {"name": "A"},
    {"name": "B"},
    {"name": "C"},
]

links_timeline = {
    "time_points": ["2022-01-01", "2022-02-01", "2022-03-01"],
    "data": [
        [{"source": "A", "target": "B", "value": 10}],
        [{"source": "B", "target": "C", "value": 15}],
        [{"source": "A", "target": "C", "value": 5}],
    ],
}

timeline = Timeline()
for idx, time_point in enumerate(links_timeline["time_points"]):
    sankey = (
        Sankey()
        .add(
            "Sankey",
            nodes,
            links_timeline["data"][idx],
            linestyle_opt=opts.LineStyleOpts(color="source", opacity=0.7),
            label_opts=opts.LabelOpts(position="right"),
        )
        .set_global_opts(
            title_opts=opts.TitleOpts(title=f"Sankey - {time_point}"),
            visualmap_opts=opts.VisualMapOpts(
                orient="horizontal", pos_top="10%", pos_left="10%"
            ),
        )
    )
    timeline.add(sankey, time_point)

timeline.render("dynamic_sankey.html")
在这个例子中,我们使用 Timeline 来创建时间轴,并在不同时间点展示不同的桑基图。通过逐步变化的数据,我们可以形象地展示数据在时间上的变化过程。
结合真实数据的桑基图案例
为了更好地说明 Pyecharts 绘制桑基图的实际应用,让我们结合一个真实的案例,使用真实的数据进行桑基图的绘制。在这个案例中,我们将使用一个销售流程的数据来展示不同阶段之间的关系和流向。
from pyecharts.charts import Sankey
from pyecharts import options as opts

# 真实销售流程数据
nodes = [
    {"name": "Lead"},
    {"name": "Contacted"},
    {"name": "Prospect"},
    {"name": "Negotiation"},
    {"name": "Closed"},
]

links = [
    {"source": "Lead", "target": "Contacted", "value": 120},
    {"source": "Contacted", "target": "Prospect", "value": 80},
    {"source": "Prospect", "target": "Negotiation", "value": 40},
    {"source": "Negotiation", "target": "Closed", "value": 20},
]

# 绘制桑基图
sankey = (
    Sankey()
    .add(
        "Sales Flow",
        nodes,
        links,
        linestyle_opt=opts.LineStyleOpts(color="source", opacity=0.7),
        label_opts=opts.LabelOpts(position="right"),
    )
    .set_global_opts(title_opts=opts.TitleOpts(title="Sales Process Sankey"))
)

sankey.render("sales_process_sankey.html")
在这个例子中,我们使用了销售流程的数据,其中包括了从潜在客户(Lead)到最终成交(Closed)的不同阶段。通过绘制桑基图,我们可以清晰地看到各个阶段之间的流向,帮助销售团队更好地理解销售流程。

导出和分享
Pyecharts 提供了多种导出图表的方式,可以将生成的桑基图保存为图片或 HTML 文件。这样可以方便地分享给团队成员或将图表嵌入到报告中。
# 将桑基图保存为图片
sankey.render("sales_process_sankey.png")

# 或者保存为 HTML 文件
sankey.render("sales_process_sankey.html")
通过以上的例子,你可以灵活地运用 Pyecharts 绘制桑基图,并根据实际需求进行定制和优化。希望这些案例能够帮助你更好地使用 Pyecharts 进行桑基图的数据可视化工作。
进阶应用:桑基图与其他图表的组合
在数据可视化的实际应用中,有时候我们需要将桑基图与其他类型的图表结合起来,以更全面地呈现数据的多个方面。以下是一个例子,演示了如何将桑基图与柱状图结合起来,展示销售流程中每个阶段的数量。
from pyecharts.charts import Sankey, Bar
from pyecharts import options as opts
from pyecharts.commons.utils import JsCode

# 真实销售流程和数量数据
nodes = [
    {"name": "Lead"},
    {"name": "Contacted"},
    {"name": "Prospect"},
    {"name": "Negotiation"},
    {"name": "Closed"},
]

links = [
    {"source": "Lead", "target": "Contacted", "value": 120},
    {"source": "Contacted", "target": "Prospect", "value": 80},
    {"source": "Prospect", "target": "Negotiation", "value": 40},
    {"source": "Negotiation", "target": "Closed", "value": 20},
]

# 销售阶段数量数据
sales_data = [120, 80, 40, 20]

# 绘制桑基图
sankey = (
    Sankey()
    .add(
        "Sales Flow",
        nodes,
        links,
        linestyle_opt=opts.LineStyleOpts(color="source", opacity=0.7),
        label_opts=opts.LabelOpts(position="right"),
    )
    .set_global_opts(title_opts=opts.TitleOpts(title="Sales Process Sankey"))
)

# 绘制柱状图
bar = (
    Bar()
    .add_xaxis(["Lead", "Contacted", "Prospect", "Negotiation", "Closed"])
    .add_yaxis("Sales Quantity", sales_data, label_opts=opts.LabelOpts(position="top"))
    .set_global_opts(title_opts=opts.TitleOpts(title="Sales Quantity Bar Chart"))
)

# 将桑基图和柱状图组合在一起
page = (
    sankey.overlap(bar)
    .render("combined_sankey_bar_chart.html")
)
在这个例子中,我们使用 overlap 方法将桑基图与柱状图叠加在一起,以便同时展示销售流程的关系和每个阶段的数量。这样的组合图表可以提供更全面的信息,帮助观众更好地理解数据。
总结
本篇技术博客介绍了Pyecharts绘制桑基图的多种炫酷效果,并提供了实际案例和代码示例。通过学习这些技巧,你可以更好地应用Pyecharts进行桑基图的定制和展示。在实际应用中,根据数据的特点和需求,可以选择适合的样式和组合方式,以有效传达数据的信息。希望这篇博客对你在数据可视化中的工作有所帮助。
- 点赞
- 收藏
- 关注作者


评论(0)