人脸识别 确定阈值
目录
face TAR FAR计算:
人脸识别中的阈值应该如何设置?
人脸识别中的阈值应该如何设置?
随着人脸识别技术使用范围越来越广,大部分使用者可能对人脸识别中的某一方面不是很懂,咨询的问题也五花八门,下面,主要讲解视壮人脸识别中的阈值应该如何设置?
首先我们来看看提供的一组数据(绝对数值有修改,可以定性来看)。
| 误识率 |
通过率 |
阈值 |
| 0.01 |
0.999 |
64 |
| 0.001 |
0.998 |
68 |
| 0.0001 |
0.996 |
72 |
| 1e-5 |
0.993 |
76 |
| 1e-6 |
0.985 |
80 |
| 1e-7 |
0.950 |
84 |
| 1e-8 |
0.300 |
88 |
通过这组数据,可以得出以下结论:
一是误识率、通过率和阈值具有相关性,但属于非线性关系
可能大部分人看到这组数据,就会认为阈值越高,通过率和误识率越低,阈值越低,通过率和误识率越高。
这就引出了一个常见的误区,客户认为通过率越高,体验越好,那么阈值就应该设置越低。但是通过率越高,误识率也就越高,意味着防风险能力就会下降,所以阈值的设置要综合考虑客户体验和防风险能力两个因素。较准确的说法应该是在指定阈值下,公司A的通过率比其他公司高,误识率也比其他公司低,,这就说明公司A的人脸识别算法比其他公司要好。
另外阈值不能设置过高,从数据可以看出,阈值不断提高后,通过率和误识率也跟着急速下降。当前人脸识别只能作为辅助认证手段,不能等同于二代Key这样的强认证工具,人脸数据量如果足够大,一定会出现误识,没有办法做到风险为0。
提供的这组数据是基于他们自己人脸识别测试底库,阈值、误识率和通过率并不是绝对的。不过从定性的角度来看,还是值得参考的。如果测试底库有大量多胞胎,或者人脸库数据规模超级大,那么所得结果一定会有所差异。
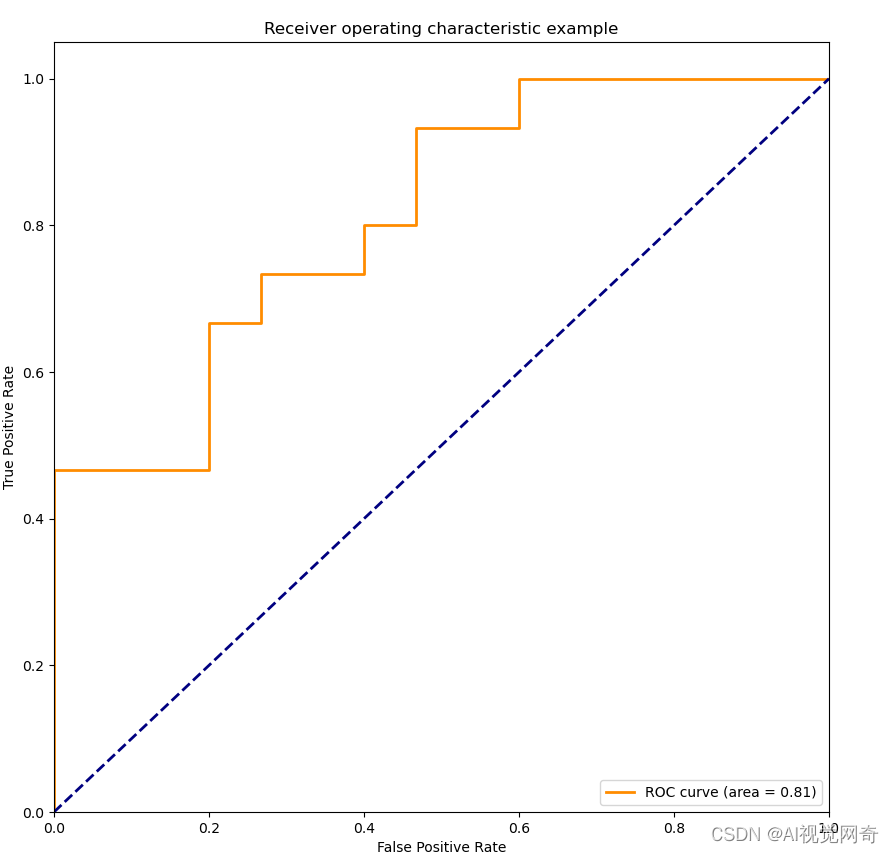
python画roc曲线:
-
# -*- coding: utf-8 -*-
-
"""
-
Created on Thu Sep 21 16:13:04 2017
-
@author: lizhen
-
"""
-
import numpy as np
-
import matplotlib.pyplot as plt
-
from sklearn import svm, datasets
-
from sklearn.metrics import roc_curve, auc ###计算roc和auc
-
from sklearn import model_selection as cross_validation
-
# Import some data to play with
-
iris = datasets.load_iris()
-
X = iris.data
-
y = iris.target
-
-
##变为2分类
-
X, y = X[y != 2], y[y != 2]
-
-
# Add noisy features to make the problem harder
-
random_state = np.random.RandomState(0)
-
n_samples, n_features = X.shape
-
X = np.c_[X, random_state.randn(n_samples, 200 * n_features)]
-
-
# shuffle and split training and test sets
-
X_train, X_test, y_train, y_test = cross_validation.train_test_split(X, y, test_size=.3, random_state=0)
-
-
# Learn to predict each class against the other
-
svm = svm.SVC(kernel='linear', probability=True, random_state=random_state)
-
-
###通过decision_function()计算得到的y_score的值,用在roc_curve()函数中
-
y_score = svm.fit(X_train, y_train).decision_function(X_test)
-
-
# Compute ROC curve and ROC area for each class
-
fpr, tpr, threshold = roc_curve(y_test, y_score) ###计算真正率和假正率
-
roc_auc = auc(fpr, tpr) ###计算auc的值
-
-
plt.figure()
-
lw = 2
-
plt.figure(figsize=(10, 10))
-
plt.plot(fpr, tpr, color='darkorange', lw=lw, label='ROC curve (area = %0.2f)' % roc_auc) ###假正率为横坐标,真正率为纵坐标做曲线
-
plt.plot([0, 1], [0, 1], color='navy', lw=lw, linestyle='--')
-
plt.xlim([0.0, 1.0])
-
plt.ylim([0.0, 1.05])
-
plt.xlabel('False Positive Rate')
-
plt.ylabel('True Positive Rate')
-
plt.title('Receiver operating characteristic example')
-
plt.legend(loc="lower right")
-
plt.show()
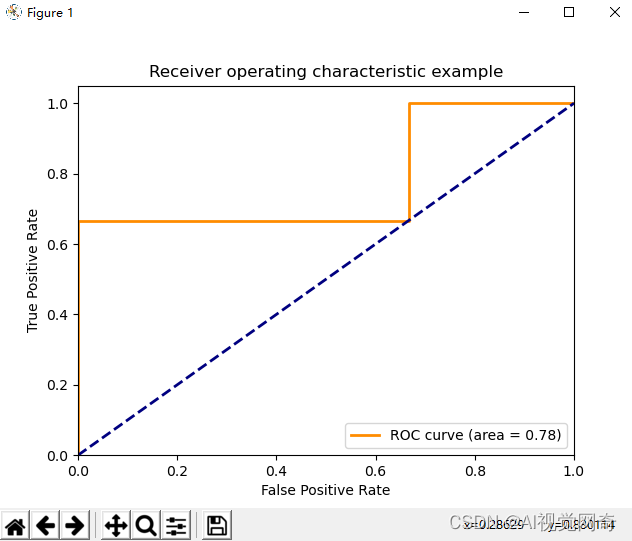
roc曲线:

转自:用Python绘制ROC曲线_-永不妥协-的博客-CSDN博客_python做roc曲线
-
from sklearn.metrics import roc_curve, auc # 数据准备
-
import numpy as np
-
from sklearn import metrics
-
import matplotlib.pyplot as plt
-
-
y = np.array([1, 1,1, 2, 2,2])
-
scores = np.array([0.1, 0.4,0.5, 0.35, 0.8,0.9])
-
-
# roc_curve的输入为
-
# y: 样本标签
-
# scores: 模型对样本属于正例的概率输出
-
# pos_label: 标记为正例的标签,本例中标记为2的即为正例
-
fpr, tpr, thresholds = metrics.roc_curve(y, scores, pos_label=2) # 假阳性率
-
print(fpr)
-
# array([0., 0.5, 0.5, 1.]) # 真阳性率
-
print(tpr)
-
# array([0.5, 0.5, 1., 1.]) # 阈值
-
print(thresholds)
-
# array([0.8, 0.4, 0.35, 0.1])
-
auc = metrics.auc(fpr, tpr)
-
print(auc)
-
-
plt.figure()
-
lw = 2
-
plt.plot(fpr, tpr, color='darkorange', lw=lw, label='ROC curve (area = %0.2f)' % auc)
-
plt.plot([0, 1], [0, 1], color='navy', lw=lw, linestyle='--')
-
plt.xlim([0.0, 1.0])
-
plt.ylim([0.0, 1.05])
-
plt.xlabel('False Positive Rate')
-
plt.ylabel('True Positive Rate')
-
plt.title('Receiver operating characteristic example')
-
plt.legend(loc="lower right")
-
plt.show()

文章来源: blog.csdn.net,作者:AI视觉网奇,版权归原作者所有,如需转载,请联系作者。
原文链接:blog.csdn.net/jacke121/article/details/125418525
- 点赞
- 收藏
- 关注作者


评论(0)