Seaborn数据可视化
目录
前言
本文其实属于:Python的进阶之道【AIoT阶段一】的一部分内容,本篇把这部分内容单独截取出来,方便大家的观看,本文介绍Seaborn数据可视化,读本文之前,如果没有 Matplotlib基础建议先看博客:Matplotlib数据可视化入门,Matplotlib数据可视化高级,Matplotlib数据可视化进阶(进阶中有Seaborn讲解,这里单独截出来)。
🌟 学习本文之前,需要先自修:NumPy从入门到进阶,pandas从入门到进阶本文中很多的操作在 NumPy从入门到进阶 ,pandas从入门到进阶二文中有详细的介绍,包含一些软件以及扩展库,图片的安装和下载流程,本文会直接进行使用。
下载 M a t p l o t l i b Matplotlib Matplotlib 见博客:matplotlib的安装教程以及简单调用,这里不再赘述
Seaborn是基于matplotlib的图形可视化python包。它提供了一种高度交互式界面,便于用户能够做出各种有吸引力的统计图表。
Seaborn是在matplotlib的基础上进行了更高级的API封装,从而使得作图更加容易,在大多数情况下使用seaborn能做出很具有吸引力的图,而使用matplotlib就能制作具有更多特色的图。应该把Seaborn视 为matplotlib的补充,而不是替代物。
1.安装
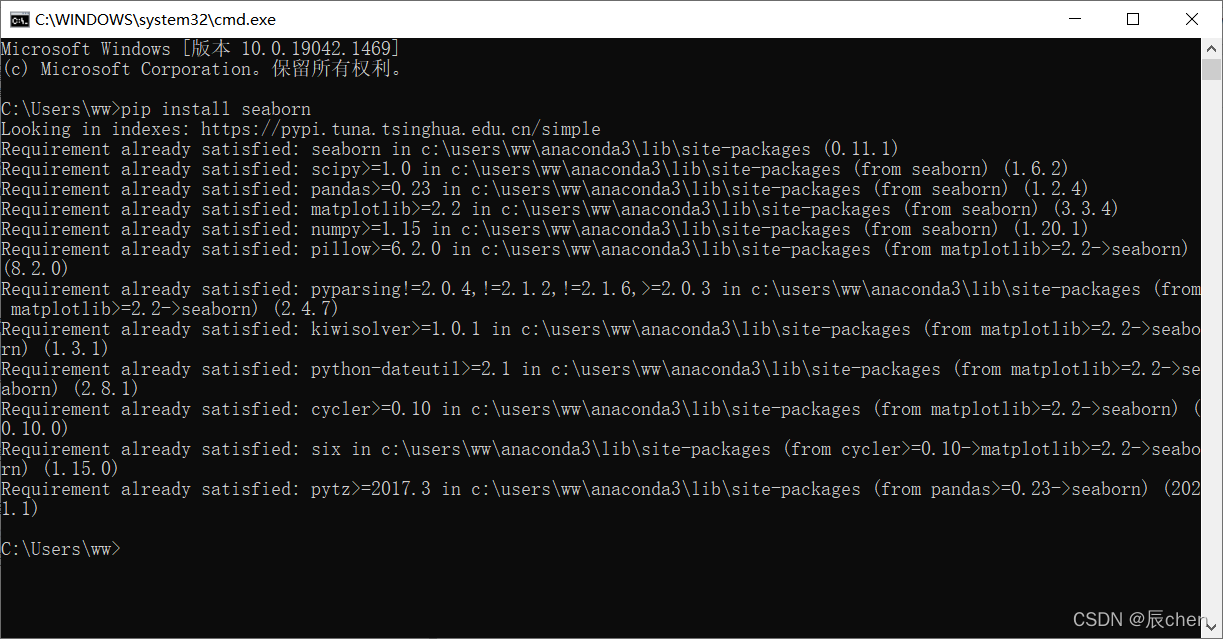
如果你读过文章:matplotlib的安装教程以及简单调用,那么你只需要在命令行模式中输入:pip install seaborn即可进行安装,否则你也可以直接输入:pip install seaborn -i https://pypi.tuna.tsinghua.edu.cn/simple
进入命令行模式: W i n d o w s Windows Windows系统:按下键盘上的 W i n d o w s + R Windows + R Windows+R,输入 c m d cmd cmd 后即可进入
如果你读过文章:最详细的Anaconda Installers 的安装【numpy,jupyter】(图+文),那么你无序再安装 S e a b o r n Seaborn Seaborn,安装 A n a c o n d a Anaconda Anaconda 的时候已经安装好了 S e a b o r n Seaborn Seaborn

出现上图所示就是已经安装过的意思,我们可以打开 jupyter 运行如下代码,看是否报错:
import numpy as np
import matplotlib.pyplot as plt
import seaborn as sns
不报错即为安装成功,那么接下来,就让我来介绍 s e a b o r n seaborn seaborn
2.快速上手
2.1 模式设置
import seaborn as sns
sns.set(style = 'darkgrid',context = 'talk',font = 'STKaiti')
s t y l e style style设置,修改主题风格,属性如下:
| style | 效果 |
|---|---|
| darkgrid | 黑色网格(默认) |
| whitegrid | 白色网格 |
| dark | 黑色背景 |
| white | 白色背景 |
| ticks | 四周有刻度线的白背景 |
c o n t e x t context context设置,修改大小,属性如下:
| context | 效果 |
|---|---|
| paper | 越来越大越来越粗 |
| notebook(默认) | 越来越大越来越粗 |
| talk | 越来越大越来越粗 |
| poster | 越来越大越来越粗 |
2.2 线形图
import seaborn as sns
import matplotlib.pyplot as plt
import pandas as pd
import numpy as np

sns.set(style = 'dark',context = 'poster',font = 'STKaiti') # 设置样式
plt.figure(figsize = (9, 6))

x = np.linspace(0, 2 * np.pi, 20)
y = np.sin(x)

sns.lineplot(x = x, y = y, color = 'green', ls = '--')
sns.lineplot(x = x, y = np.cos(x), color = 'red',ls = '-.')

3.各种图形绘制
首先我们需要下载几个 c s v csv csv 文件:
链接: https://pan.baidu.com/s/12CkTweXPT-El4z2M93HltQ?pwd=vaks
提取码: vaks
下载完成之后,把该文件和我们的代码放到同一个文件夹下,这一操作我们在之前的博客中已经反复说到,这里就不再进行演示
3.1 调色板
参数 p a l e t t e palette palette(调色板),用于调整颜色,系统默认提供了六种选择: d e e p , m u t e d , b r i g h t , p a s t e l , d a r k , c o l o r b l i n d deep, muted, bright, pastel, dark, colorblind deep,muted,bright,pastel,dark,colorblind
参数 p a l e t t e palette palette调色板,可以有更多的颜色选择, M a t p l o t l i b Matplotlib Matplotlib为我们提供了多达 178 178 178种,这足够绘图用,可以通过代码print(plt.colormaps())查看选择
import numpy as np
import matplotlib.pyplot as plt
import seaborn as sns

print(plt.colormaps())

3.2 线形图
import seaborn as sns
import matplotlib.pyplot as plt
import pandas as pd

# 设置样式
sns.set(style = 'dark', context = 'notebook', font = 'STKaiti')
plt.figure(figsize = (9, 6))

# fmri 这一核磁共振数据
fmri = pd.read_csv('./fmri.csv')
ax = sns.lineplot(x = 'timepoint',y = 'signal',
                  hue = 'event',     # 根据 event 进行分类绘制
                  style = 'event',   # 根据 event 属性分类指定样式
                  # 如图自动分配成了实现和虚线,●和×
                  data = fmri,
                  palette = 'deep',  # 画板、颜色
                  markers = True,
                  markersize = 10)

plt.xlabel('时间节点',fontsize = 30)

3.3 散点图
import pandas as pd
import matplotlib.pyplot as plt
import seaborn as sns

data = pd.read_csv('./tips.csv') # 小费
plt.figure(figsize = (9, 6))
sns.set(style = 'darkgrid', context = 'talk')

# 散点图
fig = sns.scatterplot(x = 'total_bill', y = 'tip',
hue = 'time', data = data,
palette = 'autumn', s = 100)

3.4 柱状图
import pandas as pd
import seaborn as sns
import matplotlib.pyplot as plt

plt.figure(figsize = (9, 6))
sns.set(style = 'whitegrid')
tips = pd.read_csv('./tips.csv') # 小费
ax = sns.barplot(x = "day", y = "total_bill",
                 data = tips,hue = 'sex',
                 palette = 'colorblind',
                 capsize = 0.2)

3.5 箱式图
import seaborn as sns
import matplotlib.pyplot as plt
import pandas as pd

sns.set(style = 'ticks')
tips = pd.read_csv('./tips.csv')
ax = sns.boxplot(x = "day", y = "total_bill", data = tips, palette = 'colorblind')

3.6 直方图
import seaborn as sns
import numpy as np
import matplotlib.pyplot as plt

sns.set(style = 'dark')
x = np.random.randn(5000)
sns.histplot(x, kde = True)

import seaborn as sns
import numpy as np
import matplotlib.pyplot as plt
import pandas as pd

sns.set(style = 'darkgrid')
tips = pd.read_csv('./tips.csv')
sns.histplot(x = 'total_bill', data = tips, kde = True)

3.7 分类散点图
import seaborn as sns
import matplotlib.pyplot as plt
import pandas as pd

sns.set(style = 'darkgrid')
exercise = pd.read_csv('./exercise.csv')
sns.catplot(x = "time", y = "pulse", hue = "kind", data = exercise)

3.8 热力图
import matplotlib.pyplot as plt
import seaborn as sns
import pandas as pd

plt.figure(figsize = (12, 9))
flights = pd.read_csv('./flights.csv')   # 飞行数据

# pivot() 实现了数据重塑,改变了DataFrame的形状
# month 作为行索引,year作为列索引,passengers作为数据
flights = flights.pivot("month", "year", "passengers") # 年,月,乘客
sns.heatmap(flights, annot = True,   # 画上数值
            fmt = 'd',         # 数值为整数
            cmap = 'RdBu_r',   # 设置颜色
            linewidths = 0.5)  # 线宽为 0.5

我们最后来说一下数据重塑,在本题的基础上,我们查看一下我们的 f l i g h t s flights flights 数据:

咋们再来重新加载一下数据,看看原始的 f l i g h t s flights flights 数据:
import matplotlib.pyplot as plt
import seaborn as sns
import pandas as pd

flights = pd.read_csv('./flights.csv')
flights

不难看出,上述绘图过程中涉及到了数据重塑:代码:flights = flights.pivot("month", "year", "passengers")实现了数据的重塑,使得 m o n t h month month 作为行索引, y e r r yerr yerr 作为列索引, p a s s e n g e r s passengers passengers 作为数据。
文章来源: chen-ac.blog.csdn.net,作者:辰chen,版权归原作者所有,如需转载,请联系作者。
原文链接:chen-ac.blog.csdn.net/article/details/122682749
- 点赞
- 收藏
- 关注作者


评论(0)