【 MATLAB 】stairs 函数介绍

stairs
Stairstep graph
Syntax
stairs(Y)
stairs(X,Y)
stairs(___,LineSpec)
stairs(___,Name,Value)
stairs(ax,___)
h = stairs(___)
[xb,yb] = stairs(___)
Description
stairs( draws a stairstep graph of the elements in Y)Y.
-
If
Yis a vector, thenstairsdraws one line. -
If
Yis a matrix, thenstairsdraws one line per matrix column.
stairs( plots the elements in X,Y)Y at the locations specified by X. The inputs X and Y must be vectors or matrices of the same size. Additionally, X can be a row or column vector and Y must be a matrix with length(X) rows.
stairs(___, specifies a line style, marker symbol, and color. For example, LineSpec)':*r' specifies a dotted red line with asterisk markers. Use this option with any of the input argument combinations in the previous syntaxes.
stairs(___, modifies the stairstep chart using one or more name-value pair arguments. For example,Name,Value)'Marker','o','MarkerSize',8 specifies 8 point circle markers.
stairs( plots into the axes specified by ax,___)ax instead of into the current axes (gca). The option, ax, can precede any of the input argument combinations in the previous syntaxes.
stairs(绘制成由ax指定的轴而不是当前轴(gca)。 选项ax可以在先前语法中的任何输入参数组合之前。ax,___)
h = stairs(___)Stair objects. Use h to make changes to properties of a specific Stair object after it is created.
h = stairs(___)
[ does not create a plot, but returns matrices xb,yb] = stairs(___)xb and yb of the same size, such that plot(xb,yb) plots the stairstep graph.
[不会创建绘图,但返回相同大小的矩阵xb和yb,以便绘图(xb,yb)绘制阶梯图。xb,yb] = stairs(___)
Plot Single Data Series
Create a stairstep plot of sine evaluated at 40 equally spaced values between 0 and.
X = linspace(0,4*pi,40);
Y = sin(X);figure
stairs(Y)
The length of Y automatically determines and generates the x-axis scale.

Plot Multiple Data Series
Create a stairstep plot of two cosine functions evaluated at 50 equally spaced values between 0 and
X = linspace(0,4*pi,50)';
Y = [0.5*cos(X), 2*cos(X)];figure
stairs(Y)
The number of rows in Y automatically determines and generates the x-axis scale.

Plot Single Data Series at Specified x-Values
Create a stairstep plot of a sine wave evaluated at equally spaced values between 0 and
X = linspace(0,4*pi,40);
Y = sin(X);figure
stairs(X,Y)
The entries in Y are plotted against the corresponding entries in X.

Plot Multiple Data Series at Specified x-Values
Create a stairstep plot of two cosine waves evaluated at equally spaced values between 0 and
X = linspace(0,4*pi,50)';
Y = [0.5*cos(X), 2*cos(X)];figure
stairs(X,Y)
The first vector input, X, determines the x-axis positions for both data series.

Plot Multiple Data Series at Unique Sets of x-Values
Create a stairstep plot of two sine waves evaluated at different values. Specify a unique set of x-values for plotting each data series.
x1 = linspace(0,2*pi)';
x2 = linspace(0,pi)';
X = [x1,x2];
Y = [sin(5*x1),exp(x2).*sin(5*x2)];figure
stairs(X,Y)
Each column of X is plotted against the corresponding column of Y.

Specify Line Style, Marker Symbol and Color
Create a stairstep plot and set the line style to a dot-dashed line, the marker symbol to circles, and the color to red.
X = linspace(0,4*pi,20);
Y = sin(X);
figure
stairs(Y, '-.or')

Specify Additional Style Options
Create a stairstep plot and set the line width to 2, the marker symbols to diamonds, and the marker face color to cyan using Name,Value pair arguments.
X = linspace(0,4*pi,20);
Y = sin(X);
figure
stairs(Y,'LineWidth',2,'Marker','d','MarkerFaceColor','c')

Specify Axes for Stairstep Plots
Create a figure with two subplots and return the two axes handles, s(1) and s(2). Create a stairstep plot in each subplot by referring to the axes handles.
figure
s(1) = subplot(2,1,1);
s(2) = subplot(2,1,2);
X = linspace(0,2*pi);
Y1 = 5*sin(X);
Y2 = sin(5*X);
stairs(s(1),X,Y1)
stairs(s(2),X,Y2)

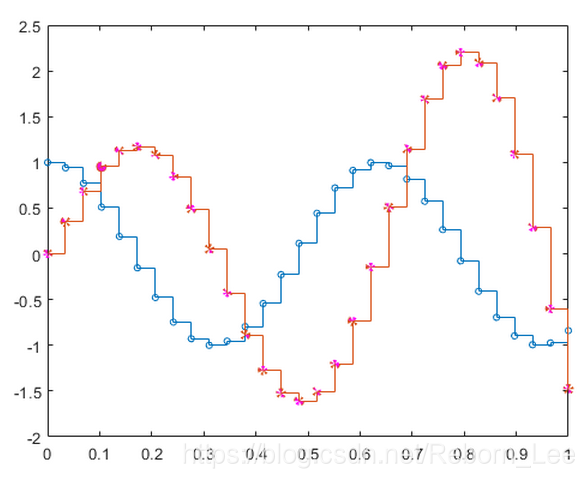
Modify Stairstep Plot After Creation
Create a stairstep plot of two data series and return the two stair objects.
X = linspace(0,1,30)';
Y = [cos(10*X), exp(X).*sin(10*X)];
h = stairs(X,Y);

Use small circle markers for the first data series. Use magenta filled circles for the second series. Starting in R2014b, you can use dot notation to set properties. If you are using an earlier release, use the docid:matlab_ref.f67-432995 function instead.
h(1).Marker = 'o';
h(1).MarkerSize = 4;
h(2).Marker = 'o';
h(2).MarkerFaceColor = 'm';
Create a Stairstep Plot using plot Function
Evaluate two cosine functions at 50 equally spaced values between 0 and and create a stairstep plot using plot.
X = linspace(0,4*pi,50)';
Y = [0.5*cos(X), 2*cos(X)];
[xb,yb] = stairs(X,Y);
stairs returns two matrices of the same size, xb and yb, but no plot.
Use plot to create the stairstep plot with xb and yb.
figure
plot(xb,yb)
文章来源: reborn.blog.csdn.net,作者:李锐博恩,版权归原作者所有,如需转载,请联系作者。
原文链接:reborn.blog.csdn.net/article/details/83421347

- 点赞
- 收藏
- 关注作者
评论(0)