【 MATLAB 】gca 介绍(当前轴或图表)

gca
Current axes or chart
Syntax
ax = gca
Description
ax = gca
ax = gca
Graphics functions, such as title, target the current axes or chart. Use ax to access and modify properties of the axes or chart. If axes or charts do not exist, then gca creates Cartesian axes.
图形功能(例如标题)以当前轴或图表为目标。 使用ax访问和修改轴或图表的属性。 如果轴或图表不存在,则gca创建笛卡尔坐标轴。
Specify Properties for Current Axes
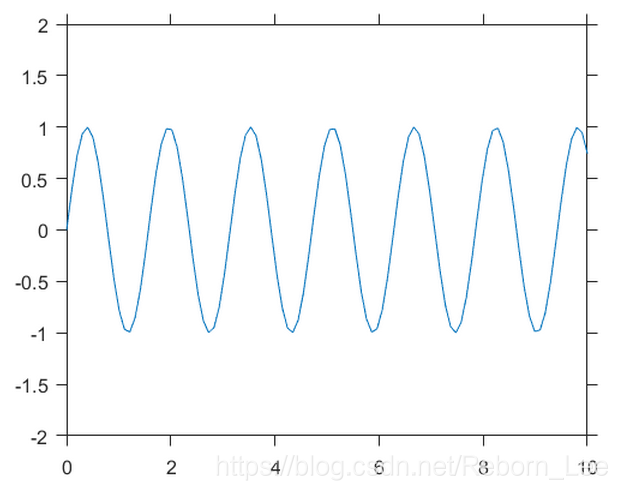
Plot a sine wave.
x = linspace(0,10);
y = sin(4*x);
plot(x,y)

Set the font size, tick direction, tick length, and y-axis limits for the current axes. Use gca to refer to the current axes.
Note: Starting in R2014b, you can use dot notation to set properties. If you are using an earlier release, use the docid:matlab_ref.f67-432995 function instead, such as set(ax,'FontSize',12).
ax = gca; % current axes
ax.FontSize = 12;
ax.TickDir = 'out';
ax.TickLength = [0.02 0.02];
ax.YLim = [-2 2];
Tips
-
User interaction can change the current axes or chart. It is better to assign the axes or chart to a variable when you create it instead of relying on
gca. -
用户交互可以更改当前轴或图表。 最好在创建变量时将轴或图表分配给变量,而不是依赖于gca。
-
Changing the current figure also changes the current axes or chart.
-
更改当前图形也会更改当前轴或图表。
-
Set axes properties after plotting since some plotting functions reset axes properties.
-
绘图后设置轴属性,因为某些绘图功能会重置轴属性。
-
To access the current axes or chart without forcing the creation of Cartesian axes, query the figure
CurrentAxesproperty. MATLAB® returns an empty array if there is no current axes. -
要在不强制创建笛卡尔坐标轴的情况下访问当前轴或图表,请查询图形CurrentAxes属性。 如果没有当前轴,MATLAB®将返回一个空数组。
fig = gcf; ax = fig.CurrentAxes;Starting in R2014b, you can query properties using dot notation. If you are using an earlier release, use thegetfunction instead, such asax = get(fig,'CurrentAxes'). - 从R2014b开始,您可以使用点表示法查询属性。 如果您使用的是早期版本,请改用get函数,例如
ax = get(fig,'CurrentAxes').
上例中,如果加入语句:
fig = gcf; ax = fig.CurrentAxes;
则得到:
ax =
Axes - 属性:
XLim: [0 2]
YLim: [-100 20]
XScale: 'linear'
YScale: 'linear'
GridLineStyle: '-'
Position: [0.1300 0.1100 0.7750 0.8150]
Units: 'normalized'
文章来源: reborn.blog.csdn.net,作者:李锐博恩,版权归原作者所有,如需转载,请联系作者。
原文链接:reborn.blog.csdn.net/article/details/83448879

- 点赞
- 收藏
- 关注作者
评论(0)