Kubernetes 集群监控 kube-prometheus 部署

简介
Prometheus 介绍
Prometheus 是一套开源的监控 & 报警 & 时间序列数据库的组合,起始是由 SoundCloud 公司开发的。成立于 2012 年,之后许多公司和组织接受和采用 prometheus,他们便将它独立成开源项目,并且有公司来运作.该项目有非常活跃的社区和开发人员,目前是独立的开源项目,任何公司都可以使用它,2016 年,Prometheus 加入了云计算基金会,成为 kubernetes 之后的第二个托管项目.google SRE 的书内也曾提到跟他们 BorgMon 监控系统相似的实现是 Prometheus。现在最常见的 Kubernetes 容器管理系统中,通常会搭配 Prometheus 进行监控。
注意:
Prometheus-operator 已经改名为 Kube-promethues
Kubernetes Operator 介绍
在 Kubernetes 的支持下,管理和伸缩 Web 应用、移动应用后端以及 API 服务都变得比较简单了。其原因是这些应用一般都是无状态的,所以 Deployment 这样的基础 Kubernetes API 对象就可以在无需附加操作的情况下,对应用进行伸缩和故障恢复了。
而对于数据库、缓存或者监控系统等有状态应用的管理,就是个挑战了。这些系统需要应用领域的知识,来正确的进行伸缩和升级,当数据丢失或不可用的时候,要进行有效的重新配置。我们希望这些应用相关的运维技能可以编码到软件之中,从而借助 Kubernetes 的能力,正确的运行和管理复杂应用。
Operator 这种软件,使用 TPR (第三方资源,现在已经升级为 CRD) 机制对 Kubernetes API 进行扩展,将特定应用的知识融入其中,让用户可以创建、配置和管理应用。和 Kubernetes 的内置资源一样,Operator 操作的不是一个单实例应用,而是集群范围内的多实例。
Prometheus Operator 介绍
Kubernetes 的 Prometheus Operator 为 Kubernetes 服务和 Prometheus 实例的部署和管理提供了简单的监控定义。
安装完毕后,Prometheus Operator 提供了以下功能:
- 创建/毁坏: 在 Kubernetes namespace 中更容易启动一个 Prometheus 实例,一个特定的应用程序或团队更容易使用Operator。
- 简单配置: 配置 Prometheus 的基础东西,比如在 Kubernetes 的本地资源 versions, persistence, retention policies, 和 replicas。
- Target Services 通过标签: 基于常见的 Kubernetes label 查询,自动生成监控 target 配置;不需要学习 Prometheus 特定的配置语言。
架构
Prometheus Operator
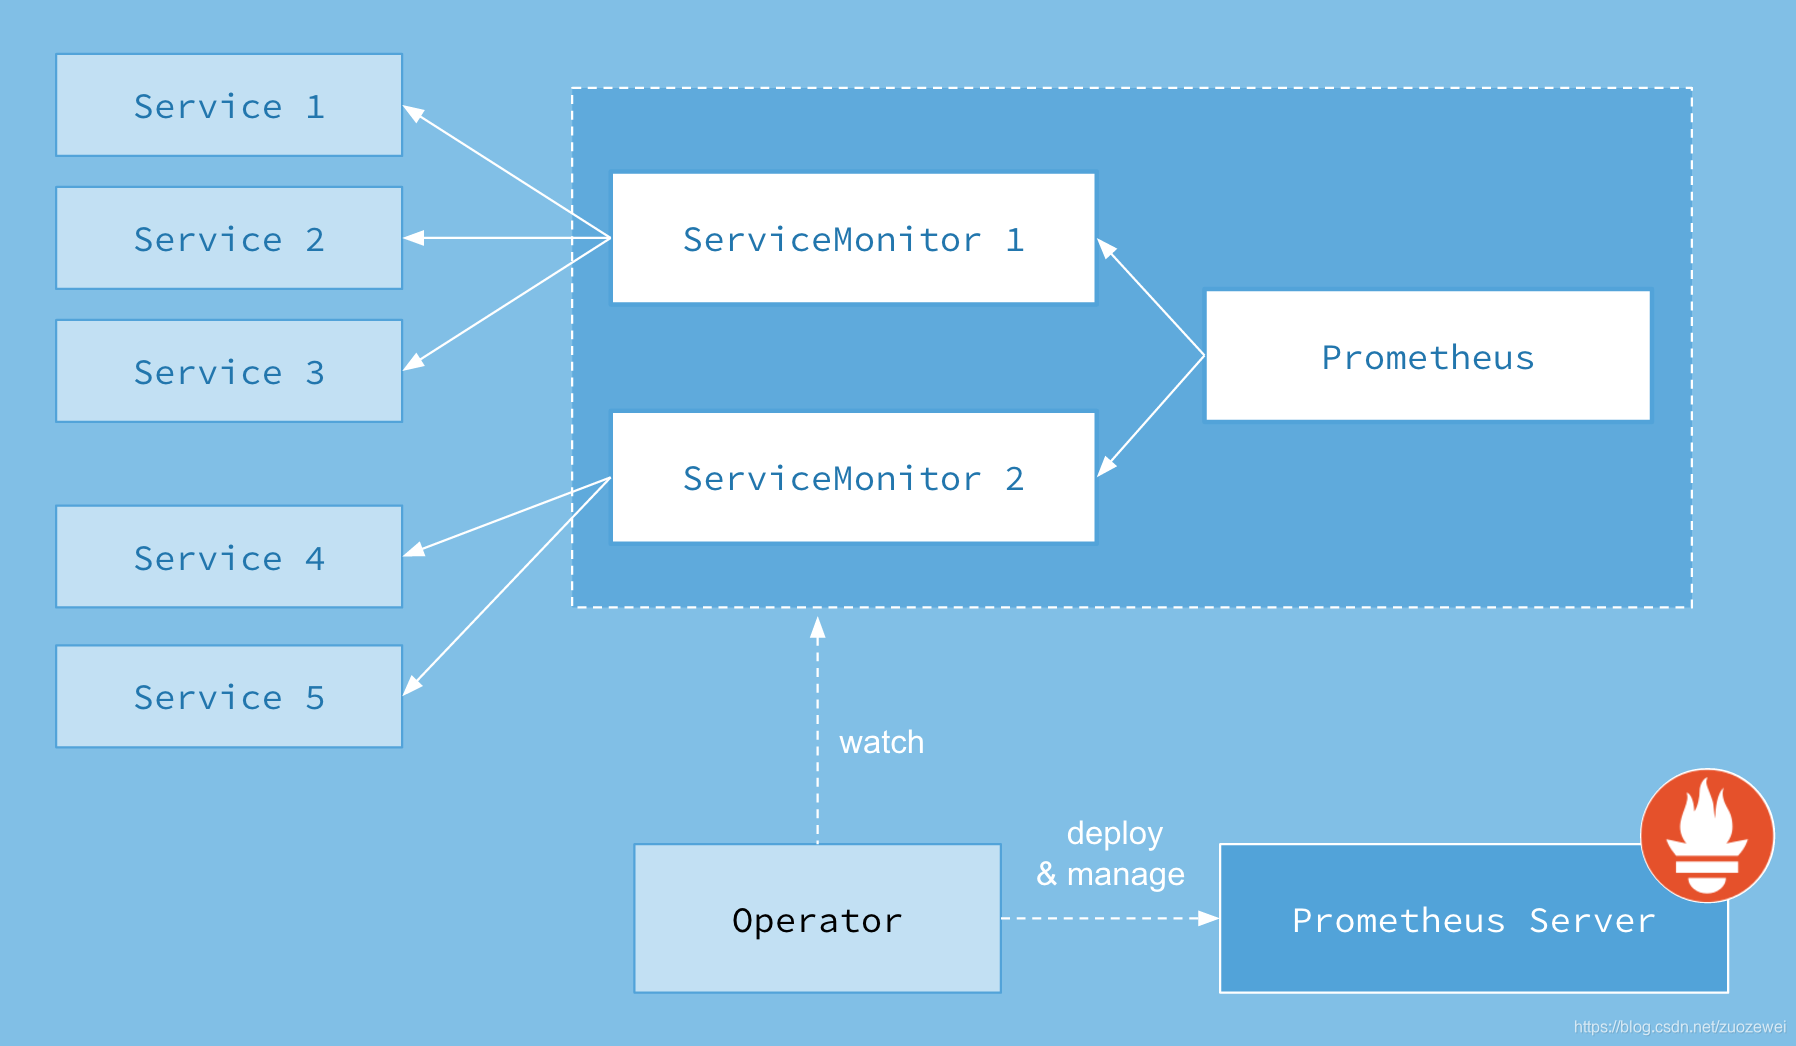
- Operator: Operator 资源会根据自定义资源(Custom Resource Definition / CRDs)来部署和管理 Prometheus Server,同时监控这些自定义资源事件的变化来做相应的处理,是整个系统的控制中心。
- Prometheus: Prometheus 资源是声明性地描述 Prometheus 部署的期望状态。
- Prometheus Server: Operator 根据自定义资源 Prometheus 类型中定义的内容而部署的 Prometheus Server 集群,这些自定义资源可以看作是用来管理 Prometheus Server 集群的 StatefulSets 资源。
- ServiceMonitor: ServiceMonitor 也是一个自定义资源,它描述了一组被 Prometheus 监控的 targets 列表。该资源通过 Labels 来选取对应的 Service Endpoint,让 Prometheus Server 通过选取的 Service 来获取 Metrics 信息。
- Service: Service 资源主要用来对应 Kubernetes 集群中的 Metrics Server Pod,来提供给 ServiceMonitor 选取让 Prometheus Server 来获取信息。简单的说就是 Prometheus 监控的对象,例如 Node Exporter Service、Mysql Exporter Service 等等。
- Alertmanager: Alertmanager 也是一个自定义资源类型,由 Operator 根据资源描述内容来部署 Alertmanager 集群。
Prometheus
作为一个监控系统,Prometheus 项目的作用和工作方式,其实可以用如下所示的一张官方示意图来解释:

可以看到,Prometheus 项目工作的核心,是使用 Pull (抓取)的方式去搜集被监控对象的 Metrics 数据(监控指标数据),然后,再把这些数据保存在一个 TSDB (时间序列数据库,比如 OpenTSDB、InfluxDB 等)当中,以便后续可以按照时间进行检索。有了这套核心监控机制, Prometheus 剩下的组件就是用来配合这套机制的运行。比如 Pushgateway,可以允许被监控对象以 Push 的方式向 Prometheus 推送 Metrics 数据。而 Alertmanager,则可以根据 Metrics 信息灵活地设置报警。当然, Prometheus 最受用户欢迎的功能,还是通过 Grafana 对外暴露出的、可以灵活配置的监控数据可视化界面。
安装
系统参数:
- Kube-promethues 版本: 0.6.0
- Kubernetes 版本: 1.18.5
- 项目 Github 地址: https://github.com/coreos/kube-prometheus
拉取 Prometheus Operator
先从 Github 上将源码拉取下来,利用源码项目已经写好的 kubernetes 的 yaml 文件进行一系列集成镜像的安装,如 grafana、prometheus 等等。
从 GitHub 拉取 Prometheus Operator 源码:
wget https://github.com/coreos/kube-prometheus/archive/v0.6.0.tar.gz
解压:
tar -zxvf v0.6.0.tar.gz
进行文件分类
由于它的文件都存放在项目源码的 manifests 文件夹下,所以需要进入其中进行启动这些 kubernetes 应用 yaml 文件。又由于这些文件堆放在一起,不利于分类启动,所以这里将它们分类。
进入源码的 manifests 文件夹:
cd kube-prometheus-0.6.0/manifests/
创建文件夹并且将 yaml 文件分类:
# 创建文件夹
mkdir -p node-exporter alertmanager grafana kube-state-metrics prometheus serviceMonitor adapter

# 移动 yaml 文件,进行分类到各个文件夹下
mv *-serviceMonitor* serviceMonitor/
mv grafana-* grafana/
mv kube-state-metrics-* kube-state-metrics/
mv alertmanager-* alertmanager/
mv node-exporter-* node-exporter/
mv prometheus-adapter* adapter/
mv prometheus-* prometheus/
基本目录结构如下:
$ tree
manifests/
├── adapter
│   ├── prometheus-adapter-apiService.yaml
│   ├── prometheus-adapter-clusterRoleAggregatedMetricsReader.yaml
│   ├── prometheus-adapter-clusterRoleBindingDelegator.yaml
│   ├── prometheus-adapter-clusterRoleBinding.yaml
│   ├── prometheus-adapter-clusterRoleServerResources.yaml
│   ├── prometheus-adapter-clusterRole.yaml
│   ├── prometheus-adapter-configMap.yaml
│   ├── prometheus-adapter-deployment.yaml
│   ├── prometheus-adapter-roleBindingAuthReader.yaml
│   ├── prometheus-adapter-serviceAccount.yaml
│   └── prometheus-adapter-service.yaml
├── alertmanager
│   ├── alertmanager-alertmanager.yaml
│   ├── alertmanager-secret.yaml
│   ├── alertmanager-serviceAccount.yaml
│   └── alertmanager-service.yaml
├── grafana
│   ├── grafana-dashboardDatasources.yaml
│   ├── grafana-dashboardDefinitions.yaml
│   ├── grafana-dashboardSources.yaml
│   ├── grafana-deployment.yaml
│   ├── grafana-pvc.yaml
│   ├── grafana-serviceAccount.yaml
│   └── grafana-service.yaml
├── kube-state-metrics
│   ├── kube-state-metrics-clusterRoleBinding.yaml
│   ├── kube-state-metrics-clusterRole.yaml
│   ├── kube-state-metrics-deployment.yaml
│   ├── kube-state-metrics-serviceAccount.yaml
│   └── kube-state-metrics-service.yaml
├── node-exporter
│   ├── node-exporter-clusterRoleBinding.yaml
│   ├── node-exporter-clusterRole.yaml
│   ├── node-exporter-daemonset.yaml
│   ├── node-exporter-serviceAccount.yaml
│   └── node-exporter-service.yaml
├── prometheus
│   ├── prometheus-clusterRoleBinding.yaml
│   ├── prometheus-clusterRole.yaml
│   ├── prometheus-prometheus.yaml
│   ├── prometheus-roleBindingConfig.yaml
│   ├── prometheus-roleBindingSpecificNamespaces.yaml
│   ├── prometheus-roleConfig.yaml
│   ├── prometheus-roleSpecificNamespaces.yaml
│   ├── prometheus-rules.yaml
│   ├── prometheus-serviceAccount.yaml
│   └── prometheus-service.yaml
├── serviceMonitor
│   ├── alertmanager-serviceMonitor.yaml
│   ├── grafana-serviceMonitor.yaml
│   ├── kube-state-metrics-serviceMonitor.yaml
│   ├── node-exporter-serviceMonitor.yaml
│   ├── prometheus-adapter-serviceMonitor.yaml
│   ├── prometheus-operator-serviceMonitor.yaml
│   ├── prometheus-serviceMonitorApiserver.yaml
│   ├── prometheus-serviceMonitorCoreDNS.yaml
│   ├── prometheus-serviceMonitorKubeControllerManager.yaml
│   ├── prometheus-serviceMonitorKubelet.yaml
│   ├── prometheus-serviceMonitorKubeScheduler.yaml
│   └── prometheus-serviceMonitor.yaml
└── setup
    ├── 0namespace-namespace.yaml
    ├── prometheus-operator-0alertmanagerCustomResourceDefinition.yaml
    ├── prometheus-operator-0podmonitorCustomResourceDefinition.yaml
    ├── prometheus-operator-0prometheusCustomResourceDefinition.yaml
    ├── prometheus-operator-0prometheusruleCustomResourceDefinition.yaml
    ├── prometheus-operator-0servicemonitorCustomResourceDefinition.yaml
    ├── prometheus-operator-0thanosrulerCustomResourceDefinition.yaml
    ├── prometheus-operator-clusterRoleBinding.yaml
    ├── prometheus-operator-clusterRole.yaml
    ├── prometheus-operator-deployment.yaml
    ├── prometheus-operator-serviceAccount.yaml
    └── prometheus-operator-service.yaml
修改 Service 端口设置
修改 Prometheus Service
修改 prometheus-service.yaml 文件
vim prometheus/prometheus-service.yaml
修改prometheus Service端口类型为 NodePort,设置 NodePort 端口为 32101:
apiVersion: v1
kind: Service
metadata:
  labels:
    prometheus: k8s
  name: prometheus-k8s
  namespace: monitoring
spec:
  type: NodePort
  ports:
  - name: web
    port: 9090
    targetPort: web
    nodePort: 32101
  selector:
    app: prometheus
    prometheus: k8s
  sessionAffinity: ClientIP
修改 Grafana Service
修改 grafana-service.yaml 文件:
vim grafana/grafana-service.yaml
修改 garafana service 端口类型为 NodePort,设置 NodePort 端口为 32102:
apiVersion: v1
kind: Service
metadata:
  labels:
    app: grafana
  name: grafana
  namespace: monitoring
spec:
  type: NodePort
  ports:
  - name: http
    port: 3000
    targetPort: http
    nodePort: 32102
  selector:
    app: grafana
修改数据持久化存储
prometheus 实际上是通过 emptyDir 进行挂载的,我们知道 emptyDir 挂载的数据的生命周期和 Pod 生命周期一致的,如果 Pod 挂掉了,那么数据也就丢失了,这也就是为什么我们重建 Pod 后之前的数据就没有了的原因,所以这里修改它的持久化配置。
创建 StorageClass
这里我们选择 NFS 存储的 StorageClass,直接使用前面创建的 StorageClass 即可。
修改 Prometheus 持久化
修改 prometheus-prometheus.yaml文件:
vim prometheus/prometheus-prometheus.yaml
prometheus是一种 StatefulSet 有状态集的部署模式,所以直接将 StorageClass 配置到里面,在下面的 yaml 中最下面添加持久化配置:
apiVersion: monitoring.coreos.com/v1
kind: Prometheus
metadata:
  labels:
    prometheus: k8s
  name: k8s
  namespace: monitoring
spec:
  alerting:
    alertmanagers:
    - name: alertmanager-main
      namespace: monitoring
      port: web
  image: quay.io/prometheus/prometheus:v2.20.0
  nodeSelector:
    kubernetes.io/os: linux
  podMonitorNamespaceSelector: {}
  podMonitorSelector: {}
  replicas: 2
  resources:
    requests:
      memory: 400Mi
  ruleSelector:
    matchLabels:
      prometheus: k8s
      role: alert-rules
  securityContext:
    fsGroup: 2000
    runAsNonRoot: true
    runAsUser: 1000
  serviceAccountName: prometheus-k8s
  serviceMonitorNamespaceSelector: {}
  serviceMonitorSelector: {}
  version: v2.20.0
  storage:                                  # 添加持久化配置,指定StorageClass
    volumeClaimTemplate:
      spec:
        storageClassName: nfs-storage-new   # 指定 StorageClass
        resources:
          requests:
            storage: 10Gi
修改 Grafana 持久化配置
创建 grafana-pvc.yaml 文件
由于 Grafana 是部署模式为 Deployment,所以我们提前为其创建一个 grafana-pvc.yaml 文件,加入下面 PVC 配置。
kind: PersistentVolumeClaim
apiVersion: v1
metadata:
  name: grafana
  namespace: monitoring  #---指定namespace为monitoring
spec:
  storageClassName: nfs-storage-new #---指定StorageClass
  accessModes:
    - ReadWriteOnce
  resources:
    requests:
      storage: 5Gi
修改 grafana-deployment.yaml 文件设置持久化配置,应用上面的 PVC:
vim grafana/grafana-deployment.yaml
将 volumes 里面的 “grafana-storage” 配置注掉,新增如下配置,挂载一个名为 grafana 的 PVC:
......
      volumes:
      - name: grafana-storage       # 新增持久化配置
        persistentVolumeClaim:
          claimName: grafana        # 设置为创建的PVC名称
      #- emptyDir: {}               # 注释掉旧的配置
      #  name: grafana-storage
      - name: grafana-datasources
        secret:
          secretName: grafana-datasources
      - configMap:
          name: grafana-dashboards
        name: grafana-dashboards
......
安装Prometheus Operator
所有文件都在 manifests 目录下执行。
安装 Operator
kubectl apply -f setup/
查看 Pod,等 pod 创建起来在进行下一步:
$ kubectl get pods -n monitoring

NAME                                   READY   STATUS    RESTARTS
prometheus-operator-5d6f6f5d68-mb88p   1/1     Running   0
这会创建一个名为 monitoring 的命名空间,以及相关的 CRD 资源对象声明和 Prometheus Operator 控制器。前面中我们介绍过 CRD 和 Operator 的使用,当我们声明完 CRD 过后,就可以来自定义资源清单了,但是要让我们声明的自定义资源对象生效就需要安装对应的 Operator 控制器,这里我们都已经安装了,所以接下来就可以来用 CRD 创建真正的自定义资源对象了。其实在 manifests 目录下面的就是我们要去创建的 Prometheus、Alertmanager 以及各种监控对象的资源清单。
安装其它组件
没有特殊的定制需求我们可以直接一键安装:
kubectl apply -f adapter/
kubectl apply -f alertmanager/
kubectl apply -f node-exporter/
kubectl apply -f kube-state-metrics/
kubectl apply -f grafana/
kubectl apply -f prometheus/
kubectl apply -f serviceMonitor/
查看 Pod 状态:
$ kubectl get pods -n monitoring
NAME                                   READY   STATUS    RESTARTS   AGE
alertmanager-main-0                    2/2     Running   0          1h
alertmanager-main-1                    2/2     Running   0          1h
alertmanager-main-2                    2/2     Running   0          1h
grafana-84db8f5cd8-7c6gt               1/1     Running   0          1h
kube-state-metrics-69d4c7c69d-ldrwj    3/3     Running   0          1h
node-exporter-btlb2                    2/2     Running   0          1h
node-exporter-k52kv                    2/2     Running   0          1h
node-exporter-m29nb                    2/2     Running   0          1h
node-exporter-ppdn4                    2/2     Running   0          1h
node-exporter-qnmrg                    2/2     Running   0          1h
node-exporter-w7hfx                    2/2     Running   0          1h
node-exporter-z2v7l                    2/2     Running   0          1h
prometheus-adapter-66b855f564-blqmb    1/1     Running   0          1h
prometheus-k8s-0                       3/3     Running   0          1h
prometheus-k8s-1                       3/3     Running   0          1h
prometheus-operator-57859b8b59-rnxcj   2/2     Running   0          1h
查看 Prometheus & Grafana
查看 Prometheus
打开地址:http://node_ip:32101 查看 Prometheus 采集的目标,看其各个采集服务状态有没有错误。
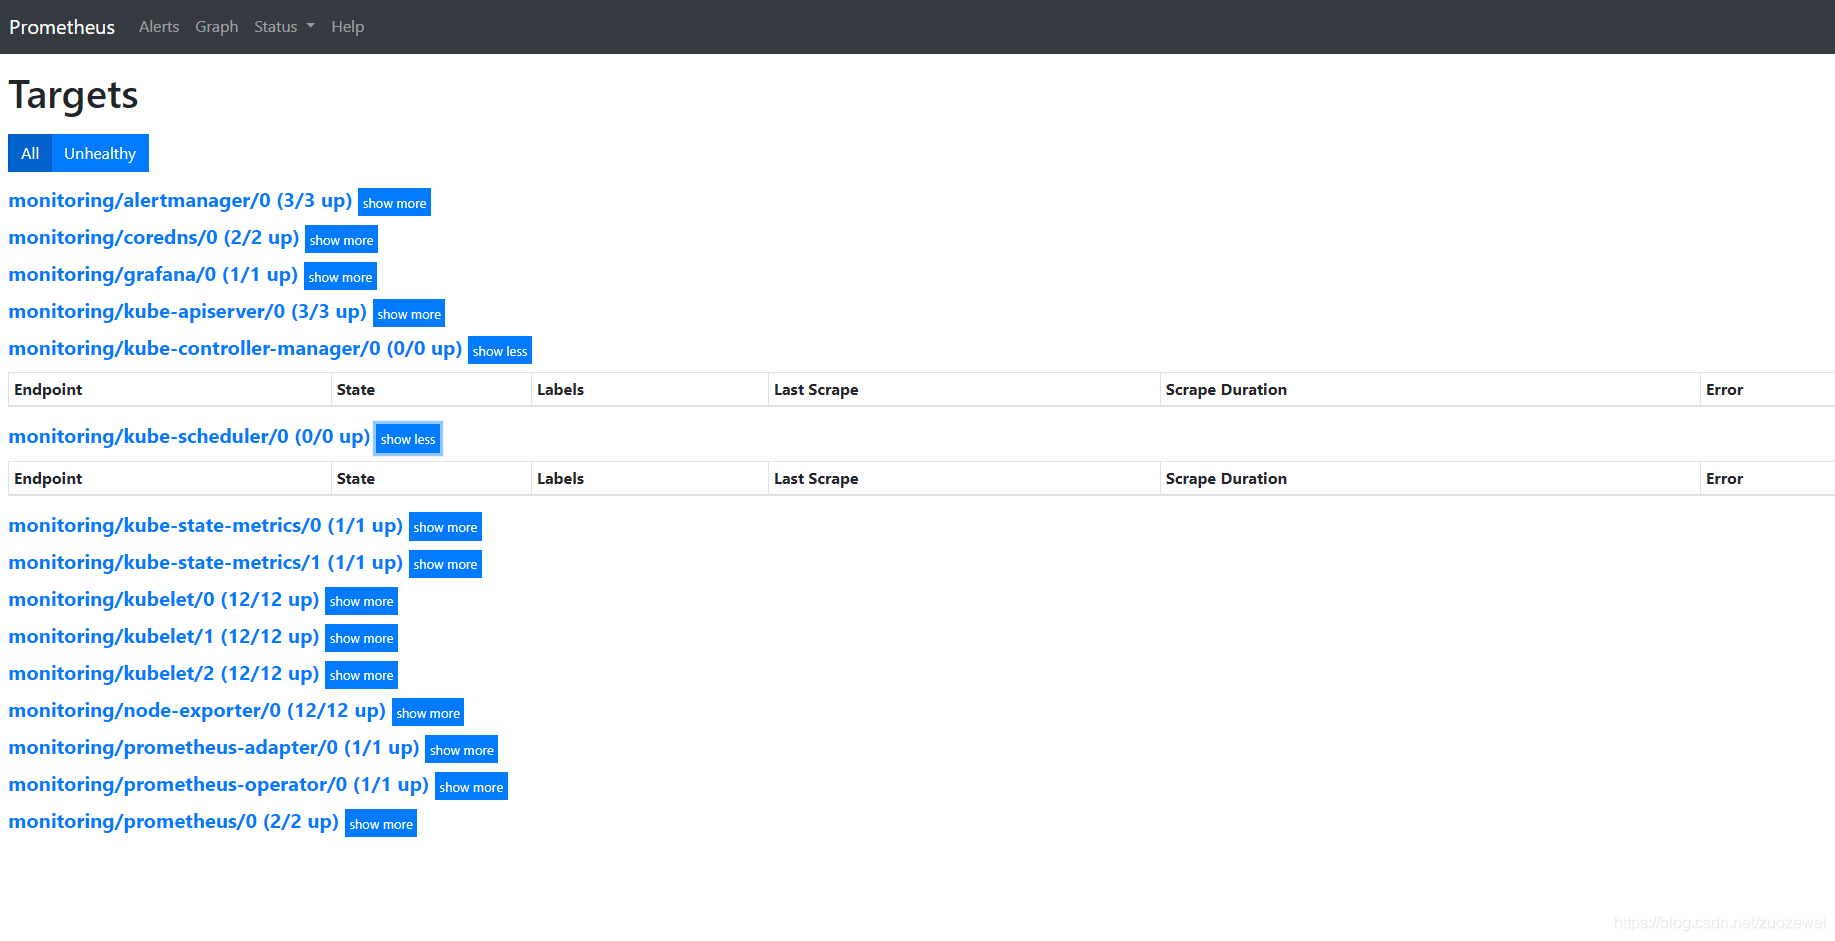
可以看到已经监控上了很多指标数据了,上面我们可以看到 Prometheus 是两个副本,我们这里通过 Service 去访问,按正常来说请求是会去轮询访问后端的两个 Prometheus 实例的,但实际上我们这里访问的时候始终是路由到后端的一个实例上去,因为这里的 Service 在创建的时候添加了 SessionAffinity:ClientIP 这样的属性,会根据 ClientIP 来做 Session 亲和性,所以我们不用担心请求会到不同的副本上去。
查看 Grafana
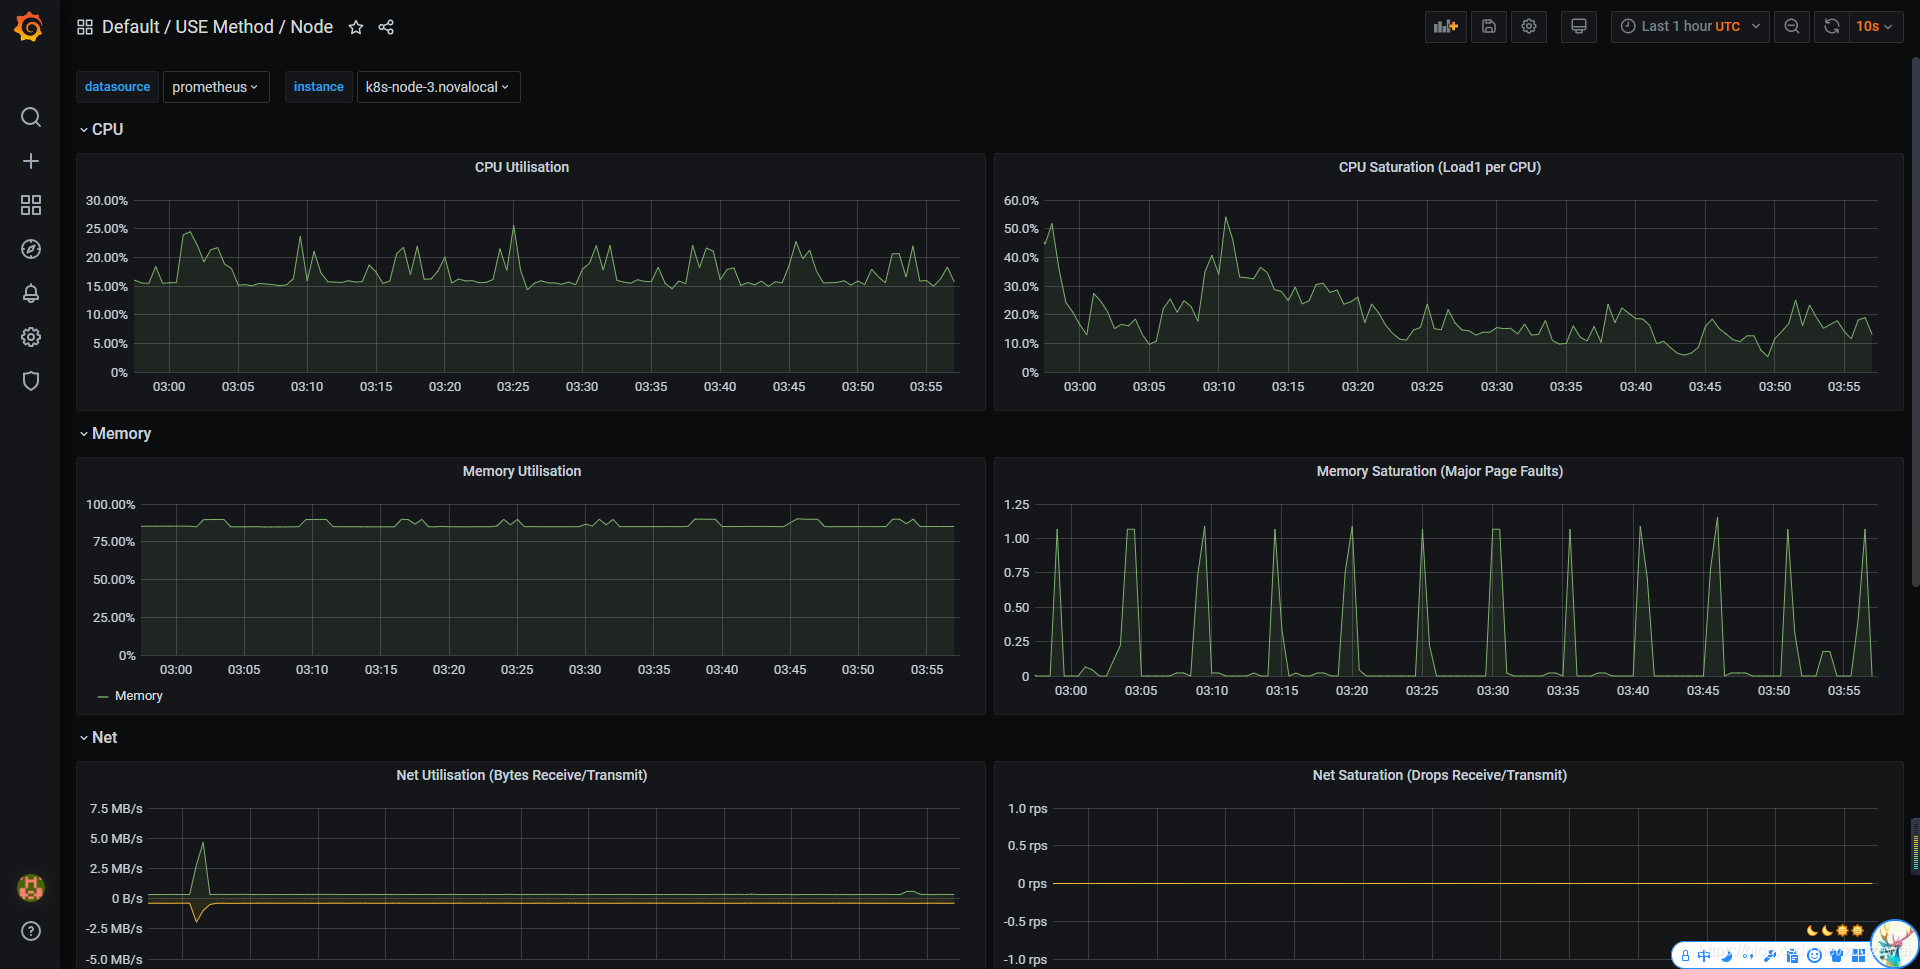
打开地址:http://node_ip:32102 查看 Grafana 图表,看其 Kubernetes 集群是否能正常显示。
- 默认用户名:admin
- 默认密码:admin

可以看到各种仪表盘:

小结
安装 Prometheus 之后,我们就可以按照 Metrics 数据的来源,来对 Kubernetes 的监控体系做一个简要的概括:
- 第一种是宿主机(node)的监控数据。这部分数据的提供,需要借助 Node Exporter 。一般来说,Node Exporter 会以 DaemonSet 的方式运行在宿主机上。其实,所谓的 Exporter,就是代替被监控对象来对 Prometheus 暴露出可以被“抓取”的 Metrics 信息的一个辅助进程。而 Node Exporter 可以暴露给 Prometheus 采集的 Metrics 数据, 也不单单是节点的负载(Load)、CPU 、内存、磁盘以及网络这样的常规信息,它的 Metrics 指标很丰富,具体你可以查看 Node Exporter 列表。
- 第二种是来自于 Kubernetes 的 API Server、kubelet 等组件的
/metrics API。除了常规的 CPU、内存的信息外,这部分信息还主要包括了各个组件的核心监控指标。比如,对于API Server 来说,它就会在/metrics API里,暴露出各个 Controller 的工作队列(Work Queue)的长度、请求的 QPS 和延迟数据等等。这些信息,是检查 Kubernetes 本身工作情况的主要依据。 - 第三种是 Kubernetes 相关的监控数据。这部分数据,一般叫作 Kubernetes 核心监控数据(core metrics)。这其中包括了 Pod、Node、容器、Service 等主要 Kubernetes 核心概念的 Metrics。其中,容器相关的 Metrics 主要来自于 kubelet 内置的 cAdvisor 服务。在 kubelet 启动后,cAdvisor 服务也随之启动,而它能够提供的信息,可以细化到每一个容器的 CPU 、文件系统、内存、网络等资源的使用情况。需要注意的是,这里提到的是 Kubernetes 核心监控数据。
文章源码:
参考资料:
- [1]:《深入剖析Kubernetes》

- 点赞
- 收藏
- 关注作者
评论(0)