简介
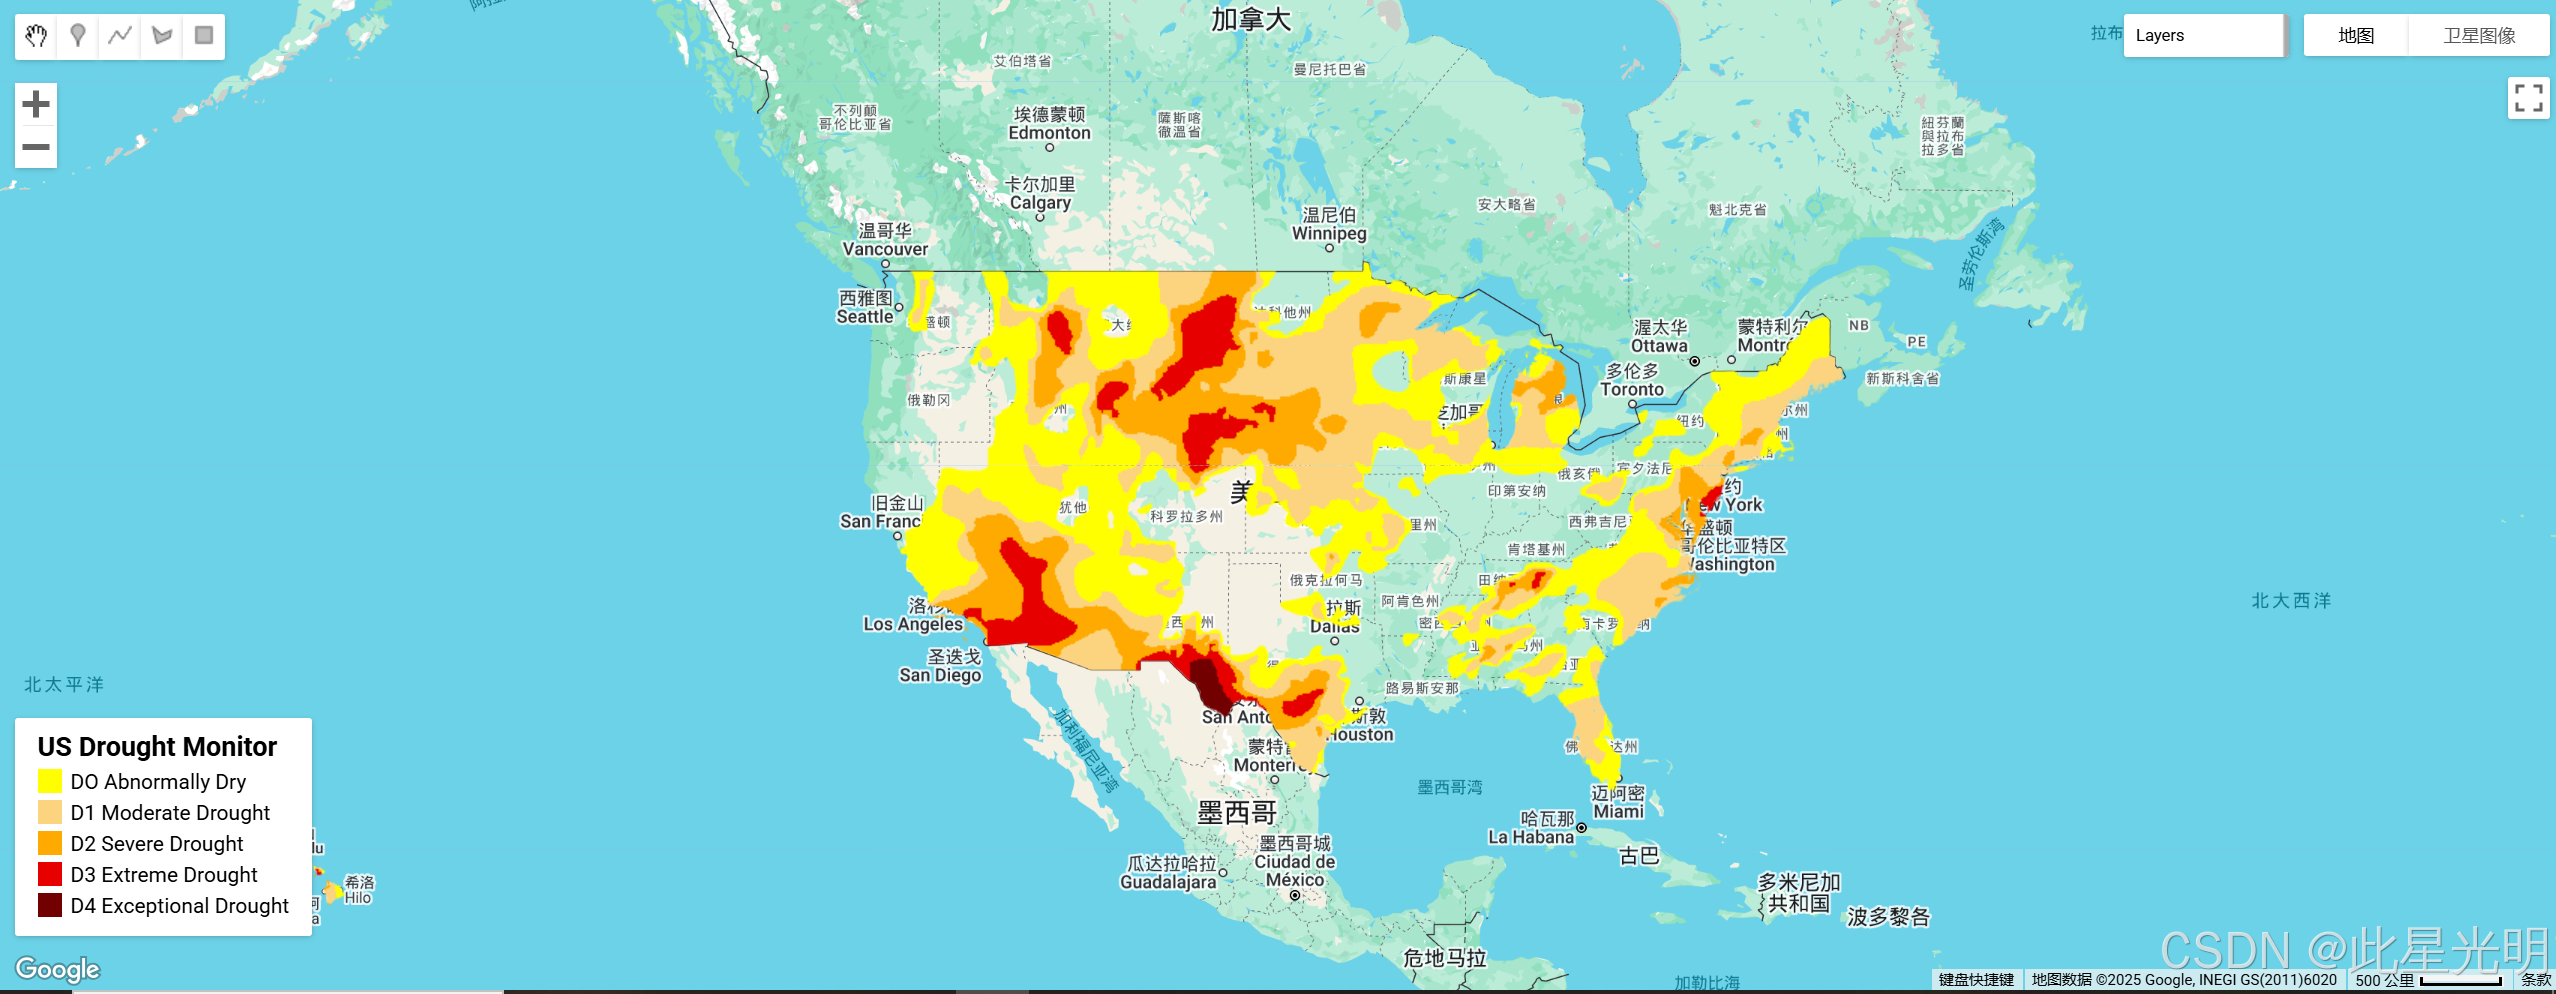
美国干旱监测 "是每周四发布的地图,显示美国部分地区的干旱情况。 该地图采用五种分级:异常干旱(D0),显示可能进入或即将摆脱干旱的地区;四级干旱:中度(D1)、严重(D2)、极度(D3)和异常(D4)。 干旱监测仪自 1999 年推出以来,一直由内布拉斯加大学林肯分校的国家干旱缓解中心 (NDMC)、美国国家海洋与大气管理局 (NOAA) 和美国农业部 (USDA) 联合制作。 内布拉斯加大学林肯分校的 NDMC 负责管理干旱监测网站和相关数据,并向 NOAA、USDA 和其他机构提供地图和数据。 该网站可在 droughtmonitor.unl.edu 免费查阅。
数据集说明
空间信息
Dataset Availability
2000-01-04T00:00:00 -
Dataset Provider
National Drought Mitigation Center
Contact
Contact information not available.
Collection Snippet
Copied
ee.ImageCollection("projects/sat-io/open-datasets/us-drought-monitor")
变量
Resolution
250 meters
Bands Table
| Name |
Description |
Min |
Max |
| b1 |
Drought classes
|
0 |
4 |
代码
var usdm = ee.ImageCollection(
  "projects/sat-io/open-datasets/us-drought-monitor"
);
/*
Category	Description
DO	Abnormally Dry
D1	Moderate Drought
D2	Severe Drought
D3	Extreme Drought
D4	Exceptional Drought
*/

var usdm = ee.Image(usdm.toList(usdm.size()).get(-1));

// Define a dictionary which will be used to make legend and visualize image on map
var dict = {
  names: [
    "DO	Abnormally Dry", //1
    "D1 Moderate Drought", //2
    "D2 Severe Drought", //3
    "D3 Extreme Drought", //4
    "D4 Exceptional Drought", //5
  ],
  colors: ["FFFF00", "FCD37F", "FFAA00", "E60000", "730000"],
};

// Create a panel to hold the legend widget
var legend = ui.Panel({
  style: {
    position: "bottom-left",
    padding: "8px 15px",
  },
});

// Function to generate the legend
function addCategoricalLegend(panel, dict, title) {
  // Create and add the legend title.
  var legendTitle = ui.Label({
    value: title,
    style: {
      fontWeight: "bold",
      fontSize: "18px",
      margin: "0 0 4px 0",
      padding: "0",
    },
  });
  panel.add(legendTitle);

  var loading = ui.Label("Loading legend...", { margin: "2px 0 4px 0" });
  panel.add(loading);

  // Creates and styles 1 row of the legend.
  var makeRow = function (color, name) {
    // Create the label that is actually the colored box.
    var colorBox = ui.Label({
      style: {
        backgroundColor: color,
        // Use padding to give the box height and width.
        padding: "8px",
        margin: "0 0 4px 0",
      },
    });

    // Create the label filled with the description text.
    var description = ui.Label({
      value: name,
      style: { margin: "0 0 4px 6px" },
    });

    return ui.Panel({
      widgets: [colorBox, description],
      layout: ui.Panel.Layout.Flow("horizontal"),
    });
  };

  // Get the list of palette colors and class names from the image.
  var palette = dict["colors"];
  var names = dict["names"];
  loading.style().set("shown", false);

  for (var i = 0; i < names.length; i++) {
    panel.add(makeRow(palette[i], names[i]));
  }

  Map.add(panel);
}

/*
  // Display map and legend ///////////////////////////////////////////////////////////////////////////////
*/

// Add the legend to the map
addCategoricalLegend(legend, dict, "US Drought Monitor");

// Add USDM Image image to the map
Map.addLayer(
  usdm,
  { min: 0, max: 4, palette: dict["colors"] },
  usdm.get("system:index").getInfo()
);
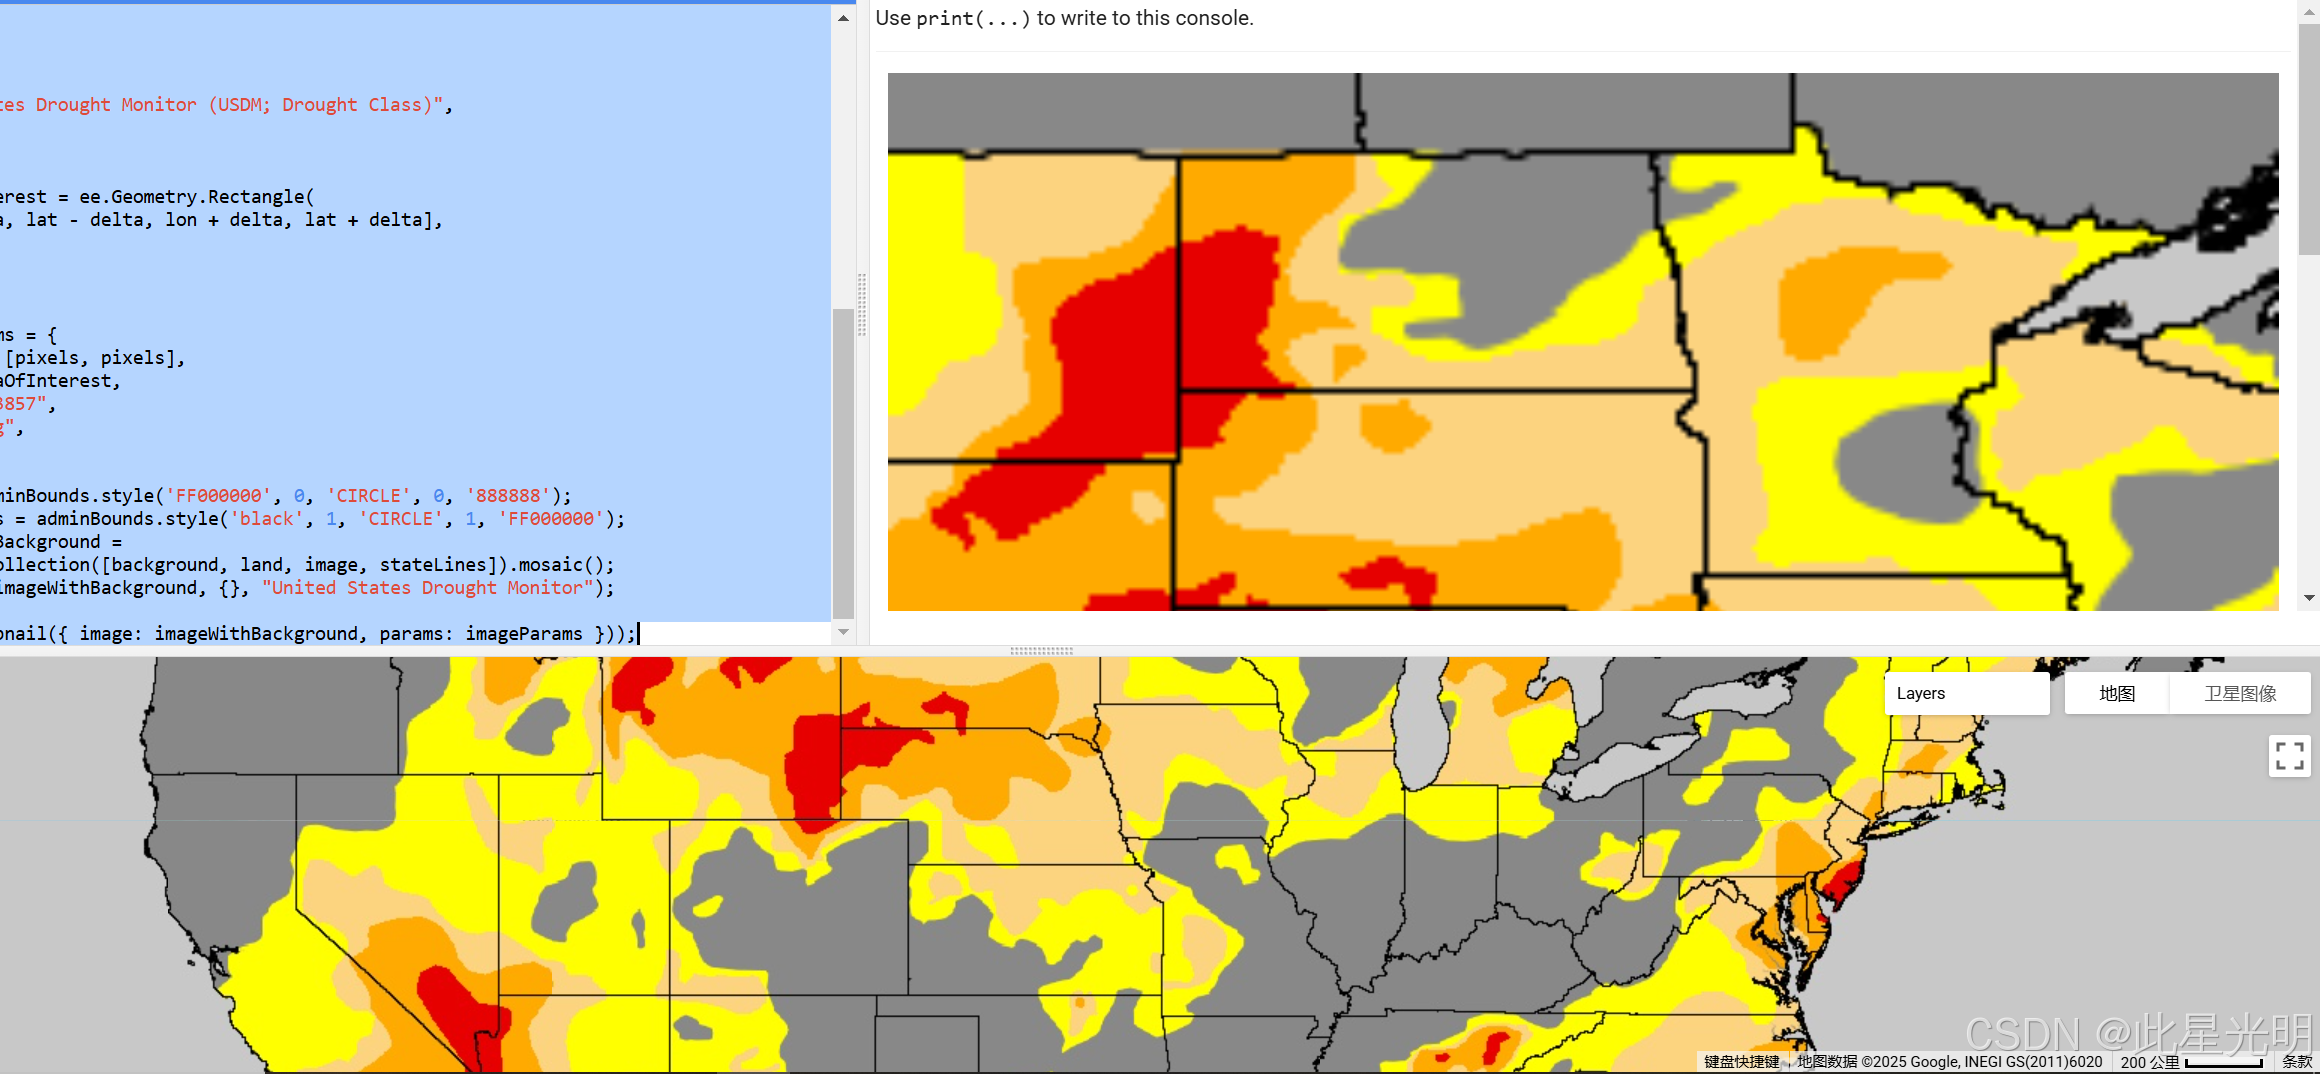
结果

代码2
var adminBounds = ee.FeatureCollection('FAO/GAUL_SIMPLIFIED_500m/2015/level1');
var usdm = ee.Image(
  ee
    .ImageCollection("projects/sat-io/open-datasets/us-drought-monitor")
    .sort("system:time_start", false)
    .first()
);

var lon = -98.19;
var lat = 40;

Map.setCenter(lon, lat, 5);

var gray = 200;
var background = ee.Image.rgb(gray, gray, gray).visualize({ min: 0, max: 255 });

// Degrees in EPSG:3857.
var delta = 10;
// Width and height of the thumbnail image.
var pixels = 256;

var image = usdm.visualize({
  min: 0,
  max: 4,
  palette: ["FFFF00", "FCD37F", "FFAA00", "E60000", "730000"],
});
Map.addLayer(
  image,
  {},
  "United States Drought Monitor (USDM; Drought Class)",
  false
);

var areaOfInterest = ee.Geometry.Rectangle(
  [lon - delta, lat - delta, lon + delta, lat + delta],
  null,
  false
);

var imageParams = {
  dimensions: [pixels, pixels],
  region: areaOfInterest,
  crs: "EPSG:3857",
  format: "png",
};

var land = adminBounds.style('FF000000', 0, 'CIRCLE', 0, '888888');
var stateLines = adminBounds.style('black', 1, 'CIRCLE', 1, 'FF000000');
var imageWithBackground =
    ee.ImageCollection([background, land, image, stateLines]).mosaic();
Map.addLayer(imageWithBackground, {}, "United States Drought Monitor");

print(ui.Thumbnail({ image: imageWithBackground, params: imageParams }));
引用
Sims, K., Reith, A., Bright, E., Kaufman, J., Pyle, J., Epting, J., Gonzales, J., Adams, D., Powell, E., Urban, M., & Rose, A. (2023). LandScan Global 2022 [Data set]. Oak Ridge National Laboratory. ORNL LandScan Viewer - Oak Ridge National Laboratory
许可
National Drought Mitigation Center; U.S. Department of Agriculture; National Oceanic and Atmospheric Administration (2023). United States Drought Monitor. University of Nebraska-Lincoln. Current Map | U.S. Drought Monitor. Accessed 2023-09-17
网址推荐
知识星球
知识星球 | 深度连接铁杆粉丝,运营高品质社群,知识变现的工具 (zsxq.com)https://wx.zsxq.com/group/48888525452428
机器学习
https://www.cbedai.net/xg
干旱监测平台
慧天干旱监测与预警-首页https://www.htdrought.com/
【声明】本内容来自华为云开发者社区博主,不代表华为云及华为云开发者社区的观点和立场。转载时必须标注文章的来源(华为云社区)、文章链接、文章作者等基本信息,否则作者和本社区有权追究责任。如果您发现本社区中有涉嫌抄袭的内容,欢迎发送邮件进行举报,并提供相关证据,一经查实,本社区将立刻删除涉嫌侵权内容,举报邮箱:
cloudbbs@huaweicloud.com


评论(0)