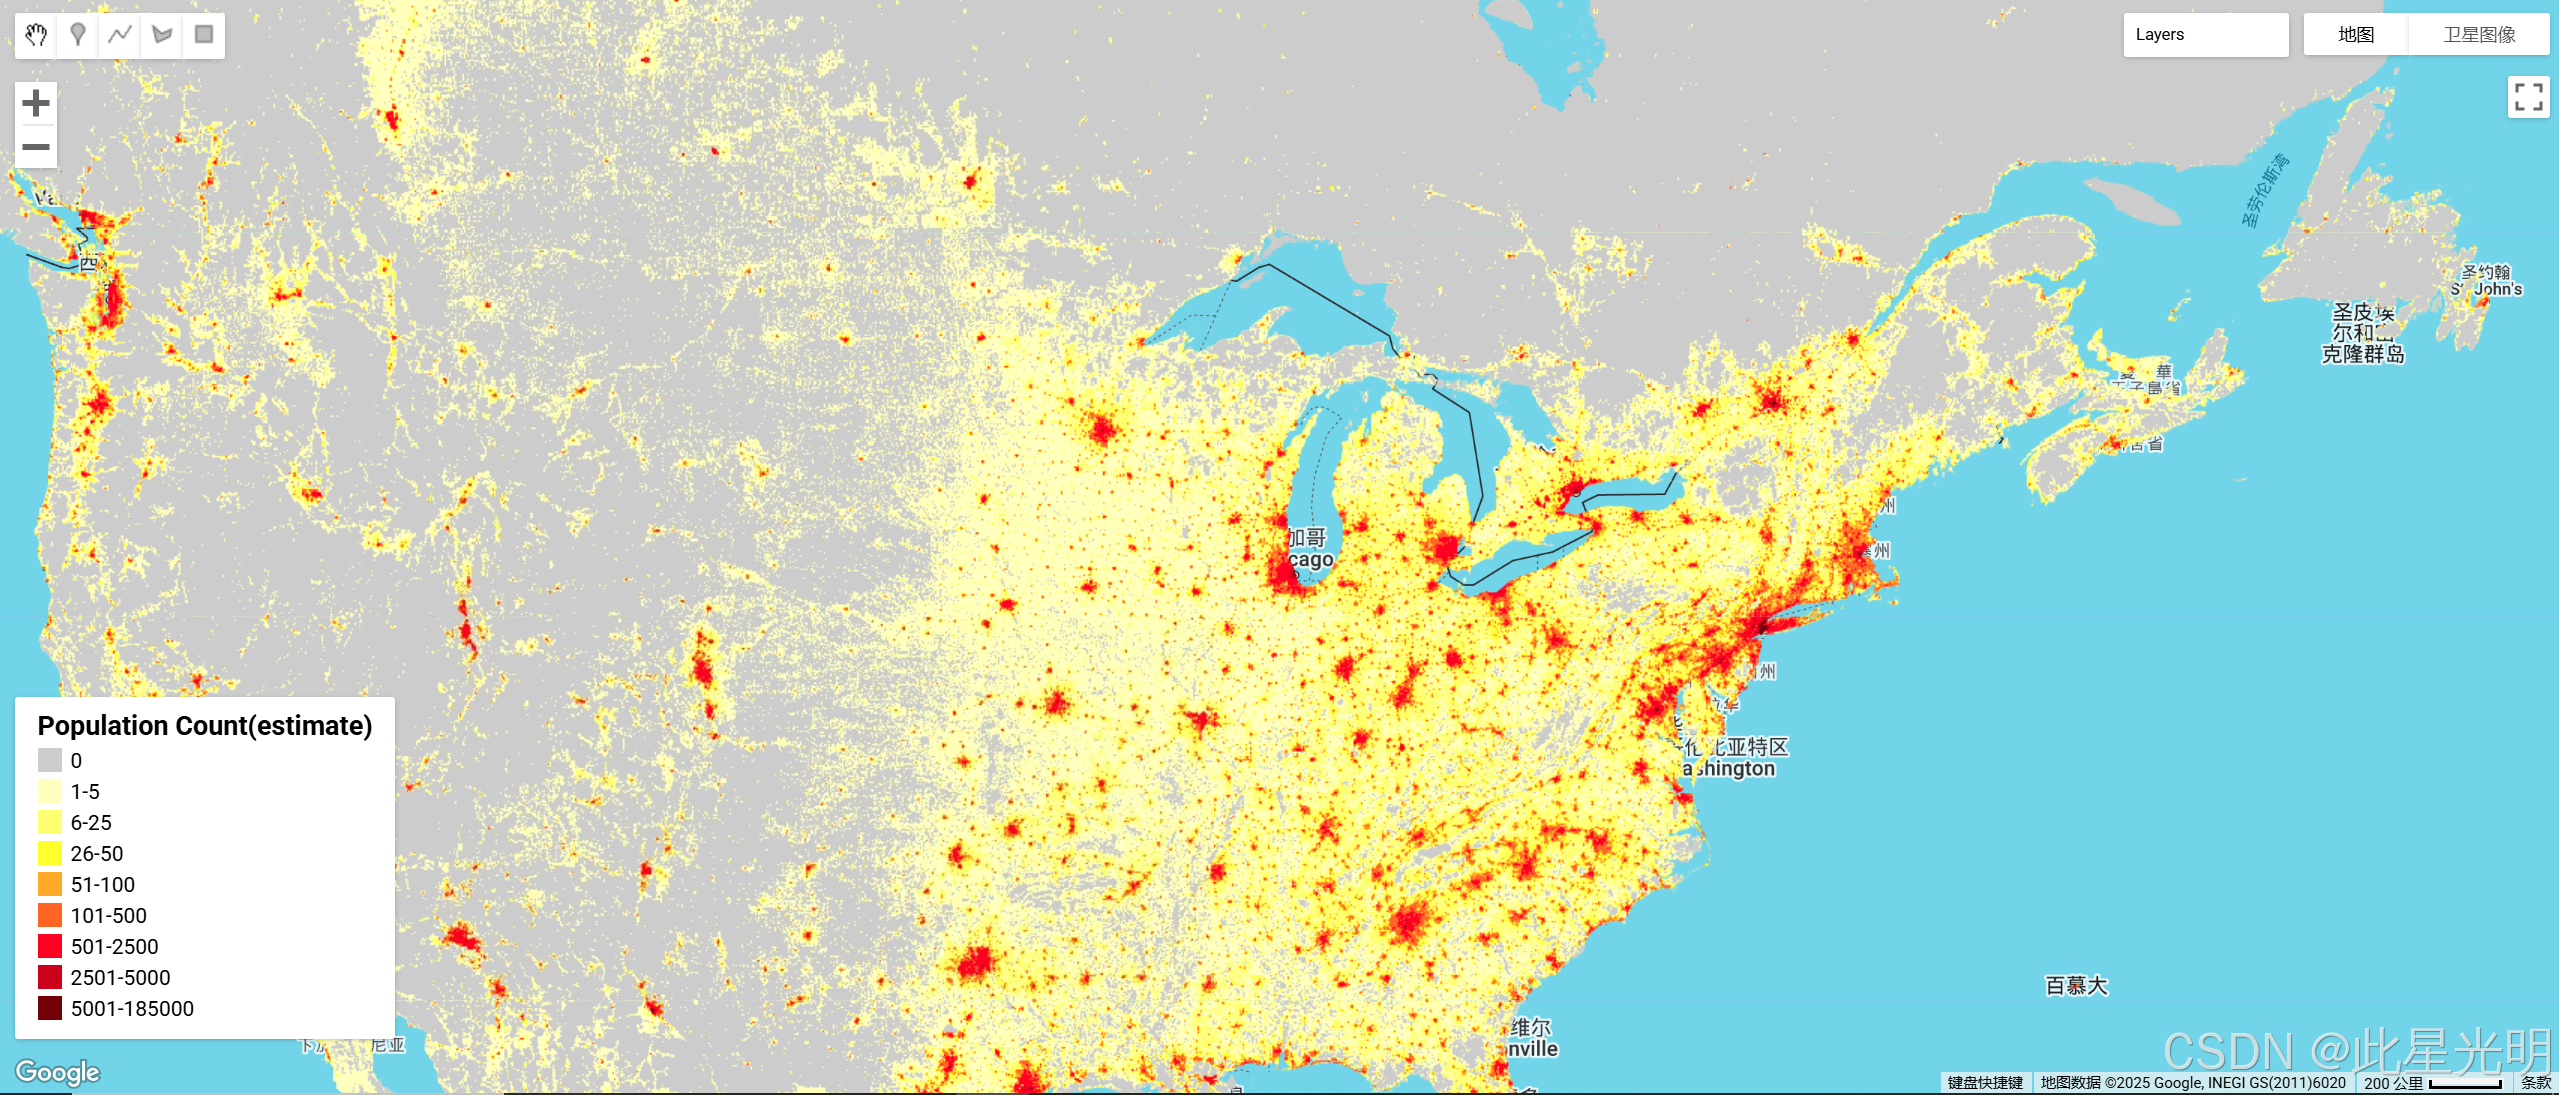
简介
美国橡树岭国家实验室(ORNL)提供的 LandScan 数据集是一个全面的高分辨率全球人口分布数据集,是广泛应用的宝贵资源。 利用最先进的空间建模技术和先进的地理空间数据源,LandScan 以 30 弧秒的分辨率提供了有关人口数量和密度的详细信息,从而能够对全球范围内的人类居住模式进行精确的最新了解。 凭借其准确性和细粒度,LandScan 支持城市规划、灾害响应、流行病学和环境研究等多个领域,成为决策者和研究人员了解和应对全球范围内各种社会和环境挑战的重要工具。
数据集说明
空间信息
Catalog owner
Dataset Availability
2000-01-01T00:00:00 - 2022-12-31T00:00:00
Dataset Provider
Oak Ridge National Laboratory
Contact
Contact information not available.
Collection Snippet
ee.ImageCollection("projects/sat-io/open-datasets/ORNL/LANDSCAN_GLOBAL")
变量
Resolution
1000 meters
Bands Table
| Name |
Description |
Min* |
Max* |
| b1 |
Estimated Population count
|
0 |
21171 |
* = Values are estimated
代码
var landscan_global =
    ee.ImageCollection('projects/sat-io/open-datasets/ORNL/LANDSCAN_GLOBAL');
var popcount_intervals = '<RasterSymbolizer>' +
    ' <ColorMap type="intervals" extended="false" >' +
    '<ColorMapEntry color="#CCCCCC" quantity="0" label="No Data"/>' +
    '<ColorMapEntry color="#FFFFBE" quantity="5" label="Population Count (Estimate)"/>' +
    '<ColorMapEntry color="#FEFF73" quantity="25" label="Population Count (Estimate)"/>' +
    '<ColorMapEntry color="#FEFF2C" quantity="50" label="Population Count (Estimate)"/>' +
    '<ColorMapEntry color="#FFAA27" quantity="100" label="Population Count (Estimate)"/>' +
    '<ColorMapEntry color="#FF6625" quantity="500" label="Population Count (Estimate)"/>' +
    '<ColorMapEntry color="#FF0023" quantity="2500" label="Population Count (Estimate)"/>' +
    '<ColorMapEntry color="#CC001A" quantity="5000" label="Population Count (Estimate)"/>' +
    '<ColorMapEntry color="#730009" quantity="185000" label="Population Count (Estimate)"/>' +
    '</ColorMap>' +
    '</RasterSymbolizer>';

// Define a dictionary which will be used to make legend and visualize image on
// map
var dict = {
  'names': [
    '0', '1-5', '6-25', '26-50', '51-100', '101-500', '501-2500', '2501-5000',
    '5001-185000'
  ],
  'colors': [
    '#CCCCCC', '#FFFFBE', '#FEFF73', '#FEFF2C', '#FFAA27', '#FF6625', '#FF0023',
    '#CC001A', '#730009'
  ]
};

// Create a panel to hold the legend widget
var legend = ui.Panel({style: {position: 'bottom-left', padding: '8px 15px'}});

// Function to generate the legend
function addCategoricalLegend(panel, dict, title) {
  // Create and add the legend title.
  var legendTitle = ui.Label({
    value: title,
    style: {
      fontWeight: 'bold',
      fontSize: '18px',
      margin: '0 0 4px 0',
      padding: '0'
    }
  });
  panel.add(legendTitle);

  var loading = ui.Label('Loading legend...', {margin: '2px 0 4px 0'});
  panel.add(loading);

  // Creates and styles 1 row of the legend.
  var makeRow = function(color, name) {
    // Create the label that is actually the colored box.
    var colorBox = ui.Label({
      style: {
        backgroundColor: color,
        // Use padding to give the box height and width.
        padding: '8px',
        margin: '0 0 4px 0'
      }
    });

    // Create the label filled with the description text.
    var description = ui.Label({value: name, style: {margin: '0 0 4px 6px'}});

    return ui.Panel({
      widgets: [colorBox, description],
      layout: ui.Panel.Layout.Flow('horizontal')
    });
  };

  // Get the list of palette colors and class names from the image.
  var palette = dict['colors'];
  var names = dict['names'];
  loading.style().set('shown', false);

  for (var i = 0; i < names.length; i++) {
    panel.add(makeRow(palette[i], names[i]));
  }

  Map.add(panel);
}

addCategoricalLegend(legend, dict, 'Population Count(estimate)');

Map.addLayer(
    landscan_global.sort('system:time_start')
        .first()
        .sldStyle(popcount_intervals),
    {}, 'Population Count Estimate 2000');
Map.addLayer(
    landscan_global.sort('system:time_start', false)
        .first()
        .sldStyle(popcount_intervals),
    {}, 'Population Count Estimate 2022');
代码链接
https://code.earthengine.google.com/?scriptPath=Examples%3ADatasets%2Fsat-io%2Fprojects_sat-io_open-datasets_GLOBathy_GLOBathy_bathymetry
结果

引用
Sims, K., Reith, A., Bright, E., Kaufman, J., Pyle, J., Epting, J., Gonzales, J., Adams, D., Powell, E., Urban, M., & Rose, A. (2023). LandScan Global 2022 [Data set]. Oak Ridge National Laboratory. ORNL LandScan Viewer - Oak Ridge National Laboratory
许可
Landscan 数据集采用知识共享署名 4.0 国际许可协议。 用户可以为商业和非商业目的自由使用、复制、分发、传输和改编作品,不受任何限制,但必须明确注明出处。
网址推荐
知识星球
知识星球 | 深度连接铁杆粉丝,运营高品质社群,知识变现的工具 (zsxq.com)https://wx.zsxq.com/group/48888525452428
机器学习
https://www.cbedai.net/xg
干旱监测平台
慧天干旱监测与预警-首页https://www.htdrought.com/
【声明】本内容来自华为云开发者社区博主,不代表华为云及华为云开发者社区的观点和立场。转载时必须标注文章的来源(华为云社区)、文章链接、文章作者等基本信息,否则作者和本社区有权追究责任。如果您发现本社区中有涉嫌抄袭的内容,欢迎发送邮件进行举报,并提供相关证据,一经查实,本社区将立刻删除涉嫌侵权内容,举报邮箱:
cloudbbs@huaweicloud.com


评论(0)