地表温度(LST)对于评估地表状况的各种研究越来越重要,例如城市气候、蒸发和植被压力的研究。Landsat系列卫星有可能提供高空间分辨率的LST估计值,这特别适用于地方或小规模的研究。许多研究提出了Landsat系列的LST检索算法,一些数据集可以在线获得。然而,这些数据集通常要求用户能够处理大量的数据。谷歌地球引擎(GEE)是一个在线平台,旨在让遥感用户轻松地进行大数据分析,而不增加对本地计算资源的需求。然而,高空间分辨率的LST数据集目前还不能在GEE中使用。这里我们提供了一个代码库,可以在GEE中计算来自Landsat 4、5、7和8的LST。该代码可供用户自由使用,以计算Landsat LST,作为GEE中任何分析的一部分。https://www.cbedai.net/xg
LST制作的第一步是将NCEP再分析数据中的TCVW估计值与Landsat观测时间相匹配。然而,由于模型的粗略分辨率,TCWV值在所选区域内几乎是恒定的,因此,没有显示。计算LST所需的TIR表面辐射率来自于ASTER GEDv3数据集。图4b显示了相应的ASTER波段14的发射率图,它与Landsat TIR波段最为接近。ASTER NDVI值被用来计算相应的FVC,如图4c所示。在选定的地区,FVC和发射率值是相当均匀的。FVC通常相当低,大部分地区的数值在0.3和0.5之间。由此产生的裸地辐射率图显示了大约0.96-0.97的数值,这与11微米区域的光谱库中通常发现的数值一致[53]。图4d显示了用公式(2)从原始发射率值和FVC得出的第14波段的各自裸地发射率。Landsat图像的FVC值也是由各自的NDVI得出的(图4e)。Landsat的瞬时FVC图显示出比ASTER多得多的变化性。耕地和烧毁区在FVC图中显示出明显的模式。此外,河流最西边的稻田具有非常低的NDVI值,通常与水有关,因此,被掩盖了。图4f中显示了Landsat的TIR发射率值。植被密度低的地区的数值接近0.97,而植被茂密地区的发射率数值达到接近0.99,都与光谱库中的典型数值一致[53]。这个例子强调了使用植被覆盖来推导动态发射率值的重要性。图4g是Landsat TOA亮度温度值,图4h是相应的LST值。对于这里分析的白天的Landsat场景,LST在耕地和烧毁区比在森林上高。
2018年5月17日在葡萄牙中部(科英布拉)获取的Landsat-8图像的LST估算过程的各层。(a) Landsat-8的红、绿、蓝波段的自然色彩(RGB)合成;(b) ASTER波段14的辐射率;(c) ASTER植被覆盖率(FVC),由ASTER NDVI用公式(1)得出;(d) ASTER波段14的裸地辐射率,用公式(2)得出;(e) 用公式(1)从NDVI得出的Landsat-8 FVC;(f) 用公式(2)得出的Landsat-8 TIR发射率以及裸地发射率和FVC;(g) Landsat-8 TIR波段(B10)的亮度温度(BT;开尔文);(h) 用SMW算法得出的Landsat-8土地表面温度(LST;开尔文)。
代码:
/*
Author: Sofia Ermida (sofia.ermida@ipma.pt; @ermida_sofia)

This code is free and open.
By using this code and any data derived with it,
you agree to cite the following reference
in any publications derived from them:
Ermida, S.L., Soares, P., Mantas, V., Göttsche, F.-M., Trigo, I.F., 2020.
    Google Earth Engine open-source code for Land Surface Temperature estimation from the Landsat series.
    Remote Sensing, 12 (9), 1471; https://doi.org/10.3390/rs12091471

Example 1:
  This example shows how to compute Landsat LST from Landsat-8 over Coimbra
  This corresponds to the example images shown in Ermida et al. (2020)

*/

///////////////////////////// ATTENTION //////////////////////////////////////
/////////////////////////////////////////////////////////////////////////////
//
// As off 11.07.2022 a new version of the code is released:
//      - update to use collection 2 data
//      - emissivities of water and snow surfaces are now prescribed
//
// the previous version of the code will still be available; the replaced code
// is commented
//
//////////////////////////////////////////////////////////////////////////////
//////////////////////////////////////////////////////////////////////////////


// link to the code that computes the Landsat LST
var LandsatLST = require('users/sofiaermida/landsat_smw_lst:modules/Landsat_LST.js')


// select region of interest, date range, and landsat satellite
var geometry = ee.Geometry.Rectangle([-8.91, 40.0, -8.3, 40.4]);
var satellite = 'L8';
var date_start = '2022-05-15';
var date_end = '2022-05-31';
var use_ndvi = true;

// get landsat collection with added variables: NDVI, FVC, TPW, EM, LST
var LandsatColl = LandsatLST.collection(satellite, date_start, date_end, geometry, use_ndvi)
print(LandsatColl)

// select the first feature
var exImage = LandsatColl.first();

var cmap1 = ['blue', 'cyan', 'green', 'yellow', 'red'];
var cmap2 = ['F2F2F2','EFC2B3','ECB176','E9BD3A','E6E600','63C600','00A600'];

Map.centerObject(geometry)
Map.addLayer(exImage.select('TPW'),{min:0.0, max:60.0, palette:cmap1},'TCWV')
Map.addLayer(exImage.select('TPWpos'),{min:0.0, max:9.0, palette:cmap1},'TCWVpos')
Map.addLayer(exImage.select('FVC'),{min:0.0, max:1.0, palette:cmap2}, 'FVC')
Map.addLayer(exImage.select('EM'),{min:0.9, max:1.0, palette:cmap1}, 'Emissivity')
Map.addLayer(exImage.select('B10'),{min:290, max:320, palette:cmap1}, 'TIR BT')
Map.addLayer(exImage.select('LST'),{min:290, max:320, palette:cmap1}, 'LST')
Map.addLayer(exImage.multiply(0.0000275).add(-0.2),{bands: ['SR_B4', 'SR_B3', 'SR_B2'], min:0, max:0.3}, 'RGB')

// uncomment the code below to export a image band to your drive
/*
Export.image.toDrive({
  image: exImage.select('LST'),
  description: 'LST',
  scale: 30,
  region: geometry,
  fileFormat: 'GeoTIFF',
});
*/
代码2:
/*
Author: Sofia Ermida (sofia.ermida@ipma.pt; @ermida_sofia)
This code is free and open.
By using this code and any data derived with it,
you agree to cite the following reference
in any publications derived from them:
Ermida, S.L., Soares, P., Mantas, V., Göttsche, F.-M., Trigo, I.F., 2020.
Google Earth Engine open-source code for Land Surface Temperature estimation from the Landsat series.
Remote Sensing, 12 (9), 1471; https://doi.org/10.3390/rs12091471
Example 2:
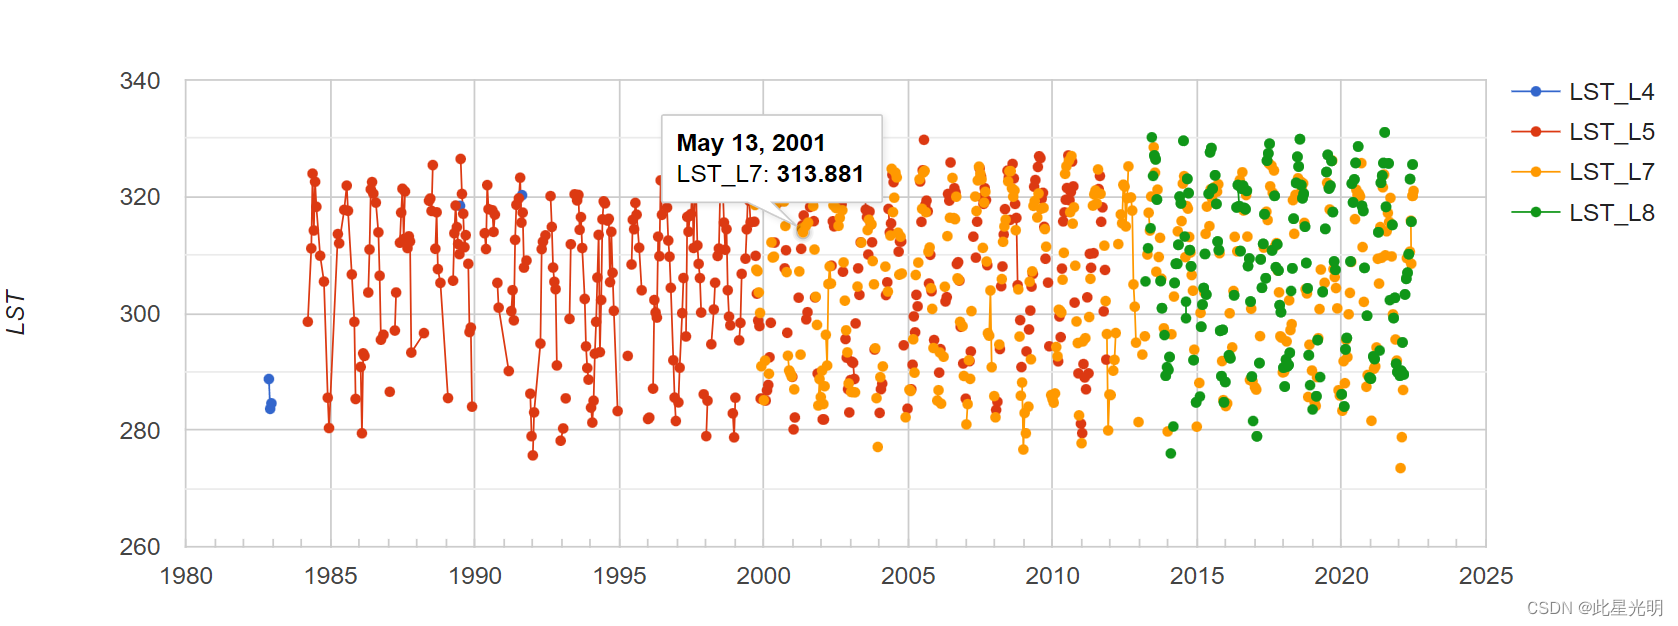
This example shows how to get LST time series at the SURFRAD DRA site
it corresponds to the method used to extract time series
for comparison with station LST used in Ermida et al. (2020)
*/
///////////////////////////// ATTENTION //////////////////////////////////////
/////////////////////////////////////////////////////////////////////////////
//
// As off 11.07.2022 a new version of the code is released:
// - update to use collection 2 data
// - emissivities of water and snow surfaces are now prescribed
//
// the previous version of the code will still be available; the replaced code
// is commented
//
//////////////////////////////////////////////////////////////////////////////
//////////////////////////////////////////////////////////////////////////////
// link to the code that computes the Landsat LST
var LandsatLST = require('users/sofiaermida/landsat_smw_lst:modules/Landsat_LST.js')
// link to the code that computes broad-band emissivity
var BBE = require('users/sofiaermida/landsat_smw_lst:modules/broadband_emiss.js')
// select region of interest, date range, and landsat satellite
var site = ee.Geometry.Point([-116.01947,36.62373]);
var geometry = site.buffer(30);
var date_start = '1982-08-01';
var date_end = '2022-06-30';
var use_ndvi = true;
// compute the LST for each Landsat
var L8coll = LandsatLST.collection('L8', date_start, date_end, geometry, use_ndvi);
var L7coll = LandsatLST.collection('L7', date_start, date_end, geometry, use_ndvi);
var L5coll = LandsatLST.collection('L5', date_start, date_end, geometry, use_ndvi);
var L4coll = LandsatLST.collection('L4', date_start, date_end, geometry, use_ndvi);
// compute broadband emissivity
L8coll = L8coll.map(BBE.addBand(true))
L7coll = L7coll.map(BBE.addBand(true))
L5coll = L5coll.map(BBE.addBand(true))
L4coll = L4coll.map(BBE.addBand(true))
// get bands for each landsat in one collection
var getband = function(landsat, bandname){
var wrap = function(image){
return image.select(bandname).rename(bandname.concat('_').concat(landsat))
}
return wrap
}
// merge all Landsat LST collections for the chart
var bandname = 'LST'
var LandsatColl = L8coll.map(getband('L8',bandname));
LandsatColl = LandsatColl.merge(L7coll.map(getband('L7',bandname)));
LandsatColl = LandsatColl.merge(L5coll.map(getband('L5',bandname)));
LandsatColl = LandsatColl.merge(L4coll.map(getband('L4',bandname)));
var TimeSeries = ui.Chart.image.series(
LandsatColl, geometry, ee.Reducer.mean(), 30, 'system:time_start')
.setChartType('ScatterChart')
.setOptions({
vAxis: {title: bandname},
lineWidth: 1,
pointSize: 4
});
print(TimeSeries)
// uncomment and edit the code below to export timeseries to your drive
/*
var myFeatures = ee.FeatureCollection(L8coll.map(function(image){
var date = ee.Date(image.get('system:time_start'));
var lst = image.select('LST')
var em = image.select('EM')
var fvc = image.select('FVC')
var tpw = image.select('TPW')
var bbe = image.select('BBE')
return ee.Feature(site, {
'year':ee.Number(date.get('year')),
'month':ee.Number(date.get('month')),
'day':ee.Number(date.get('day')),
'hour':ee.Number(date.get('hour')),
'minute':ee.Number(date.get('minute')),
'lst':ee.Number(lst.reduceRegion(
ee.Reducer.mean(),geometry,30).get('LST')),
'tpw':ee.Number(tpw.reduceRegion(
ee.Reducer.mean(),geometry,30).get('TPW')),
'em':ee.Number(em.reduceRegion(
ee.Reducer.mean(),geometry,30).get('EM')),
'fvc':ee.Number(fvc.reduceRegion(
ee.Reducer.mean(),geometry,30).get('FVC')),
'bbe':ee.Number(bbe.reduceRegion(
ee.Reducer.mean(),geometry,30).get('BBE'))
});
}));
Export.table.toDrive({
collection: myFeatures,
description: 'MyTask',
folder: 'MyFolder',
fileNamePrefix: 'Landsat8_LST_timeseries',
fileFormat: 'CSV'
});
*/

【声明】本内容来自华为云开发者社区博主,不代表华为云及华为云开发者社区的观点和立场。转载时必须标注文章的来源(华为云社区)、文章链接、文章作者等基本信息,否则作者和本社区有权追究责任。如果您发现本社区中有涉嫌抄袭的内容,欢迎发送邮件进行举报,并提供相关证据,一经查实,本社区将立刻删除涉嫌侵权内容,举报邮箱:
cloudbbs@huaweicloud.com


评论(0)