【ModelArts Course1】Using Auto Labeling for Food Data

ModelArts - Using Auto Labeling for Food Data
Model training requires a large amount of labeled data. Therefore, before training a model, label data. ModelArts provides you with the following labeling functions:
- Manual Labeling: allows you to manually label data.
- Auto Labeling: allows you to automatically label remaining data after a small amount of data is manually labeled.
- Team Labeling: allows you to perform collaborative labeling for a large amount of data.
This article will guide you through using the Auto Labeling function.
ModelArts provides the auto labeling function to quickly label data, reducing the labeling time by more than 70%. Auto labeling means learning and training are performed based on the labeled images and an existing model is used to quickly label the remaining images.
Only datasets of image classification and object detection types support the auto labeling function.
1 Data Preparation
1.1 Creating a Bucket
We need to create a dataset in ModelArts. When a dataset is created, the data is stored in OBS.
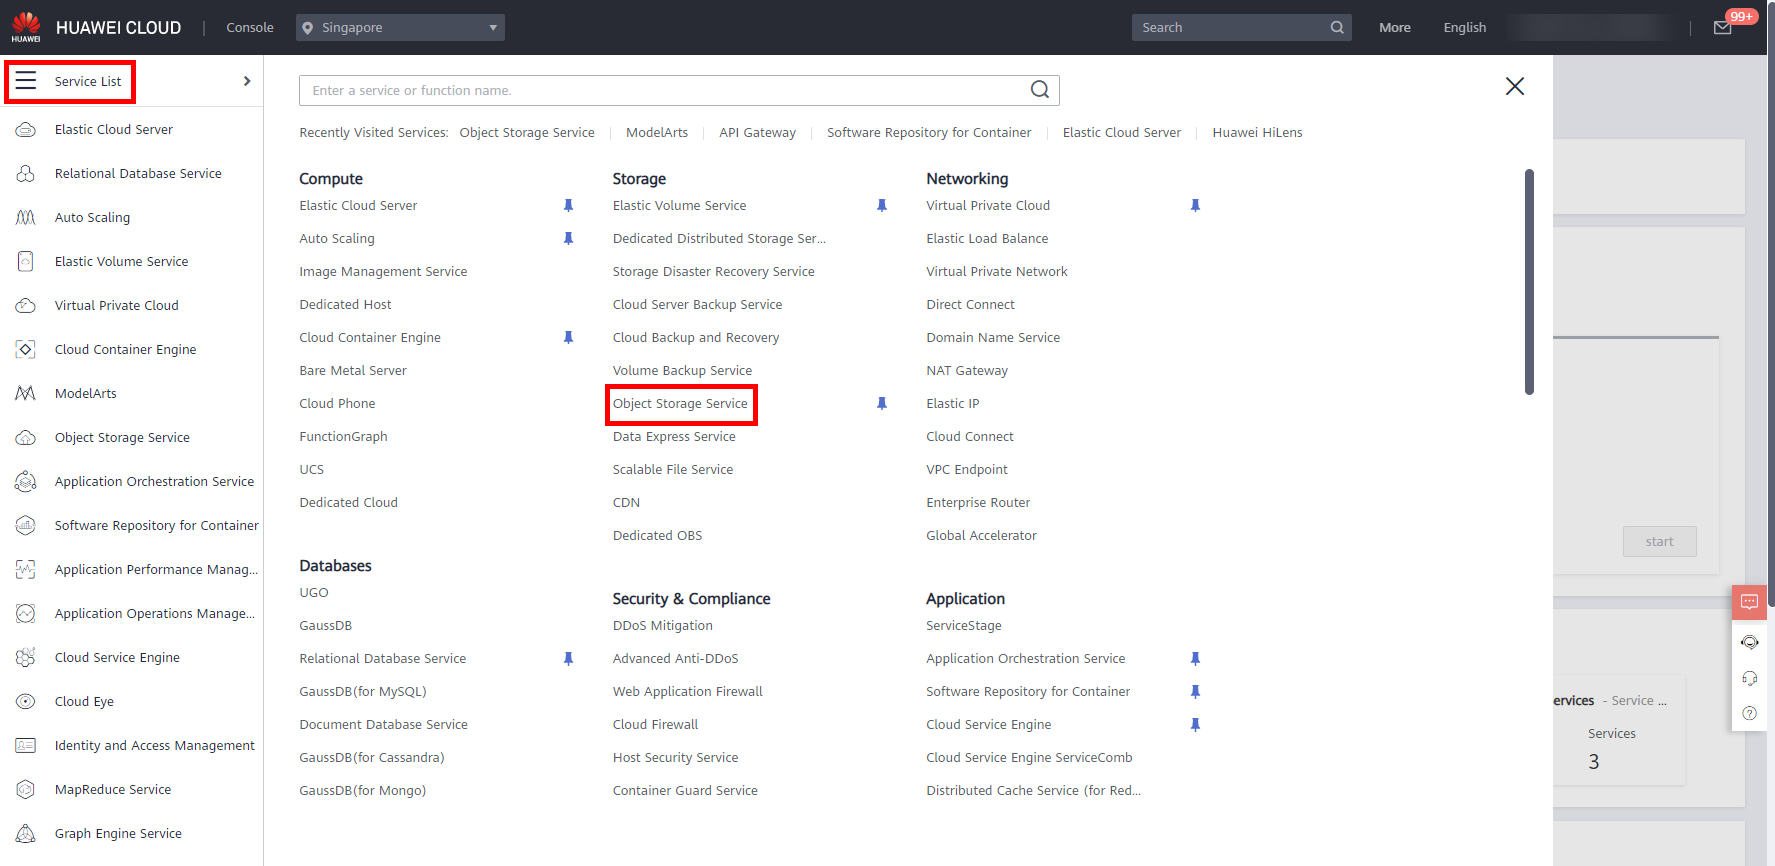
Log in to the HUAWEI CLOUD console, move the cursor to the left navigation bar, and in the pop-up menu bar,click Service List > Storage > Object Storage Service, as shown below.
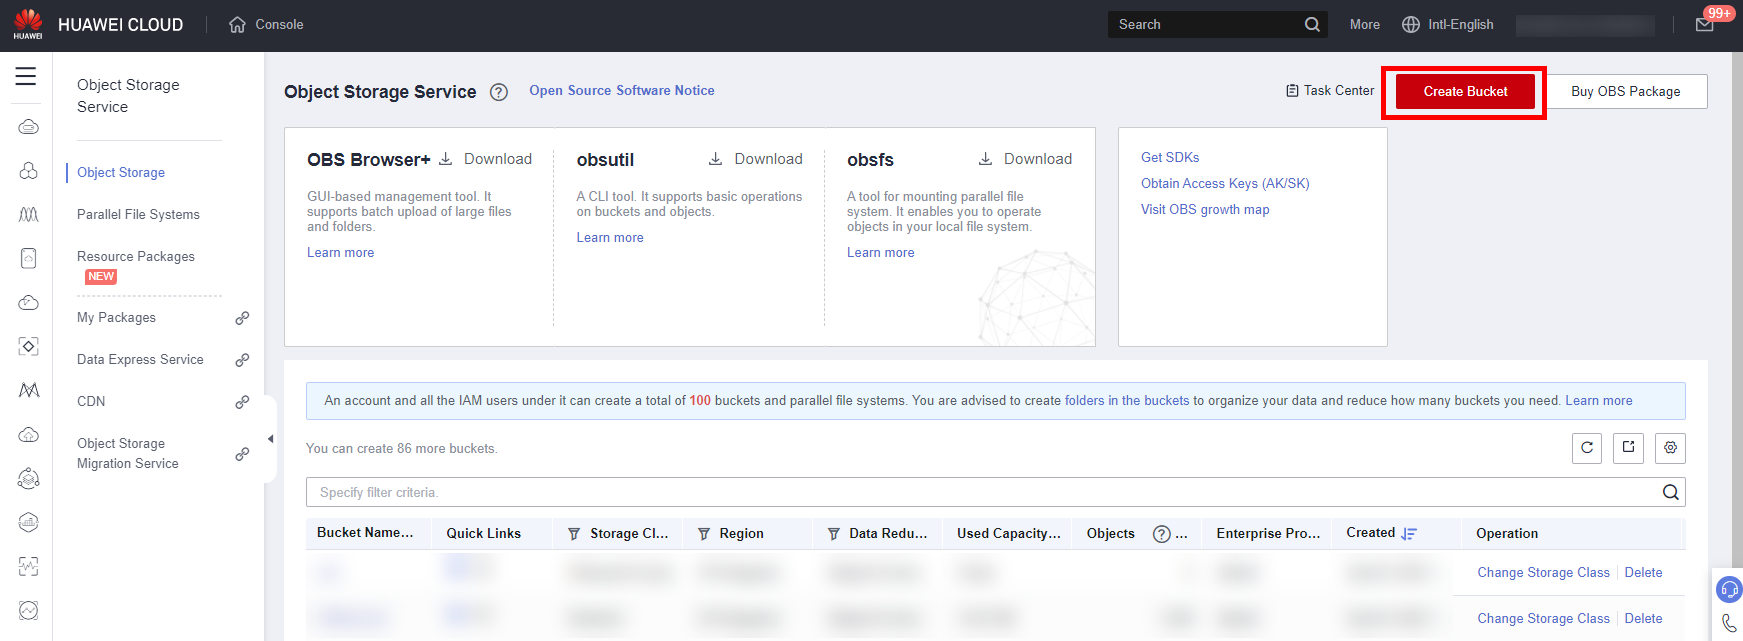
Click Create Bucket to access the creation page.
Now let’s start creating the OBS bucket, with the following parameters:
● Region: AP-Singapore
● Bucket Name: user-defined, which will be used in subsequent steps.
● Data Redundancy Policy: Single-AZ storage
● Default Storage Class: Standard
● Bucket Policy: Private
● Default Encryption: Keep Default
Click Create Now > OK to complete the creation of the Bucket.
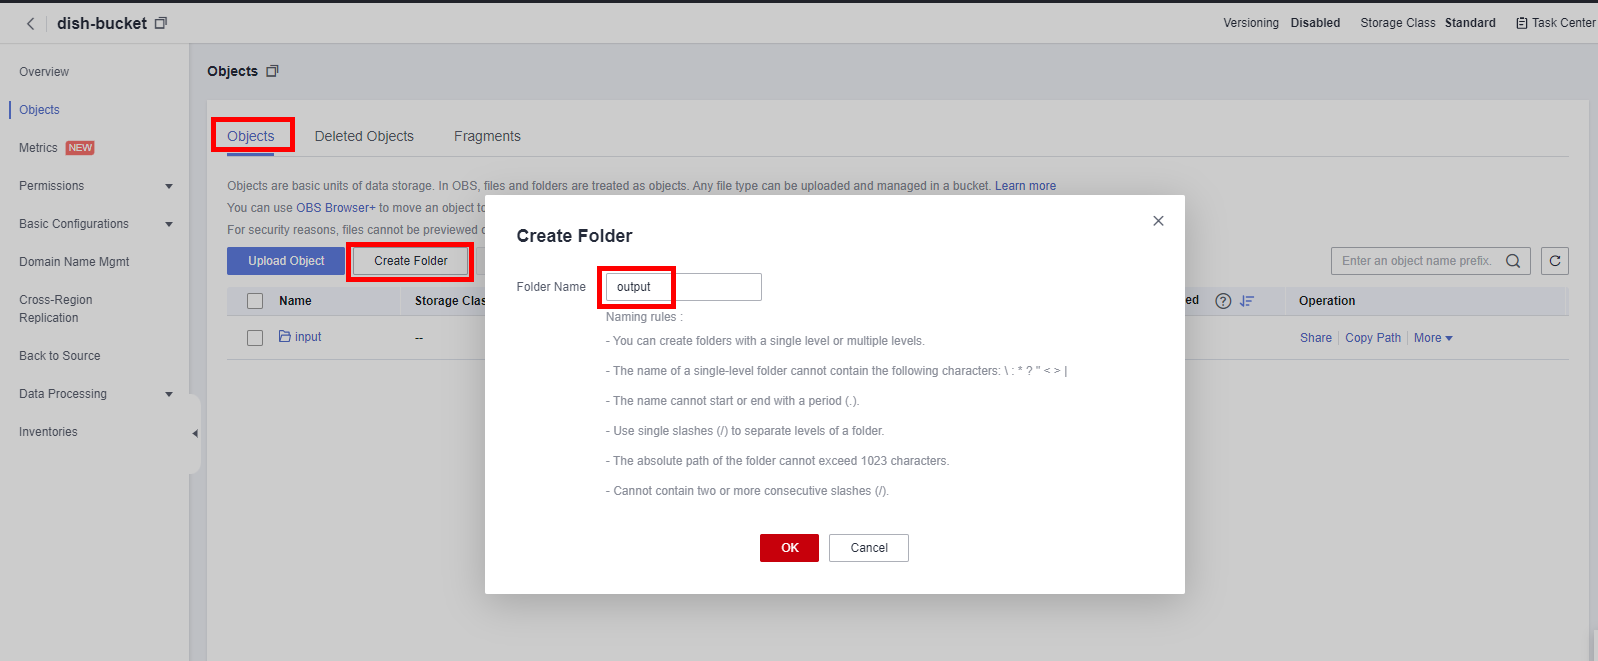
Click Bucket Name > Object > Create Folder to create two folders named input, output, which is used to store the input and output of subsequent dataset.
1.2 Update Data
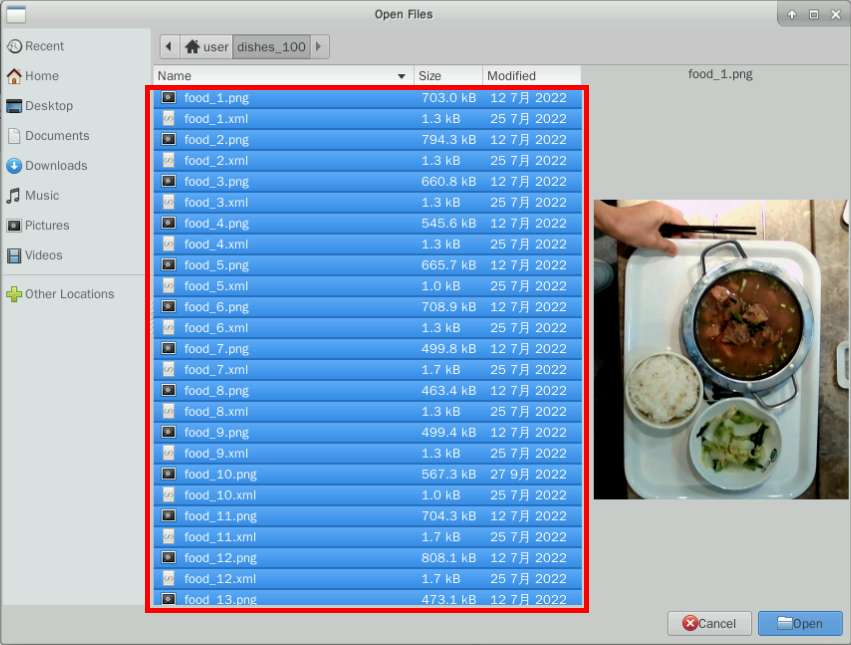
The experiment prepares a dataset of dish detection with only some images annotated. The dataset contains a variety of dish images, 100 files in total, and 10% of the images are annotated. You can download and unzip the dataset: dishes_100.
After downloading and unzipping the dish data, click into the input folder created in the bucket in the previous step. This folder is storage path for the original data, and will store the images and some of the label files.
Click Upload Object > add file to select the 100 dish data files (CTRL + A to select all), and then click Update.
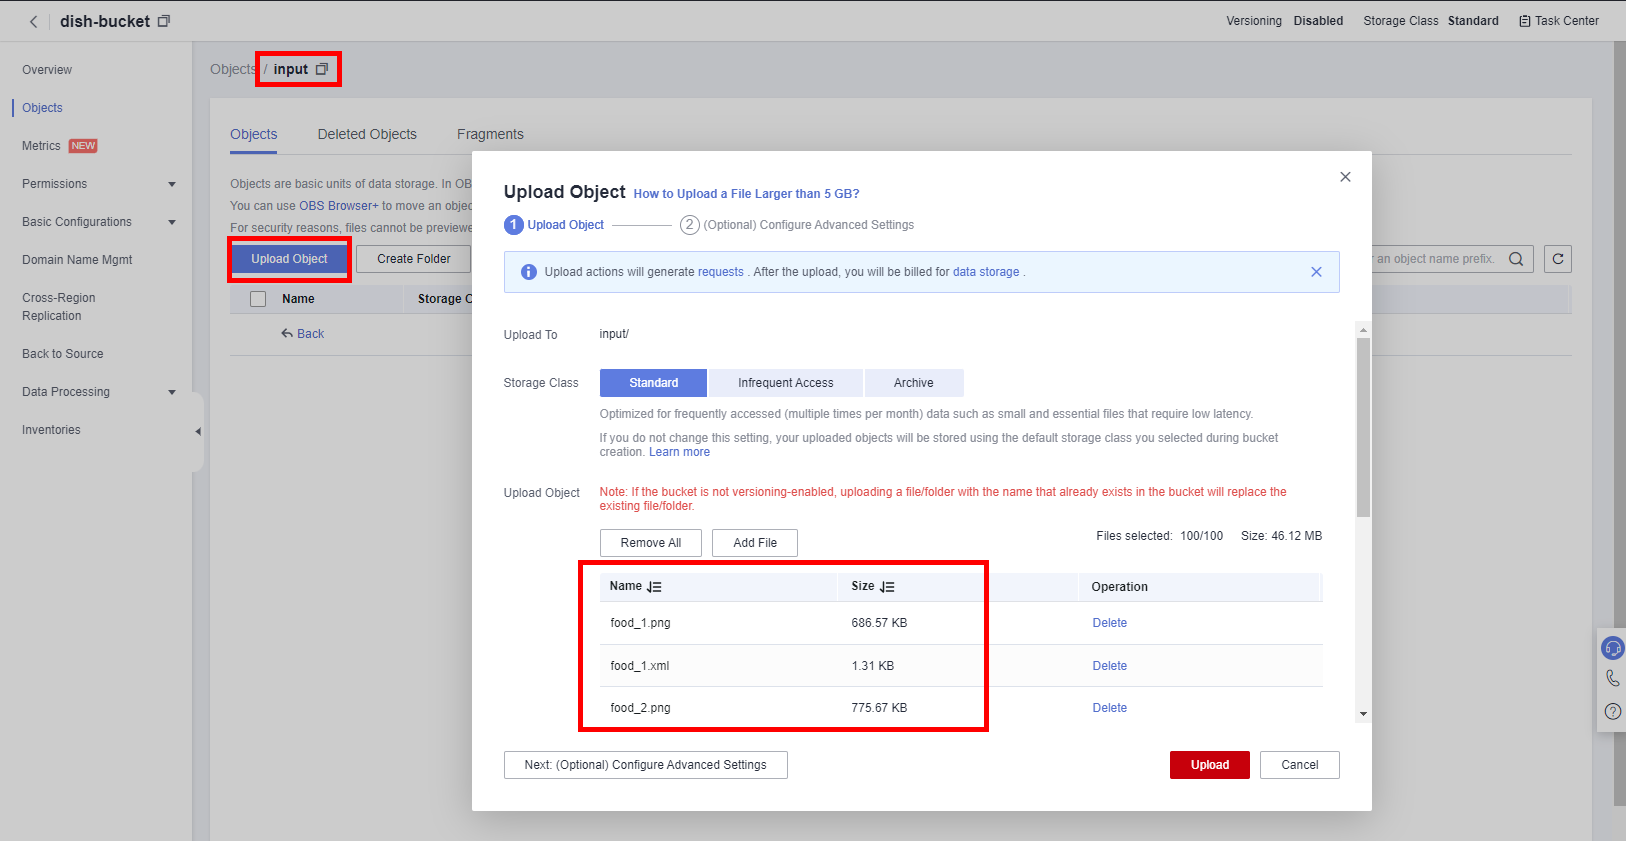
Click Task Center in the upper right corner to view the upload progress.
2 Create a Dataset
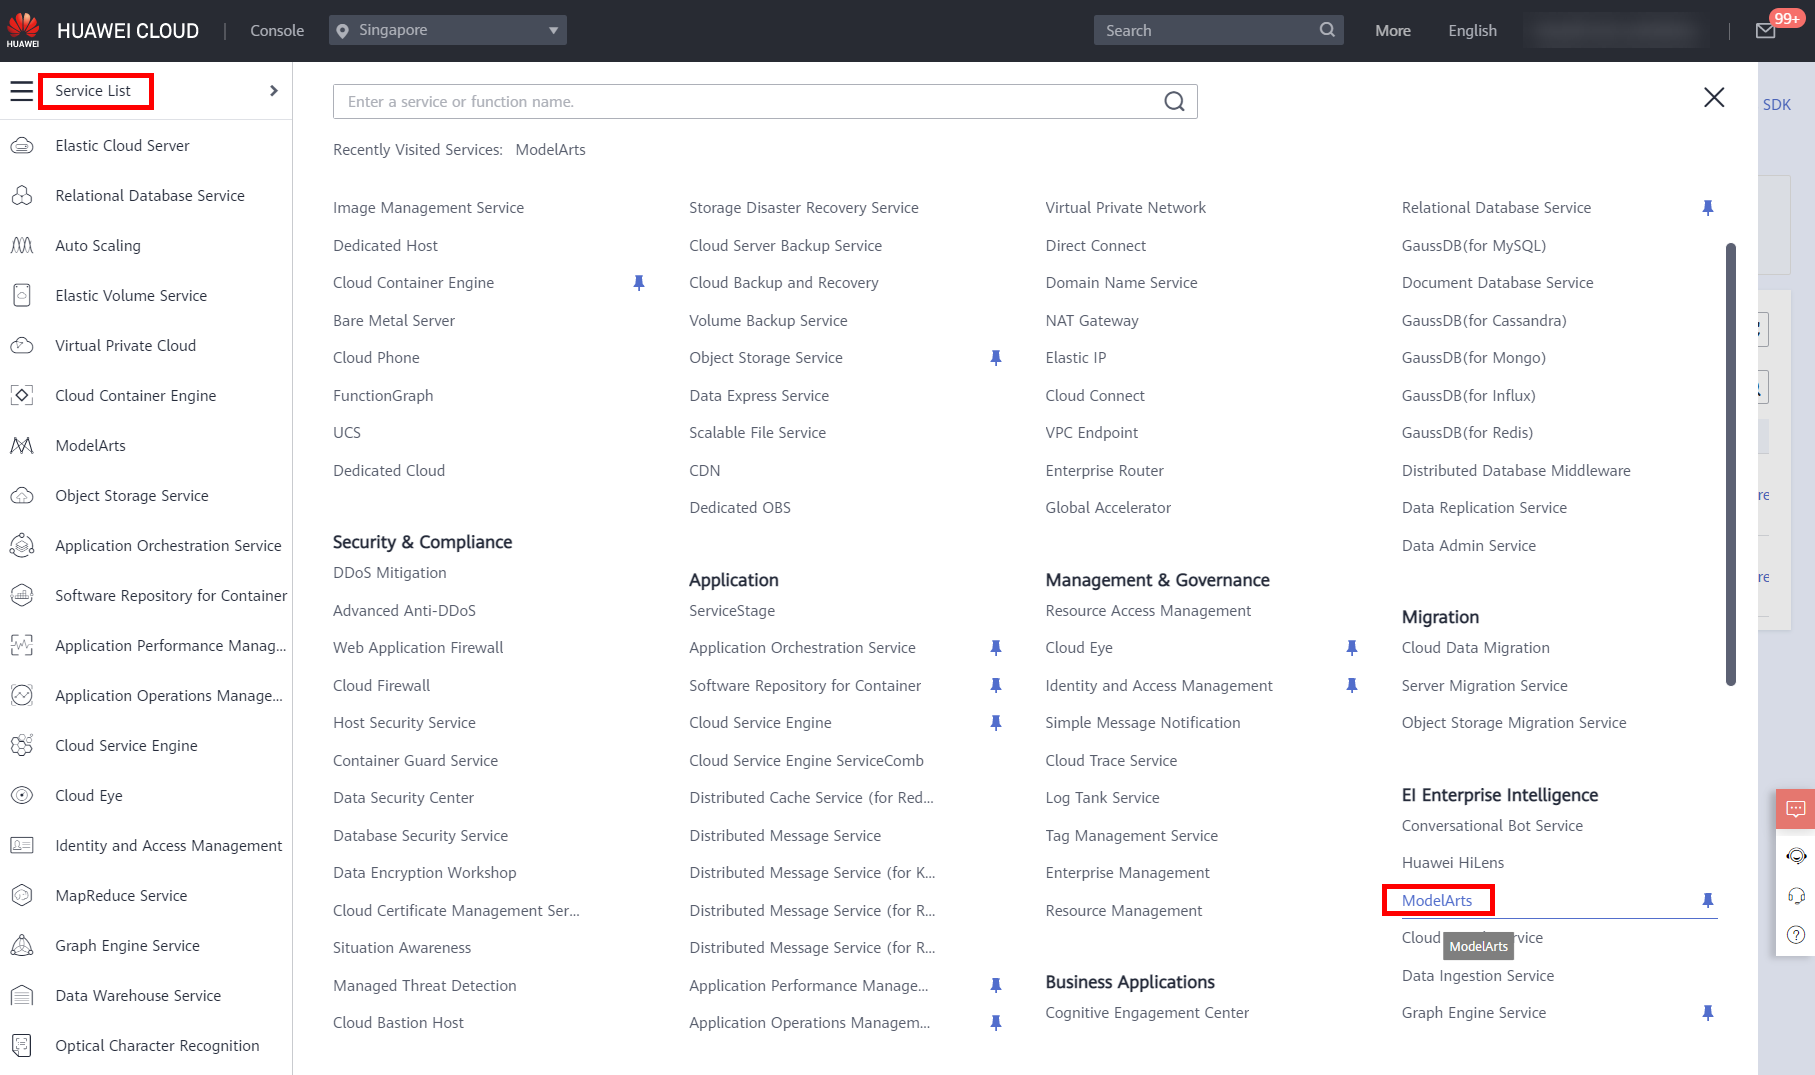
Move the cursor to the left navigation bar, and choose Service List > EI Enterprise Intelligence > ModelArts, as shown below.
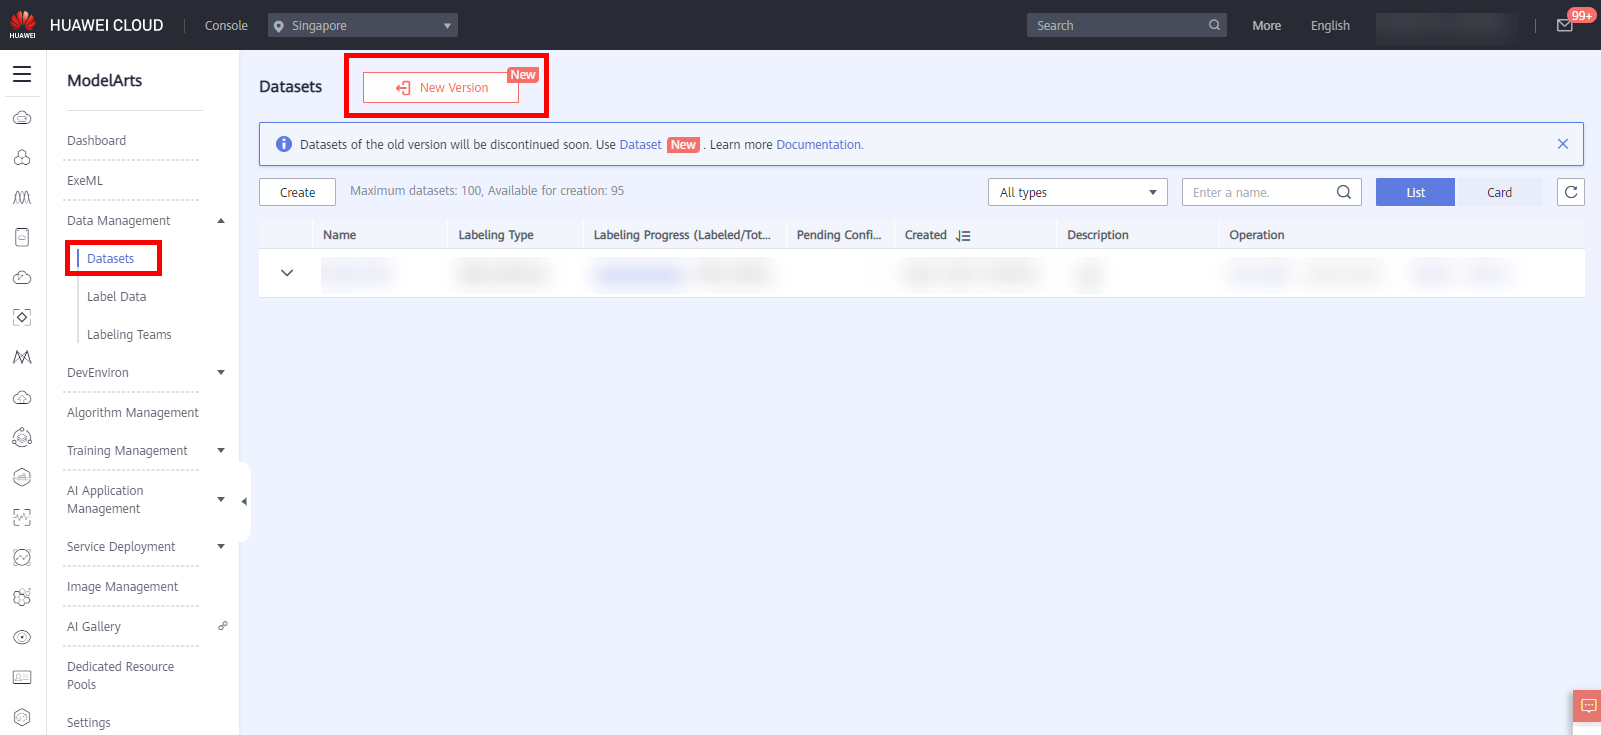
On the ModelArts management console, click Data Management > Datasets in the navigation bar on the left.The Datasets list page is displayed, click New Version to access the new version page, as shown below.
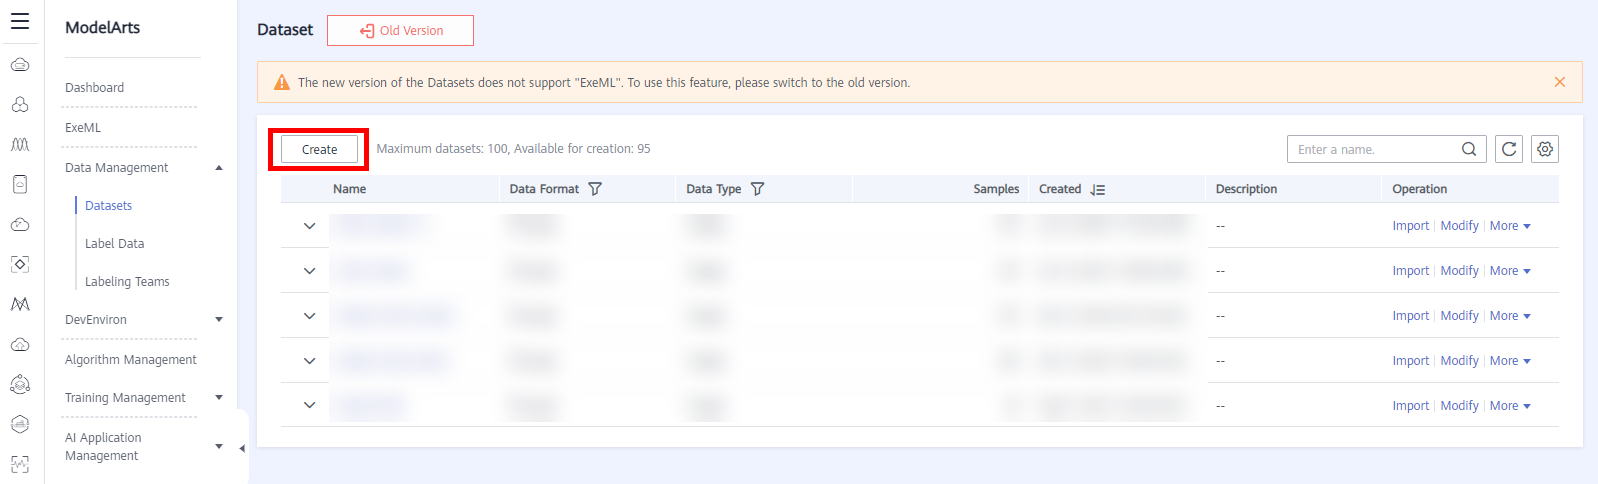
Click Create to access the page of Create Dataset, as shown below.
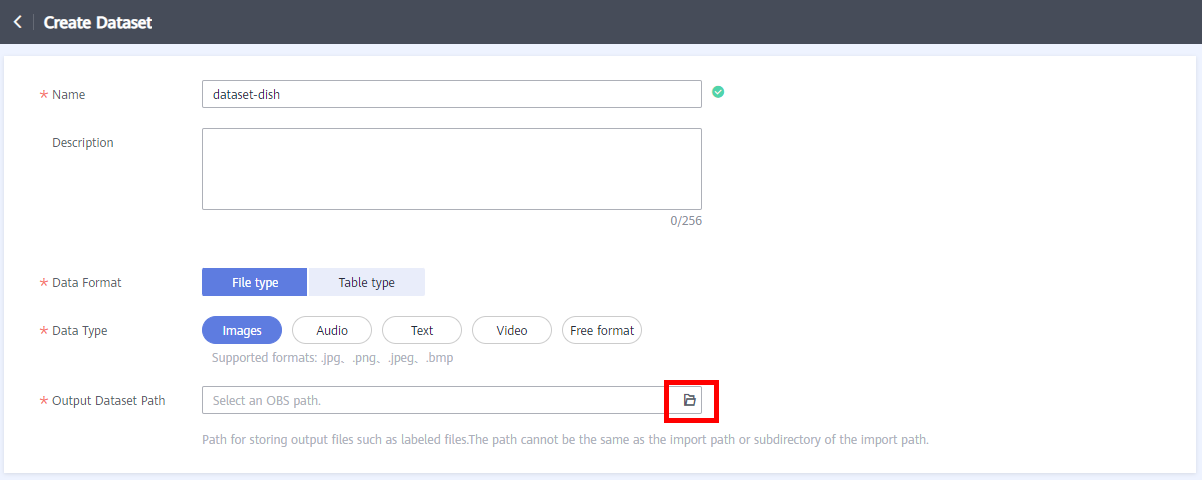
Configure dataset parameters. The configuration parameters are as follows:
● Name: dataset-dish
● Description: User-defined
● Data Format: File type
● Data Type: Images
● Output Dataset Path: Select the OBS path created in section 1.1
Click the folder icon in the red box shown in the following figure. The page for selecting an OBS path is displayed.
Select the created folder named output as the output storage path of the dataset, as shown below.
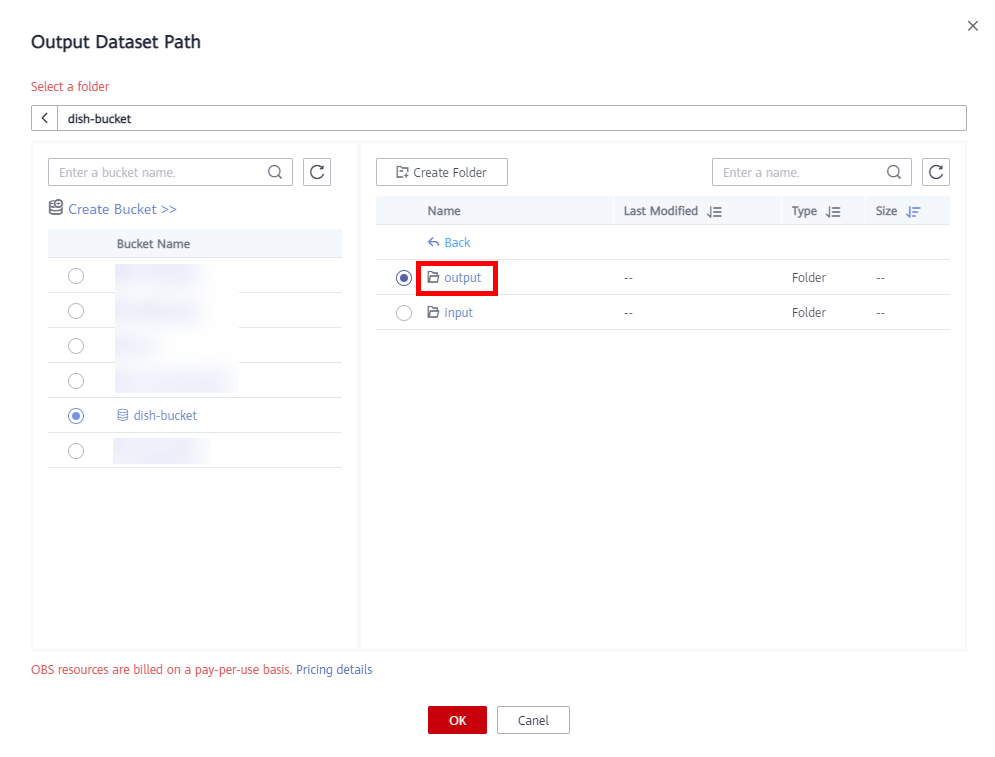
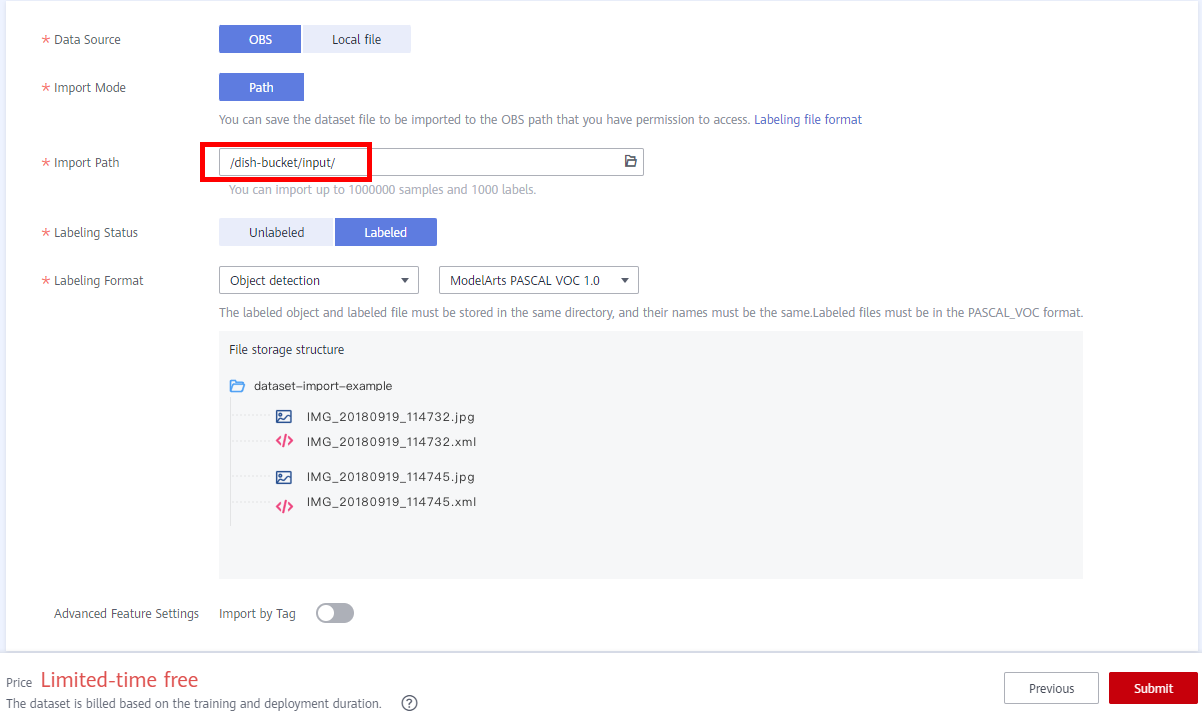
Click OK to complete the configuration of the dataset output path.Back to the Create Dataset page and click Next. The data import page is displayed. Configure Data Source to OBS, Import Mode to Directory, Import Path to the input folder created in the OBS bucket, and Data Labeling Status to Labeled, as shown in below.
Click Submit. The dataset list is displayed. You can view the created dataset. Click the triangle on the left of the dataset name to expand the dataset details and view the dataset import status. When the status changes to Import Completed, the dataset is ready.
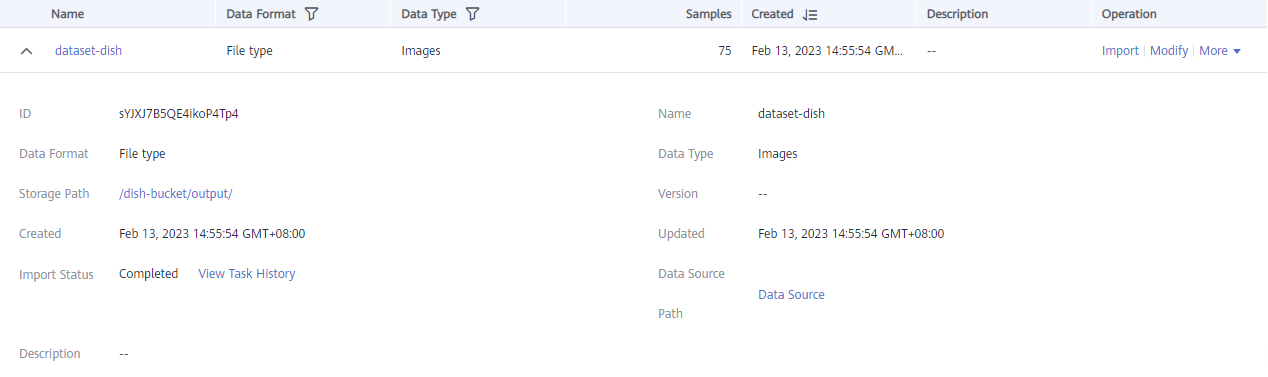
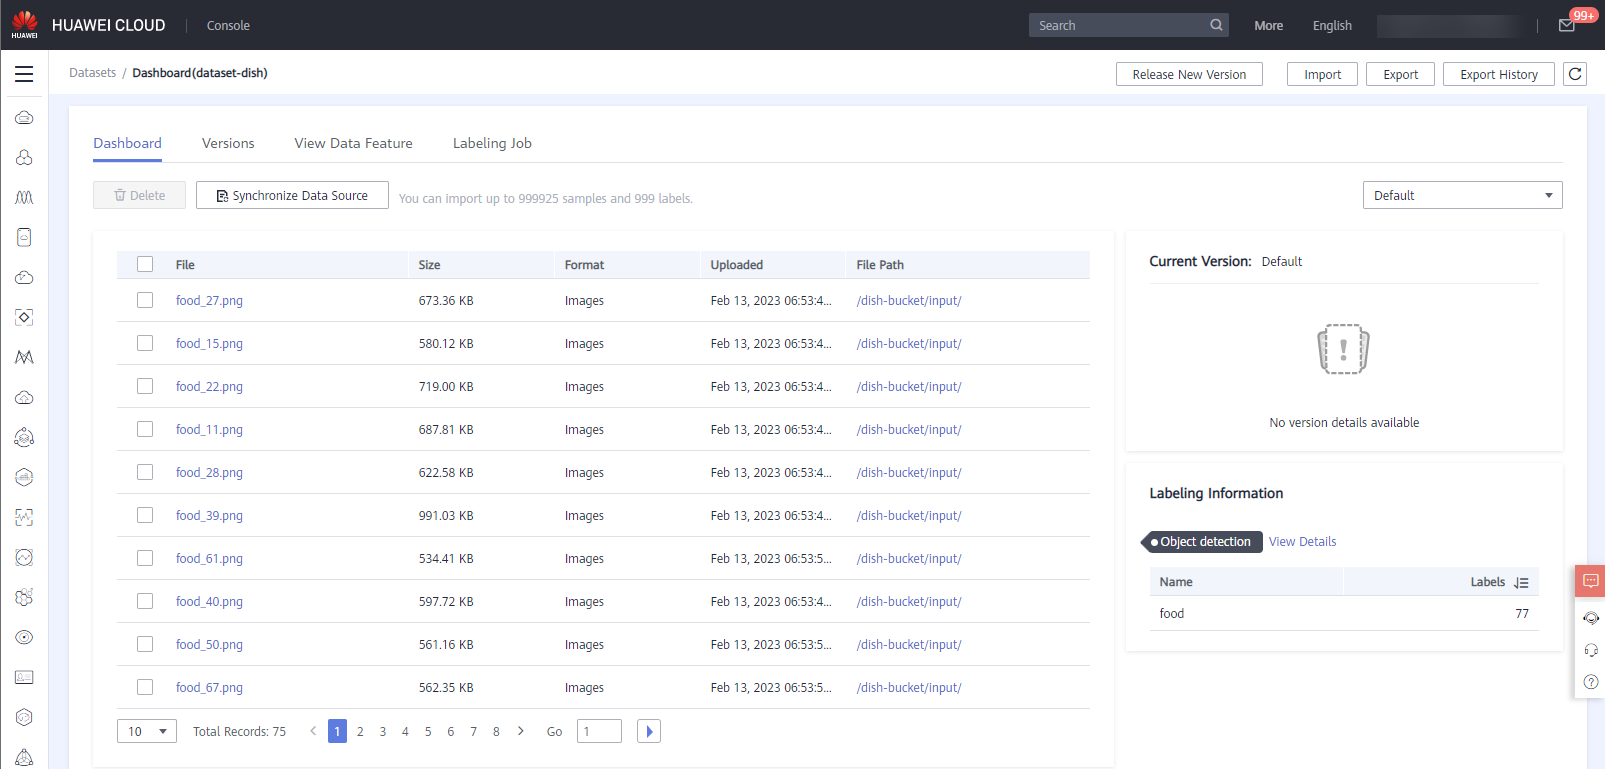
After the dataset is ready, click the name of the created dataset to access the dataset details page. The imported 75 dish data are displayed on the Dashboard page.
3 Create a Labeling Task
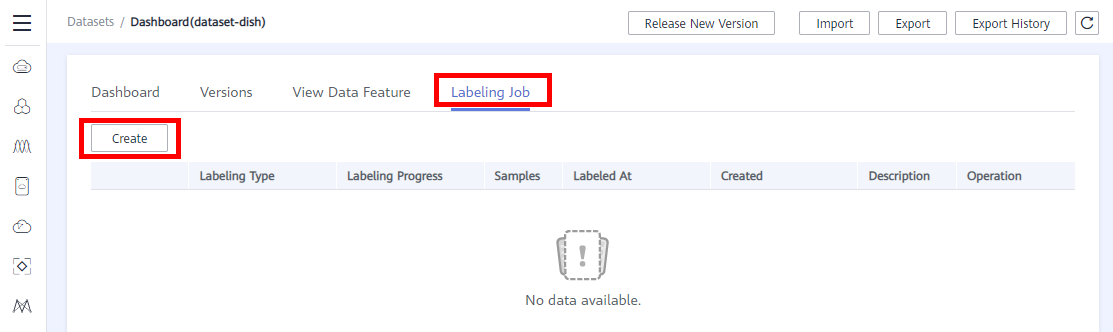
Switch to the Labeling Job tab and click Create. The page for creating a labeling job is displayed.
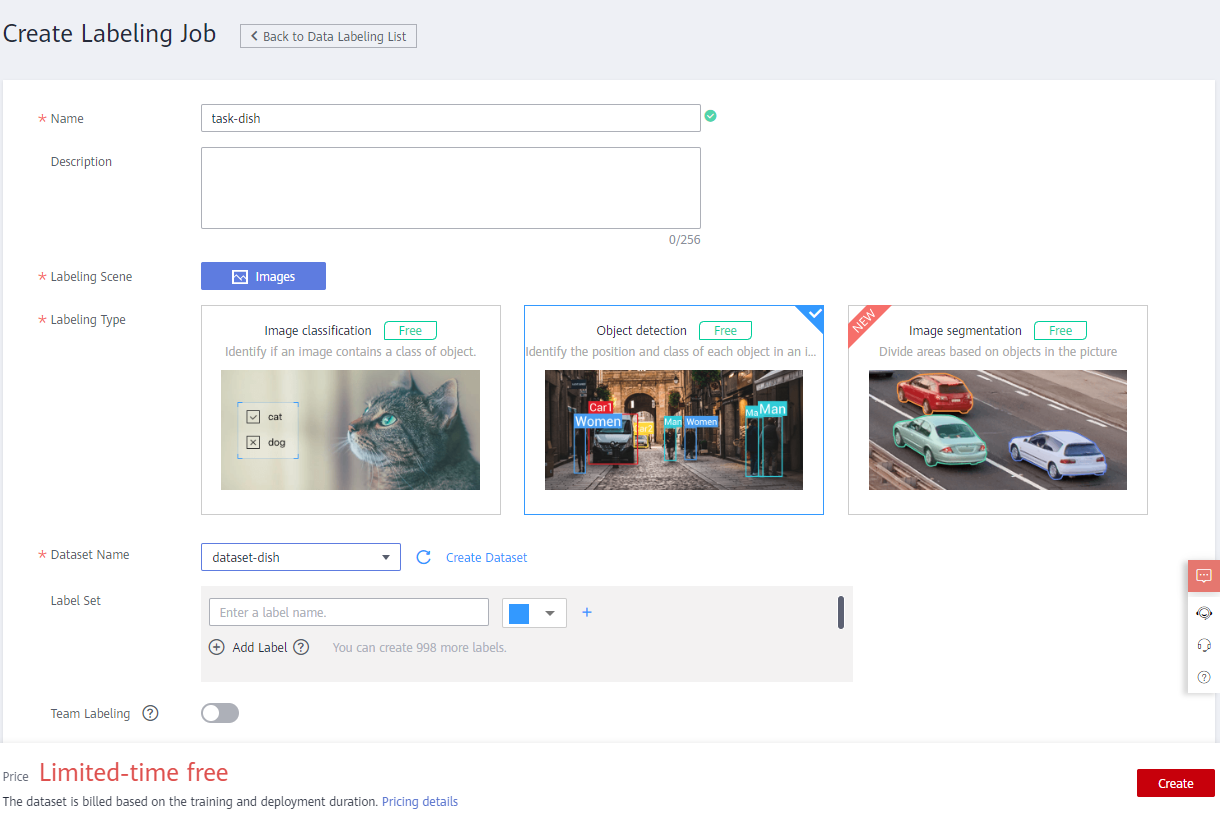
Configure the parameters as follows:
● Name: User-defined, for example, task-dish
● Description: User-defined
● Labeling Scene: Images
● Labeling Type: Object detection
● Dataset Name: Select the dataset created named dataset-dish in section 2 from the drop-down list box
Retain the default values for other options. And then click Create to create a labeling job. Wait until the labeling task is successfully created.
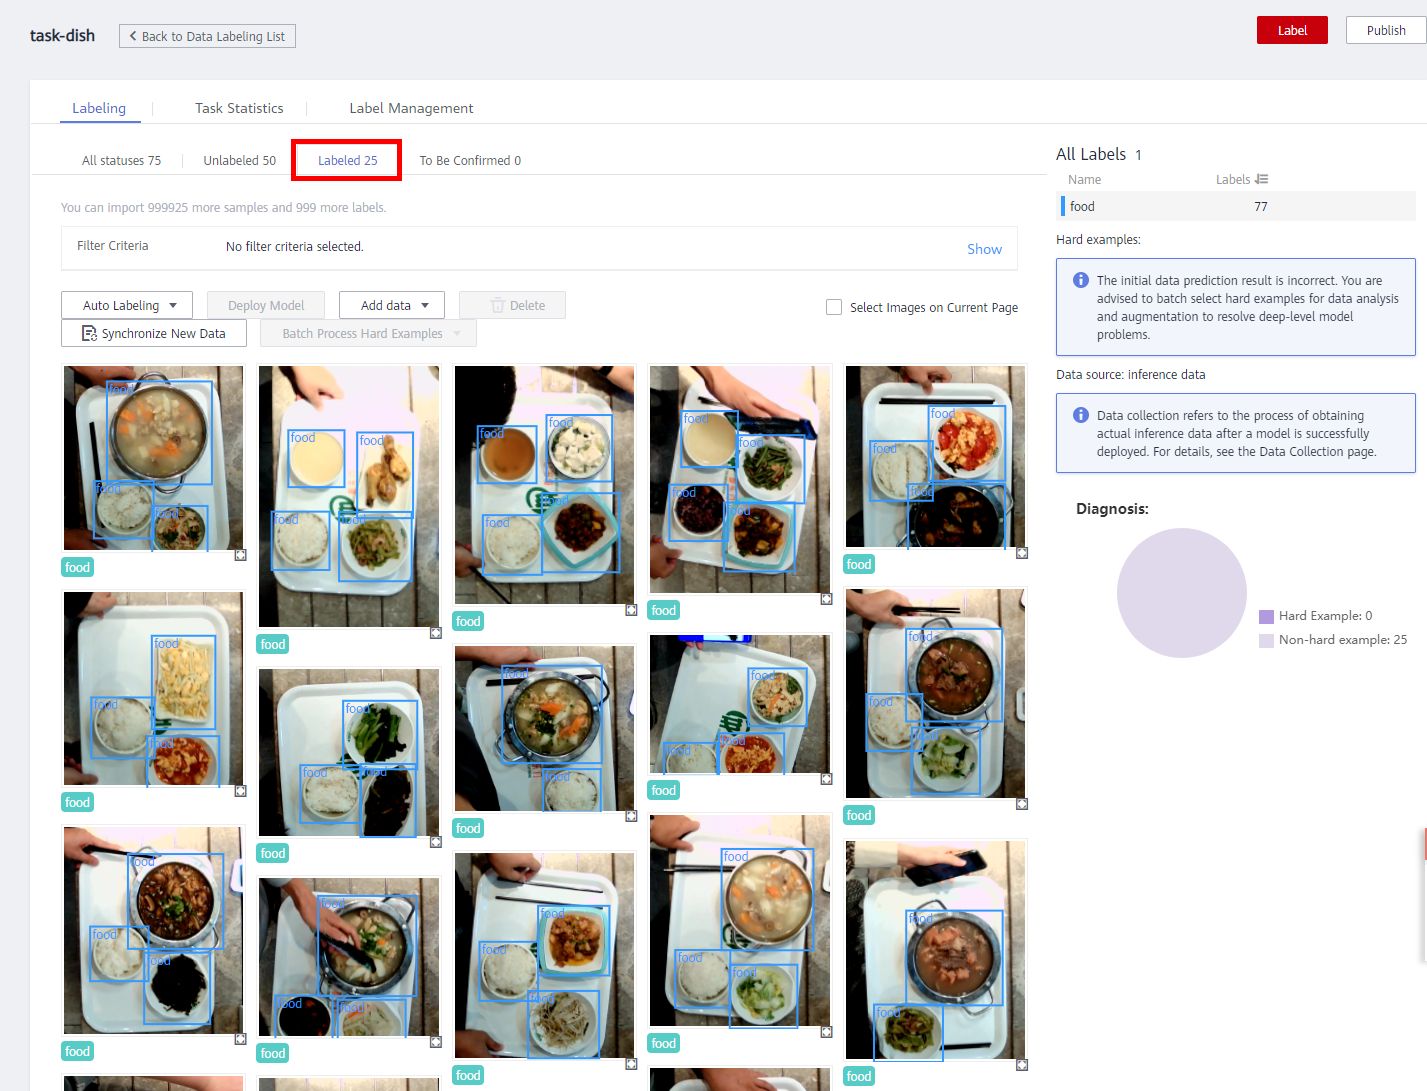
After the labeling task is successfully created, the data labeling list is displayed.
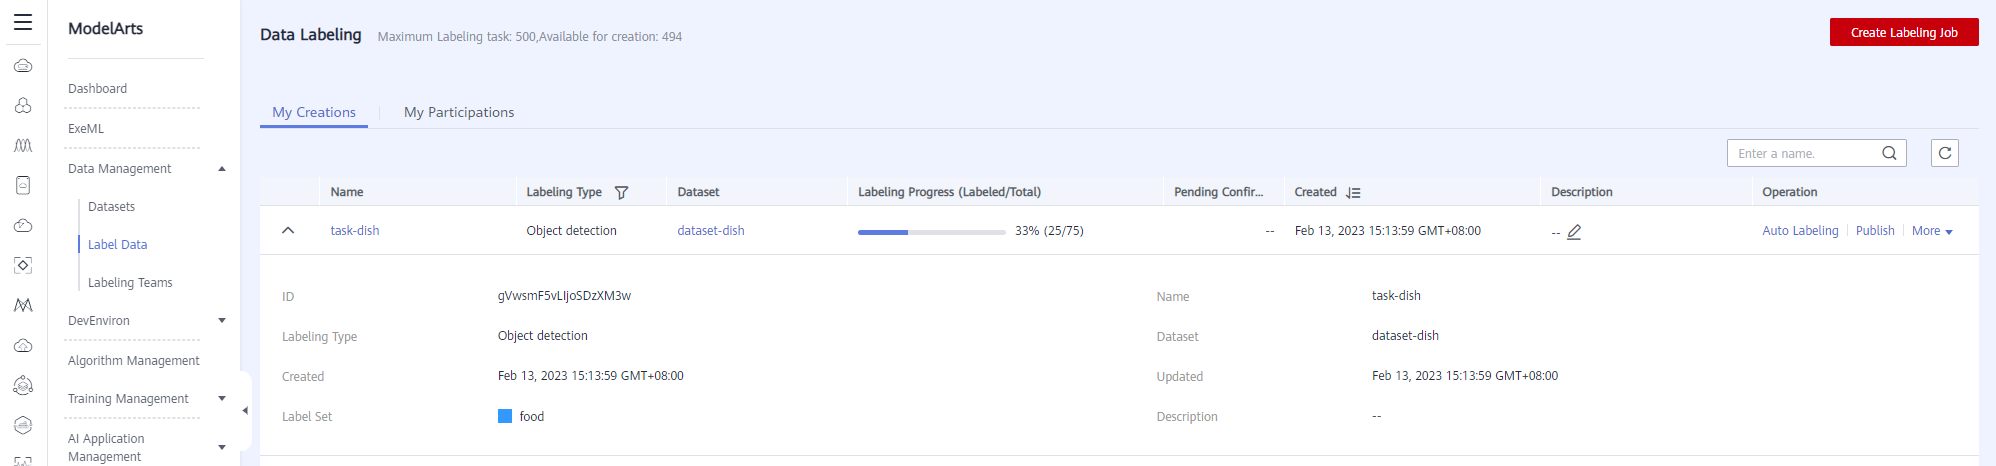
Click the labeling name. The data labeling page is displayed. The dish data has been labeled 1/3, that is, 25 dish images have been labeled. The labeled images will display the labeled information. You can switch to the Labeled page to view the labeled information.
ModelArts provides activate learning-based intelligent labeling that automatically selects the most informative data for labeler, thus reducing manual labeling workload.
With activate learning-based intelligent labeling, the labeler only needs to label a small amount of data as the training set to train the model at the beginning of the labeling task, and then uses the trained model to infer the unlabeled data.
The active learning strategy selects the data that needs to be manually labeled in the next epoch based on the inference result of the current epoch, and the labeler adds these data to the training set after labeling, and so on, until the model achieves the user’s requirements.
ModelArts active learning algorithms include the supervised and semi-supervised mode. The supervised algorithm uses only the data labeled by the user for training; While the semi-supervised algorithm uses both labeled and unlabeled data,which can improve the model accuracy but generally takes longer time.
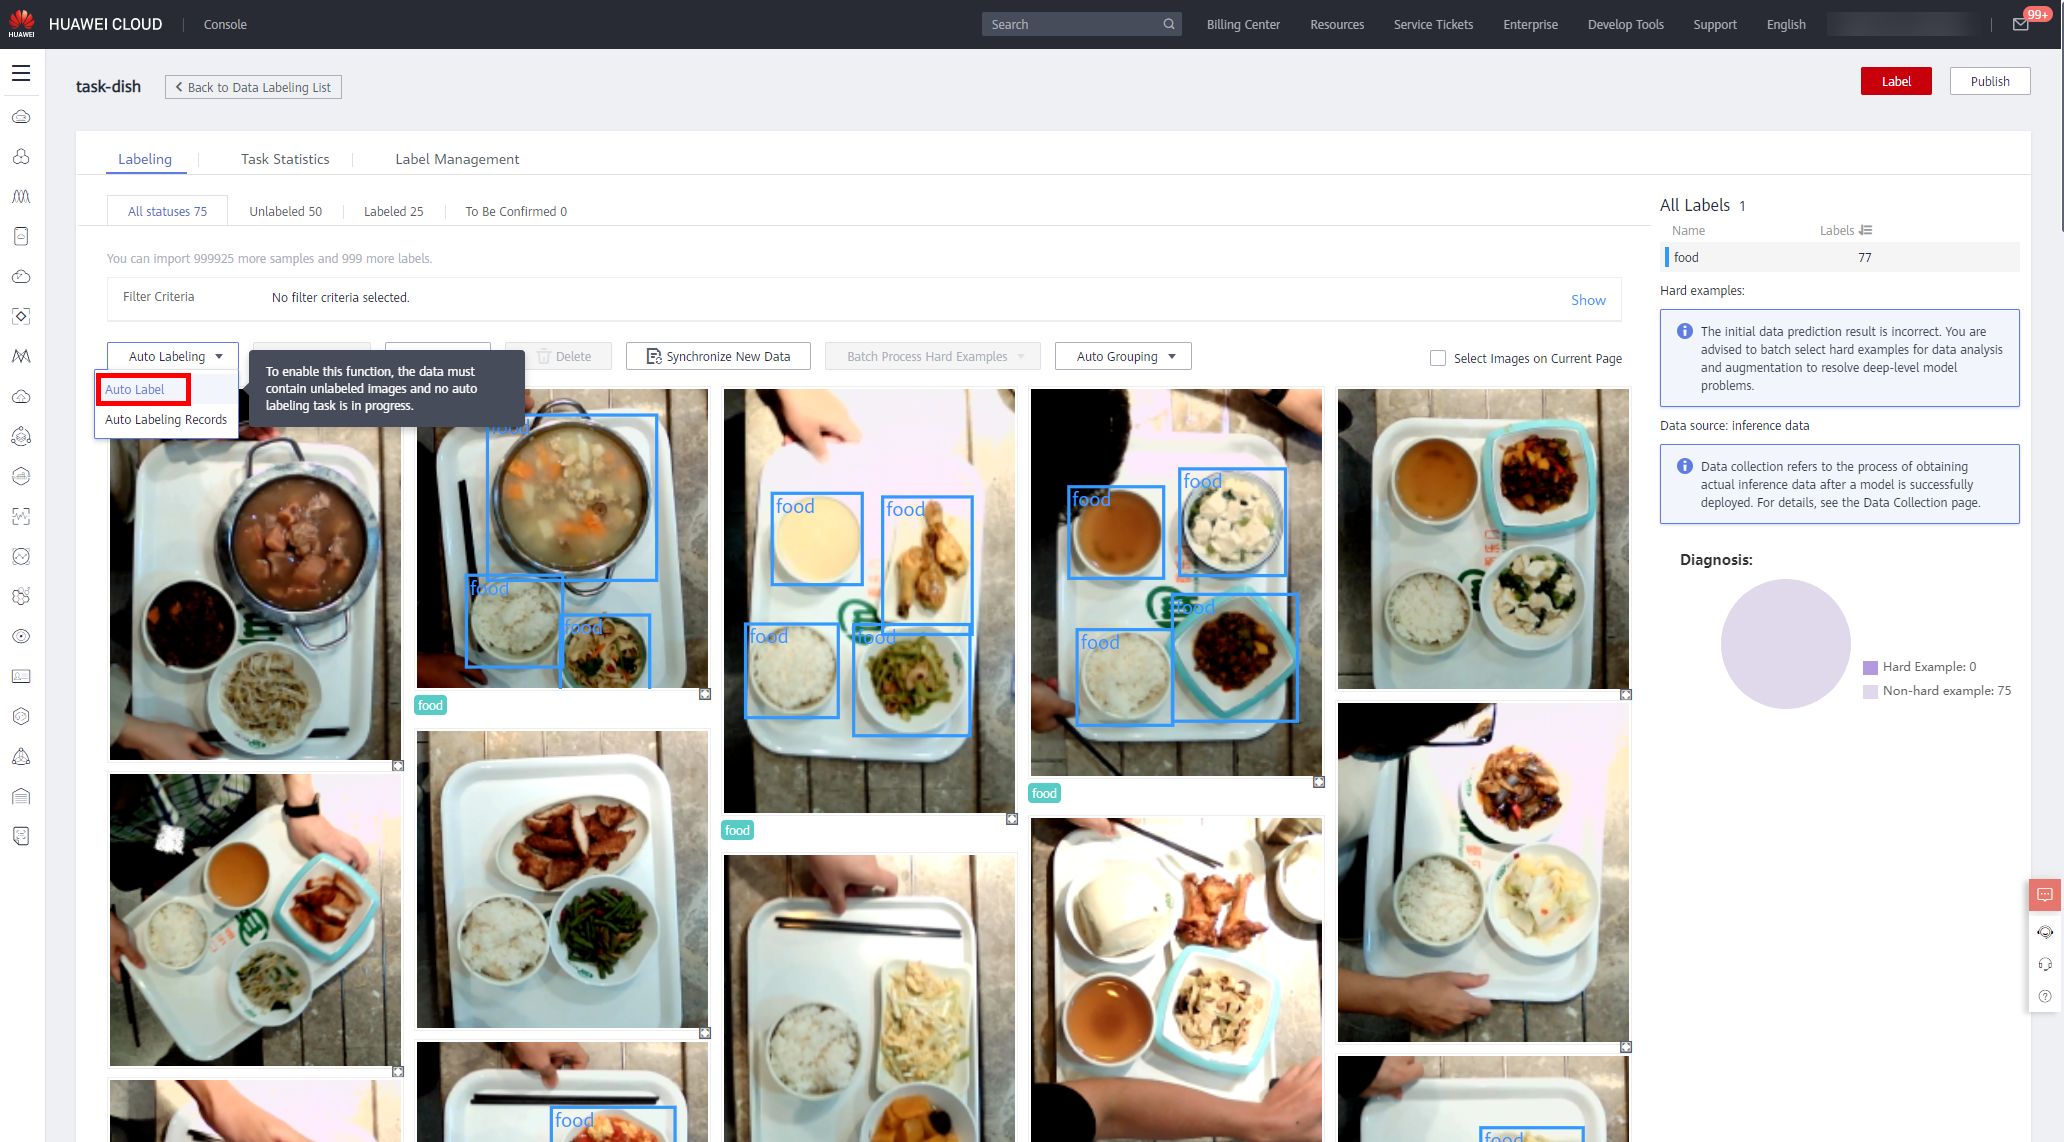
Based on the labeling data and image data training in the current labeling phase, the system performs intelligent labeling and quickly labels the remaining images.
Click Auto Labeling > Auto Label to configure with the following parameters.
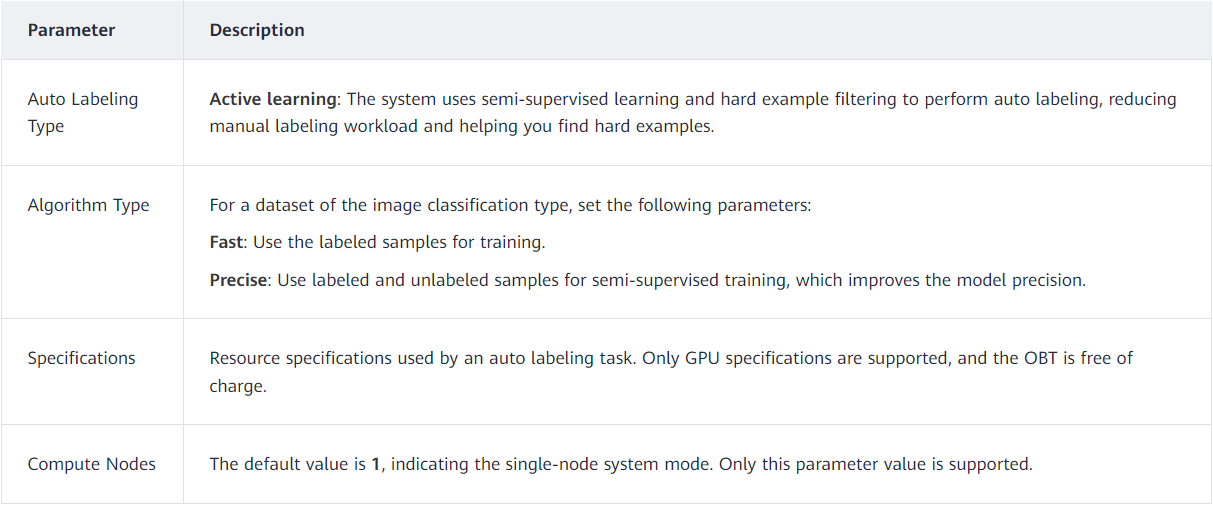
① Auto Labeling Type:Activate learning
② Algorithm Type:Fast
③ Specifications: GPU: 1*NVIDIA-V100-pice-32gb(32GB) | CPU: 8 vCPUs 64GB 780GB
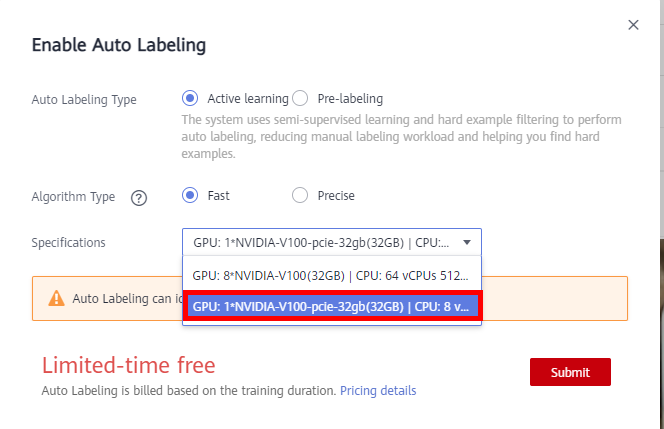
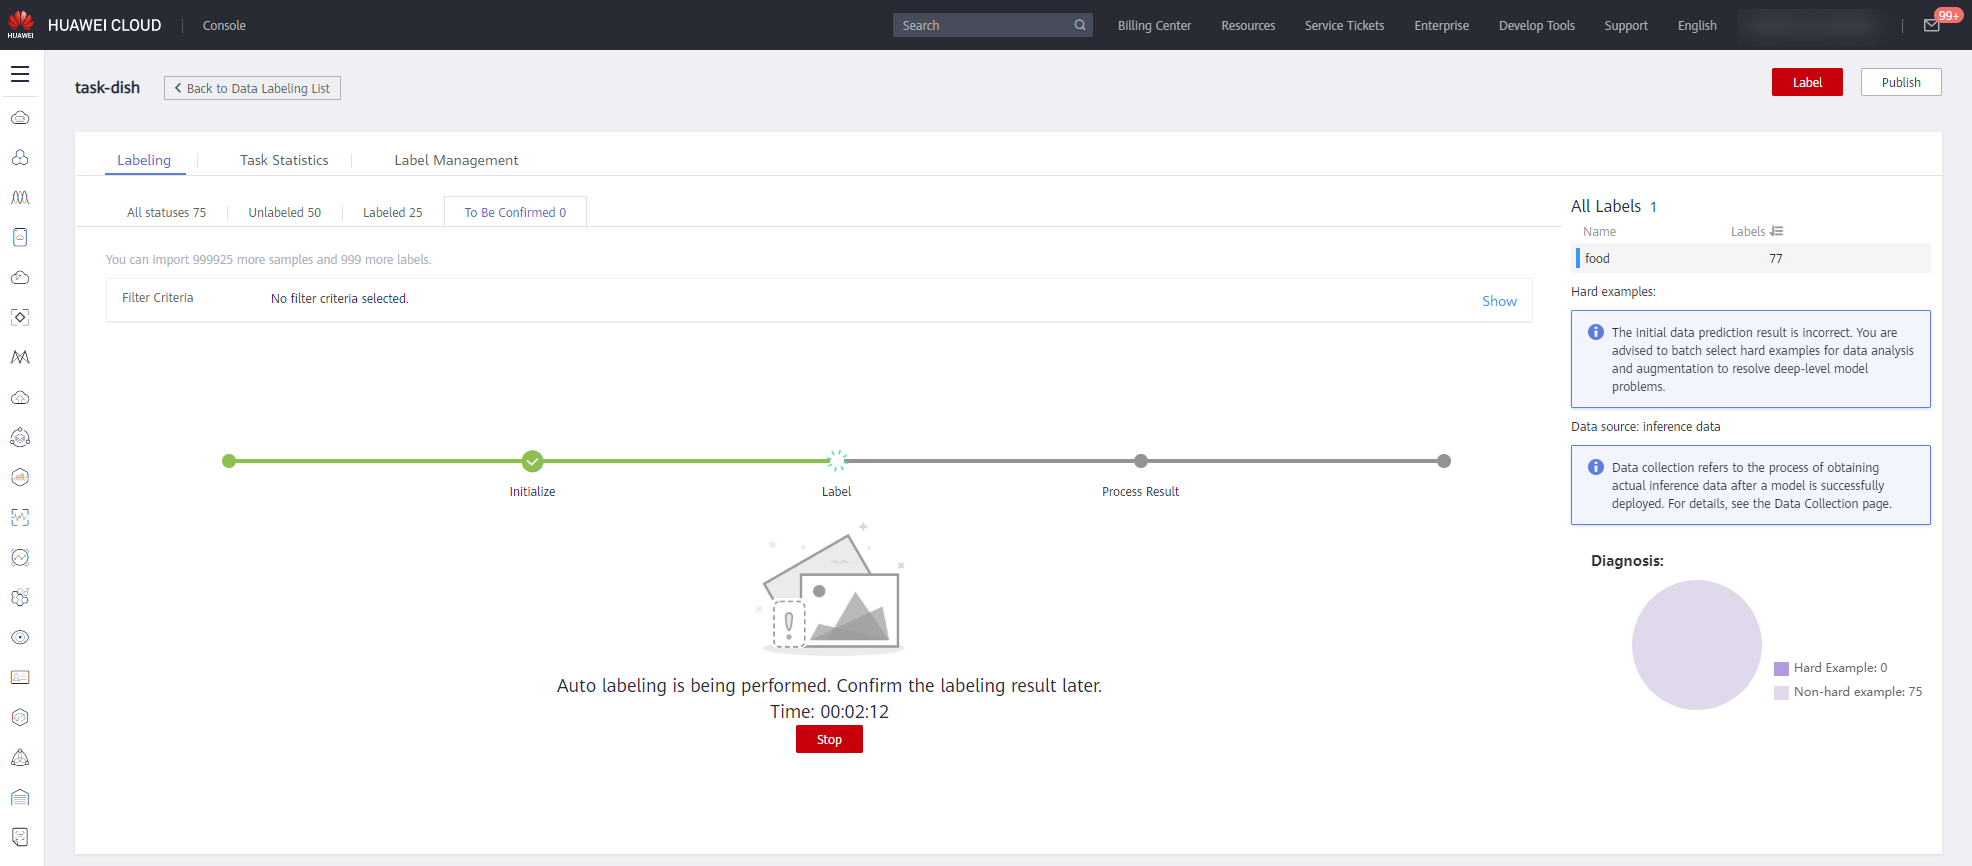
Then click Submit to start auto labeling. After that, you can view the task progress on the To Be Confirmed page。 It will take about 5 minutes(Fast Auto labeling). The more data, the longer the task runs, please be paient.
When the task is completed, you can view the automatically labeled image data on the To Be Confirmed tab page.
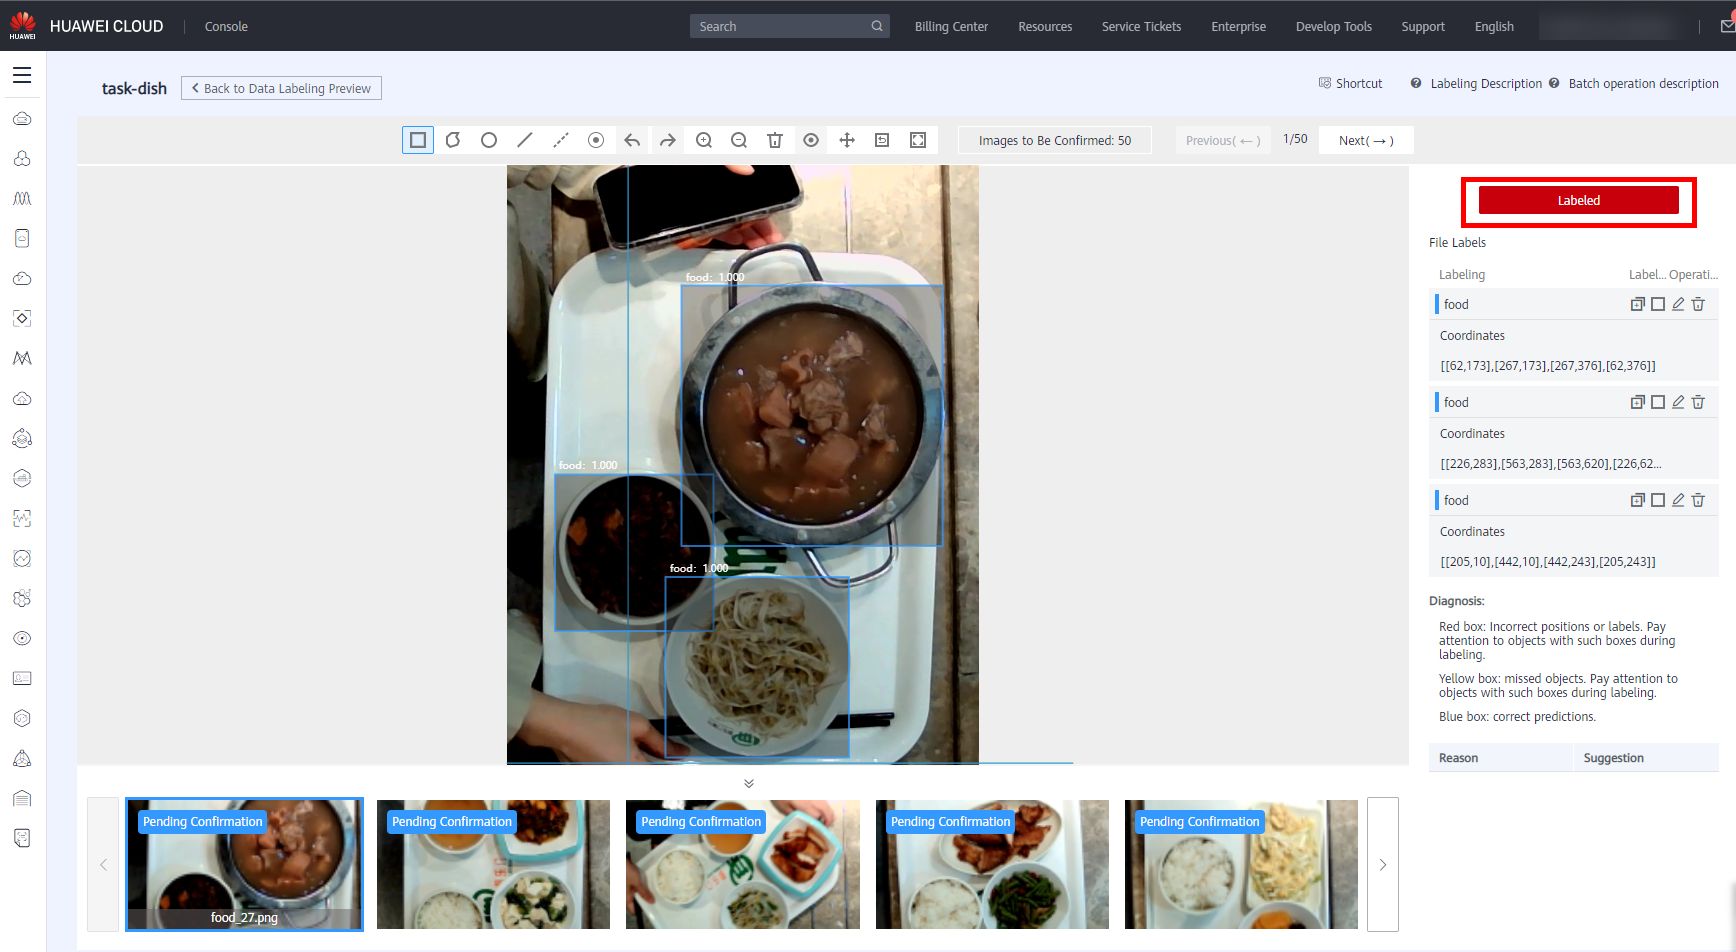
After the auto labeling task is complete, click the image on the To Be Confirmed tab page to go to the labeling details page and view or modify the auto labeling result.If the label data is correct, click Labeled on the right. If not, select the labeling box to modify the coordinates, or delete the incorrect labeling box and relabel manually the data.
Confirm the object detection task one by one. As shown in the following figure, confirm the results and ensure that all images are confirmed. Then, proceed to the next step.
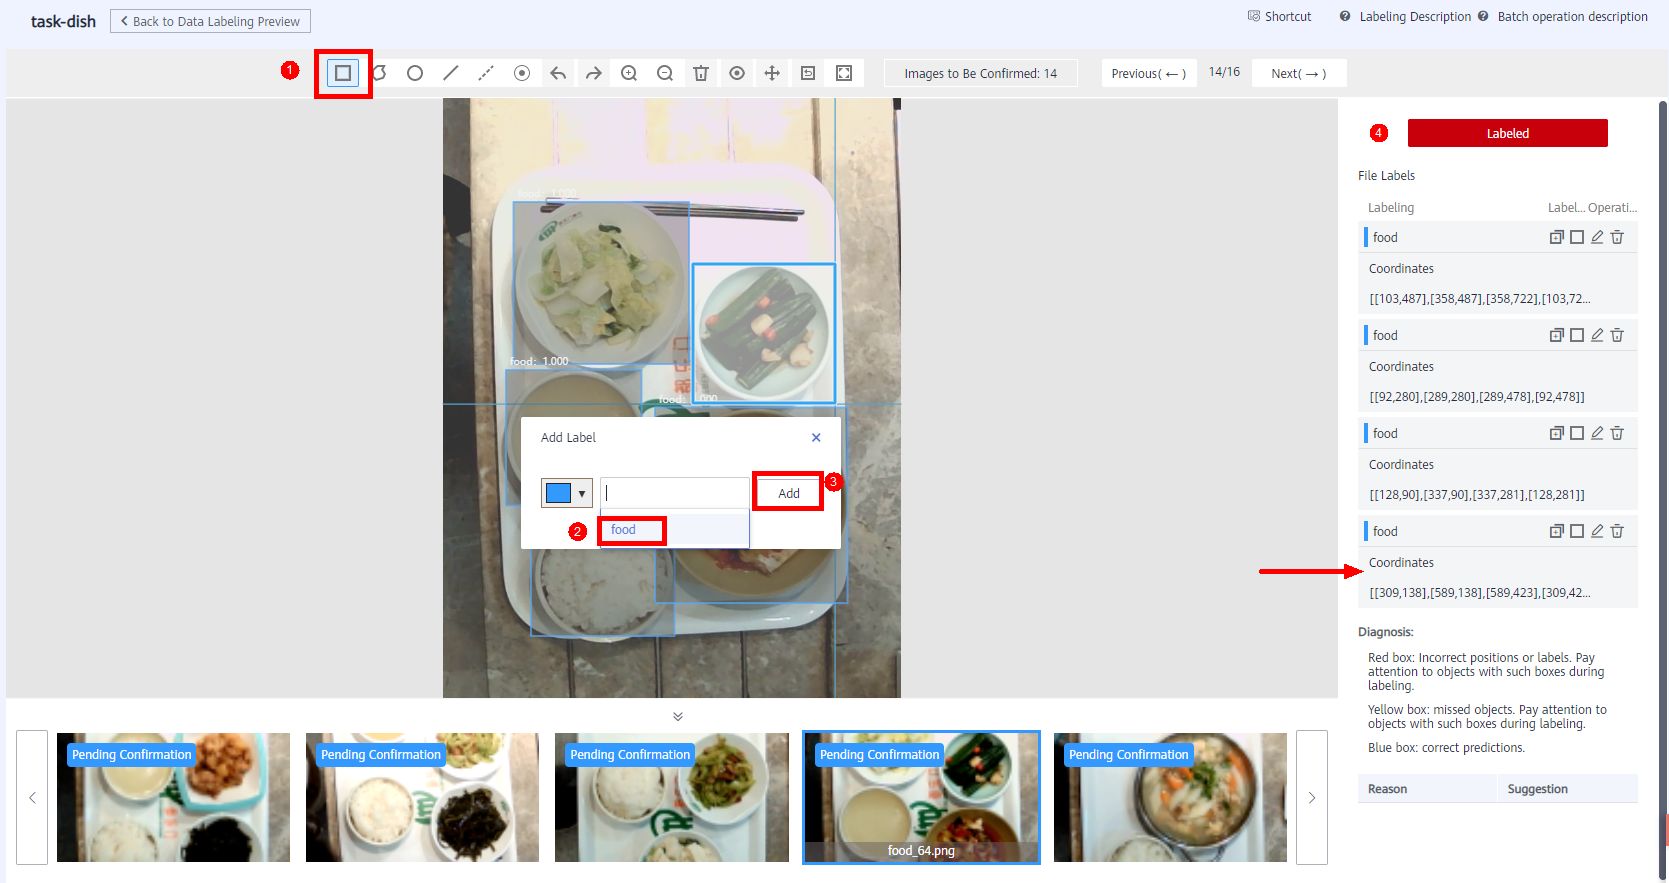
If some images do not identify the detection object, manually label the images. Click the rectangle button, label the box of the dish, and select the food label, then click Add, the dish information display on the right bar. As shown in below.
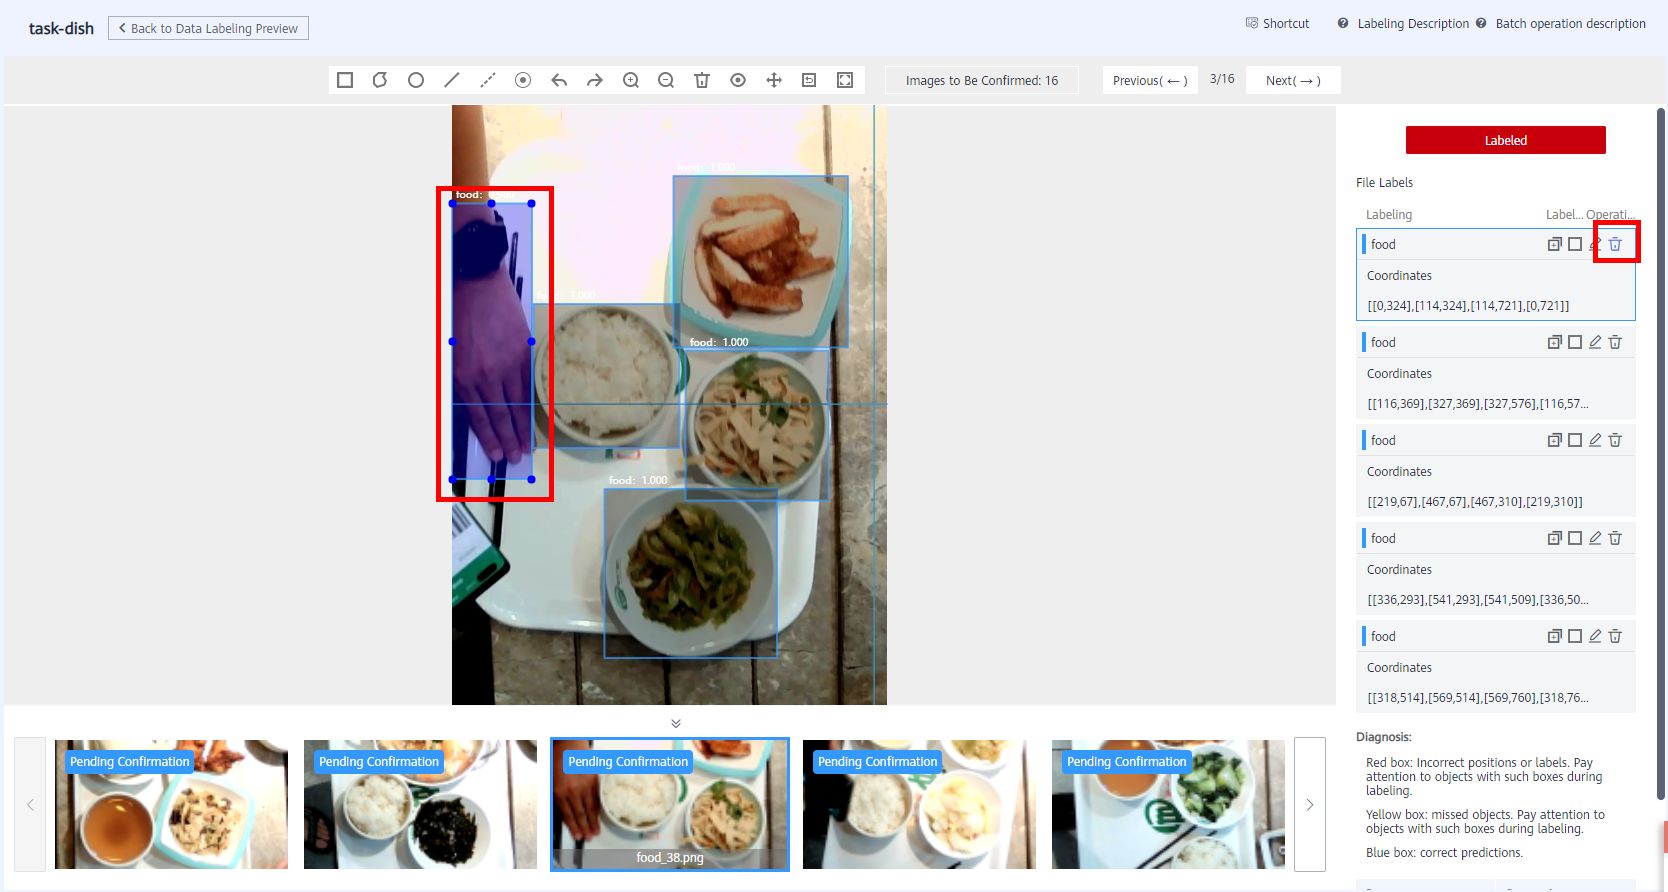
Auto labeling analyzes data based on the previous personal labeling behavior. Therefore, the more accurate the personal labeling, the more accurate the auto labeling. However, there are some false detections. For that, click on the right to delete icon and click labeld to confirm the information. As shown in the following figure:
4 Feature Analysis
In the data prepartation stage, it is not enough to have annotations, but also to conduct overall statistical analysis of the data and fine-grained analysis and diagnosis of individual data, to better understand the data quality and determine whether the dataset meets your algorithm and model requirements, and timely find deeper problems and optimization.
4.1 Create a Feature Analysis Task
-
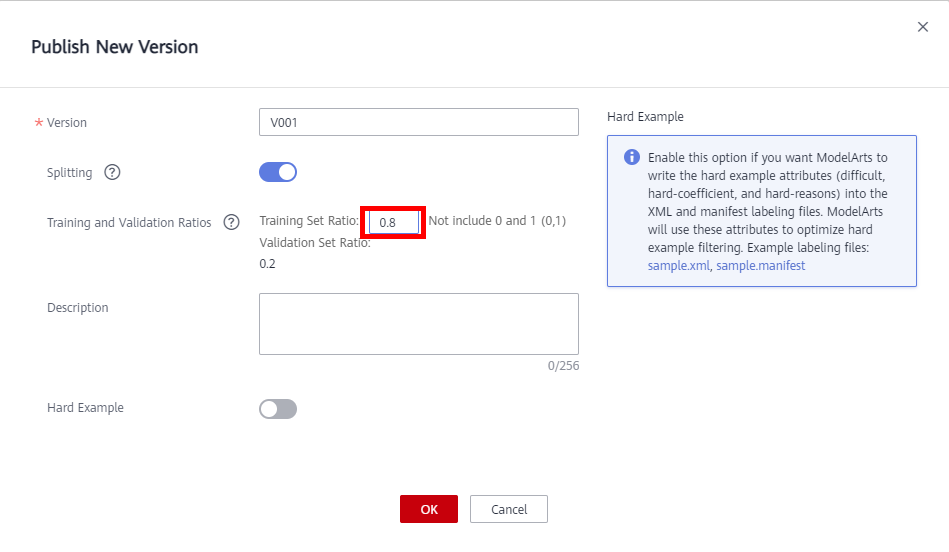
Before performing feature analysis, publish a dataset version as input for the data verification algorithm. After confirming the auto labeling data, click Publish in the upper right corner to publish a new version of the dataset.
● Version: the system default starts with V001, you can also define your own verison name to release a new version.
● Training and Validation Ratios: If Training Set Ratio is set to 0.8, Validation Set Ratio is automatically calculated.
● Description: User-defined
● Hard Example: Optional

-
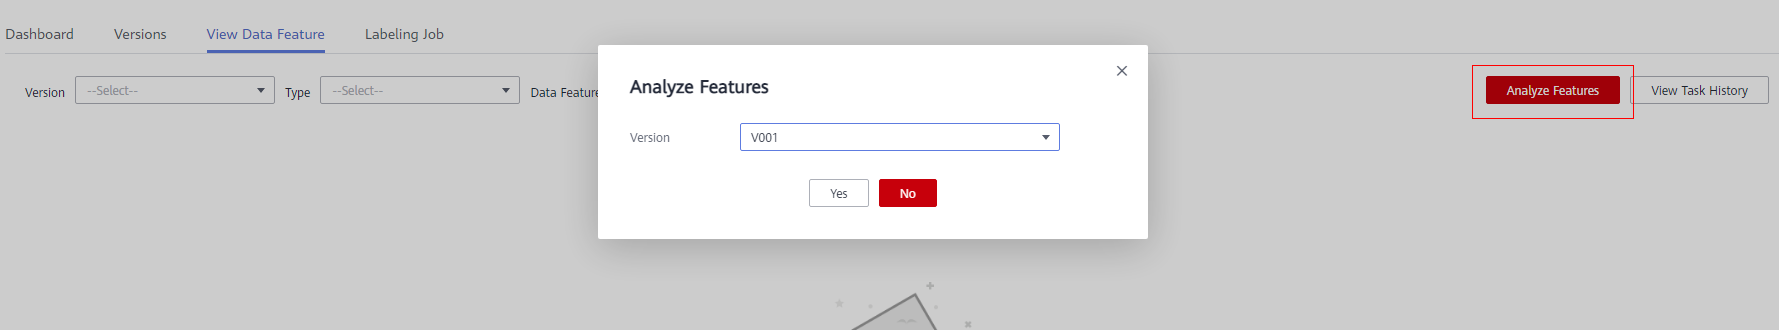
After the version is published, back to the dataset named dataset-dish Dashboard page. Click Versions to view the version of dataset, and then click View Data Feature > Analyze Features. In the displayed dialog box, select the newly published dataset version and click Yes to start feature analysis.
-
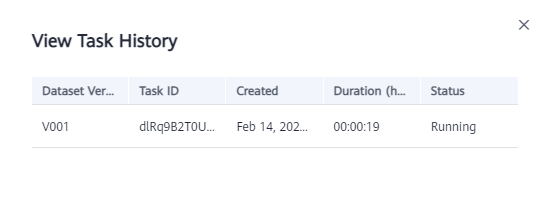
View the task progress.
You can click View Task History to view the task progress. When the task status changes to Successful, the task is complete.
4.2 View the Feature Analysis Result
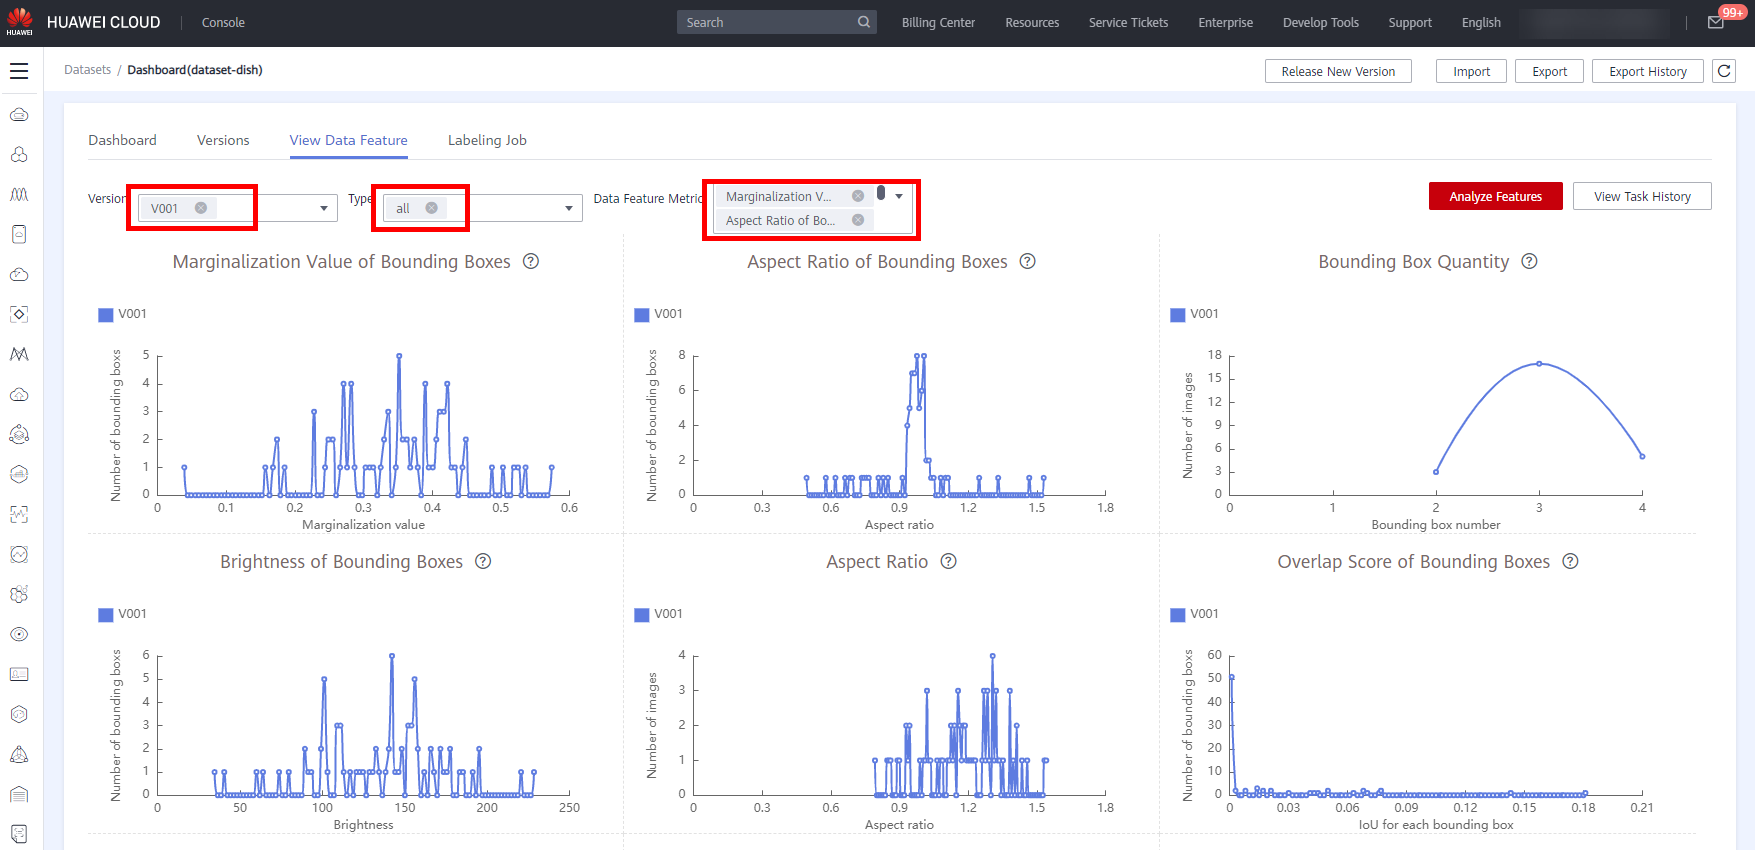
After feature analysis is complete, you can select Version, Type, and Data Feature Metric on the View Data Feature tab page. Then, the selected versions and metrics are displayed on the page. The displayed chart helps you understand data distribution for a better understanding of your data.
The following figure shows the dataset feature analysis page. You can select metrics of interest to view.
In addition to viewing the feature statistics of individual dataset, ModelArts also supports the comparison function. For example, if datasets of different versions are compared, and if the distribution of training sets and verification sets differs greatly, the performance of models trained in the training dataset may be poor in the verification set.
By tracking the differences between two datasets on each feature, developers can have a better understanding of the differences in datasets and make optimizations. For example, migration learning can be used to optimize the algorithm so that the model can adapt itself to data distribution.
● Version: Select one or more versions for comparison.
● Type: Select types to be analyzed. The values all, train, eval, and inference are available for you to select. They indicate all, training, evaluation, and inference, respectively.
● Data Feature Metric: Select the metrics to be displayed. For details about the metrics, see Data feature metrics.
In feature analysis results, for example, image brightness distribution is uneven, which means images of a certain brightness are lacking. This greatly affects model training. In this case, increase images of that brightness to make data more even for subsequent model building.

- 点赞
- 收藏
- 关注作者
评论(0)