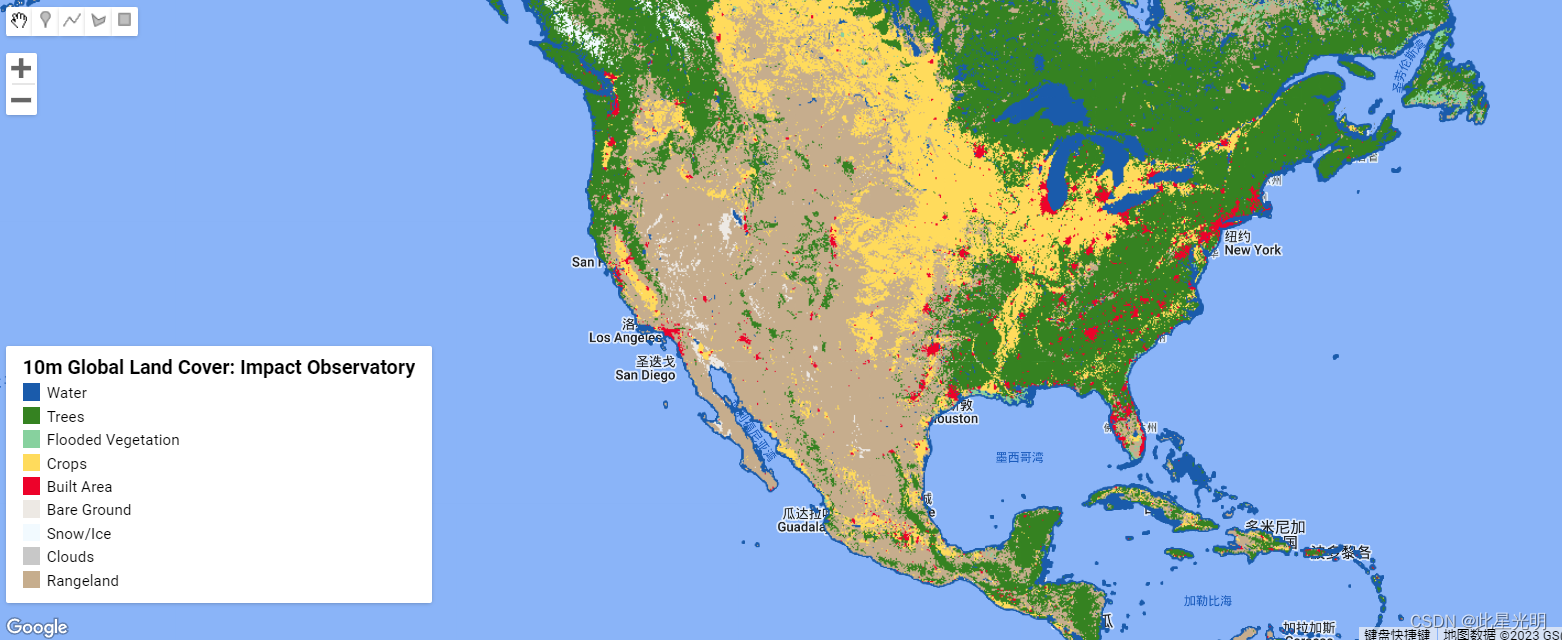
ESRI 10m年度土地利用土地覆盖(2017-2021)
全球土地利用和土地覆盖(LULC)年度地图的时间序列。它目前有2017-2021年的数据。这些地图来自欧空局Sentinel-2图像,分辨率为10米。每张地图是全年9个等级的LULC预测的综合,以产生每年的代表性快照。这个数据集是由Impact Observatory生成的,他们使用了数十亿的人类标记的像素(由国家地理学会策划)来训练一个用于土地分类的深度学习模型。全球地图是通过将这个模型应用于行星计算机上的Sentinel-2年度场景集而产生的。每张地图的评估平均精度都超过75%。这些由Impact Observatory制作并由Esri授权的数据集是从微软行星计算机的数据目录和存储中获取的。
Planetary Computer
该地图使用了10级模型的更新模型,并将草地(原第3级)和灌丛(原第6级)合并为一个单一的牧场等级(第11级)。最初的Esri 2020土地覆盖集合使用了10个类(草和灌丛分开)和一个旧版本的基础深度学习模型。Esri 2020土地覆盖地图也是由Impact Observatory制作的,你可以在GEE中找到它。该地图仍然可以在现有的应用程序中使用。新的应用程序一旦在这个集合中可用,就应该使用2020的更新版本,特别是在使用这个时间序列的多年的数据时,以确保一致的分类。
ESRI 2020 Global Land Use Land Cover from Sentinel-2 - awesome-gee-community-catalog
处理平台 Sentinel-2 L2A/B数据通过微软的行星计算机访问,并使用微软Azure Batch进行缩放。
你可以在这里找到从第一个版本开始的更多信息Kontgis, C.(2021年,6月24日)。以前所未有的细节绘制世界地图。
https://caitlin-kontgis.medium.com/mapping-the-world-in-unprecedented-detail-7c0513205b90
数据引用:
Karra, Kontgis, et al. “Global land use/land cover with Sentinel-2 and deep learning.”
IGARSS 2021-2021 IEEE International Geoscience and Remote Sensing Symposium. IEEE, 2021.
类的定义
水域 全年主要有水的区域;可能不包括有零星或短暂的水的区域;几乎不包含稀疏的植被,没有岩石露头,也没有码头等建筑特征;例子:河流、池塘、湖泊、海洋、淹没的盐碱地。
树木 任何明显的高大(约15英尺或更高)的密集植被集群,通常有一个封闭的或密集的树冠;例子:树木茂密的植被,热带草原内密集的高大植被集群,种植园,沼泽或红树林(密集/高大的植被,有短暂的水或树冠太厚,无法检测到下面的水)。
被淹没的植被 任何类型的植被在一年中的大部分时间里都有明显的水的混合;季节性淹没的区域,是草/灌木/树/荒地的混合;例子:被淹没的红树林、水草植被、稻田和其他大量灌溉和淹没的农业。
农作物 人工种植/种植的谷物、草和不在树高的作物;例子:玉米、小麦、大豆、休耕地的结构地块。
建筑区 人类制造的结构;主要的公路和铁路网络;大型均匀的不透水表面,包括停车场结构、办公大楼和住宅;例如:房屋、密集的村庄/城镇/城市、铺设的道路、沥青。
裸地 全年植被非常稀少或没有植被的岩石或土壤区域;没有或很少有植被的大面积沙地和沙漠;例如:裸露的岩石或土壤、沙漠和沙丘、干燥的盐滩/盘子、干涸的湖床、矿井。
雪/冰 大面积均匀的永久性雪或冰,通常只在山区或最高纬度地区;例子:冰川、永久性积雪、雪地。
云层 由于持续的云层覆盖,没有土地覆盖信息。
牧场 被同质草覆盖的开放区域,几乎没有高大的植被;野生谷物和草,没有明显的人为划线(即不是划线的田地);例子:有稀疏或没有树木覆盖的自然草地和田地,有少量或没有树木的开放草原,公园/高尔夫球场/草坪,牧场。混合小簇植物或单个植物分散在景观上,显示出暴露的土壤或岩石;密林内的灌丛空地,显然不比树木高;例子:中等到稀疏的灌木丛、灌木和草丛覆盖,有非常稀疏的草、树木或其他植物的热带草原。
有关准确性评估的信息,请访问ESRI发布页面
分类列表:
| Class Value |
Remapped Value |
Land Cover Class |
Hex Code |
| 1 |
1 |
Water |
#1A5BAB |
| 2 |
2 |
Trees |
#358221 |
| 4 |
3 |
Flooded Vegetation |
#87D19E |
| 5 |
4 |
Crops |
#FFDB5C |
| 7 |
5 |
Built Area |
#ED022A |
| 8 |
6 |
Bare Ground |
#EDE9E4 |
| 9 |
7 |
Snow/Ice |
#F2FAFF |
| 10 |
8 |
Clouds |
#C8C8C8 |
| 11 |
9 |
Rangeland |
#C6AD8D |
代码:
var esri_lulc_ts= ee.ImageCollection("projects/sat-io/open-datasets/landcover/ESRI_Global-LULC_10m_TS");

// Define a dictionary which will be used to make legend and visualize image on map
var dict = {
  "names": [
    "Water",
    "Trees",
    "Flooded Vegetation",
    "Crops",
    "Built Area",
    "Bare Ground",
    "Snow/Ice",
    "Clouds",
    "Rangeland"
  ],
  "colors": [
    "#1A5BAB",
    "#358221",
    "#87D19E",
    "#FFDB5C",
    "#ED022A",
    "#EDE9E4",
    "#F2FAFF",
    "#C8C8C8",
    "#C6AD8D"
  ]};

  function remapper(image){
    var remapped = image.remap([1,2,4,5,7,8,9,10,11],[1,2,3,4,5,6,7,8,9])
    return remapped
  }

// This is palette has '#000000' for value 3 and 6.
var palette = [
    "#1A5BAB",
    "#358221",
    "#000000",
    "#87D19E",
    "#FFDB5C",
    "#000000",
    "#ED022A",
    "#EDE9E4",
    "#F2FAFF",
    "#C8C8C8",
    "#C6AD8D",
  ];

// Create a panel to hold the legend widget
var legend = ui.Panel({
  style: {
    position: 'bottom-left',
    padding: '8px 15px'
  }
});

// Function to generate the legend
function addCategoricalLegend(panel, dict, title) {

  // Create and add the legend title.
  var legendTitle = ui.Label({
    value: title,
    style: {
      fontWeight: 'bold',
      fontSize: '18px',
      margin: '0 0 4px 0',
      padding: '0'
    }
  });
  panel.add(legendTitle);

  var loading = ui.Label('Loading legend...', {margin: '2px 0 4px 0'});
  panel.add(loading);

  // Creates and styles 1 row of the legend.
  var makeRow = function(color, name) {
    // Create the label that is actually the colored box.
    var colorBox = ui.Label({
      style: {
        backgroundColor: color,
        // Use padding to give the box height and width.
        padding: '8px',
        margin: '0 0 4px 0'
      }
    });

    // Create the label filled with the description text.
    var description = ui.Label({
      value: name,
      style: {margin: '0 0 4px 6px'}
    });

    return ui.Panel({
      widgets: [colorBox, description],
      layout: ui.Panel.Layout.Flow('horizontal')
    });
  };

  // Get the list of palette colors and class names from the image.
  var palette = dict['colors'];
  var names = dict['names'];
  loading.style().set('shown', false);

  for (var i = 0; i < names.length; i++) {
    panel.add(makeRow(palette[i], names[i]));
  }

  Map.add(panel);

}


/*
  // Display map and legend ///////////////////////////////////////////////////////////////////////////////
*/

// Add the legend to the map
addCategoricalLegend(legend, dict, '10m Global Land Cover: Impact Observatory');

// Add image to the map
Map.addLayer(ee.ImageCollection(esri_lulc10.filterDate('2017-01-01','2017-12-31').mosaic()).map(remapper), {min:1, max:9, palette:dict['colors']}, '2017 LULC 10m')
Map.addLayer(ee.ImageCollection(esri_lulc10.filterDate('2018-01-01','2018-12-31').mosaic()).map(remapper), {min:1, max:9, palette:dict['colors']}, '2018 LULC 10m')
Map.addLayer(ee.ImageCollection(esri_lulc10.filterDate('2019-01-01','2019-12-31').mosaic()).map(remapper), {min:1, max:9, palette:dict['colors']}, '2019 LULC 10m')
Map.addLayer(ee.ImageCollection(esri_lulc10.filterDate('2020-01-01','2020-12-31').mosaic()).map(remapper), {min:1, max:9, palette:dict['colors']}, '2020 LULC 10m')
Map.addLayer(ee.ImageCollection(esri_lulc10.filterDate('2021-01-01','2021-12-31').mosaic()).map(remapper), {min:1, max:9, palette:dict['colors']}, '2021 LULC 10m')
https://code.earthengine.google.com/?scriptPath=users/sat-io/awesome-gee-catalog-examples:global-landuse-landcover/ESRI-LULC-2017-2021

Credits, Attributions and License
This dataset was produced by Impact Observatory for Esri. © 2021 Esri. This dataset is available under a Creative Commons BY-4.0 license and any copy of or work based on this dataset requires the following attribution:
Data page: Planetary Computer STAC Catalog
Curated in GEE by: Samapriya Roy
Keywords: : landcover, landuse, lulc, 10m, global, world, sentinel, sentinel 2, impact observatory
Last updated: 2022-08-29


评论(0)