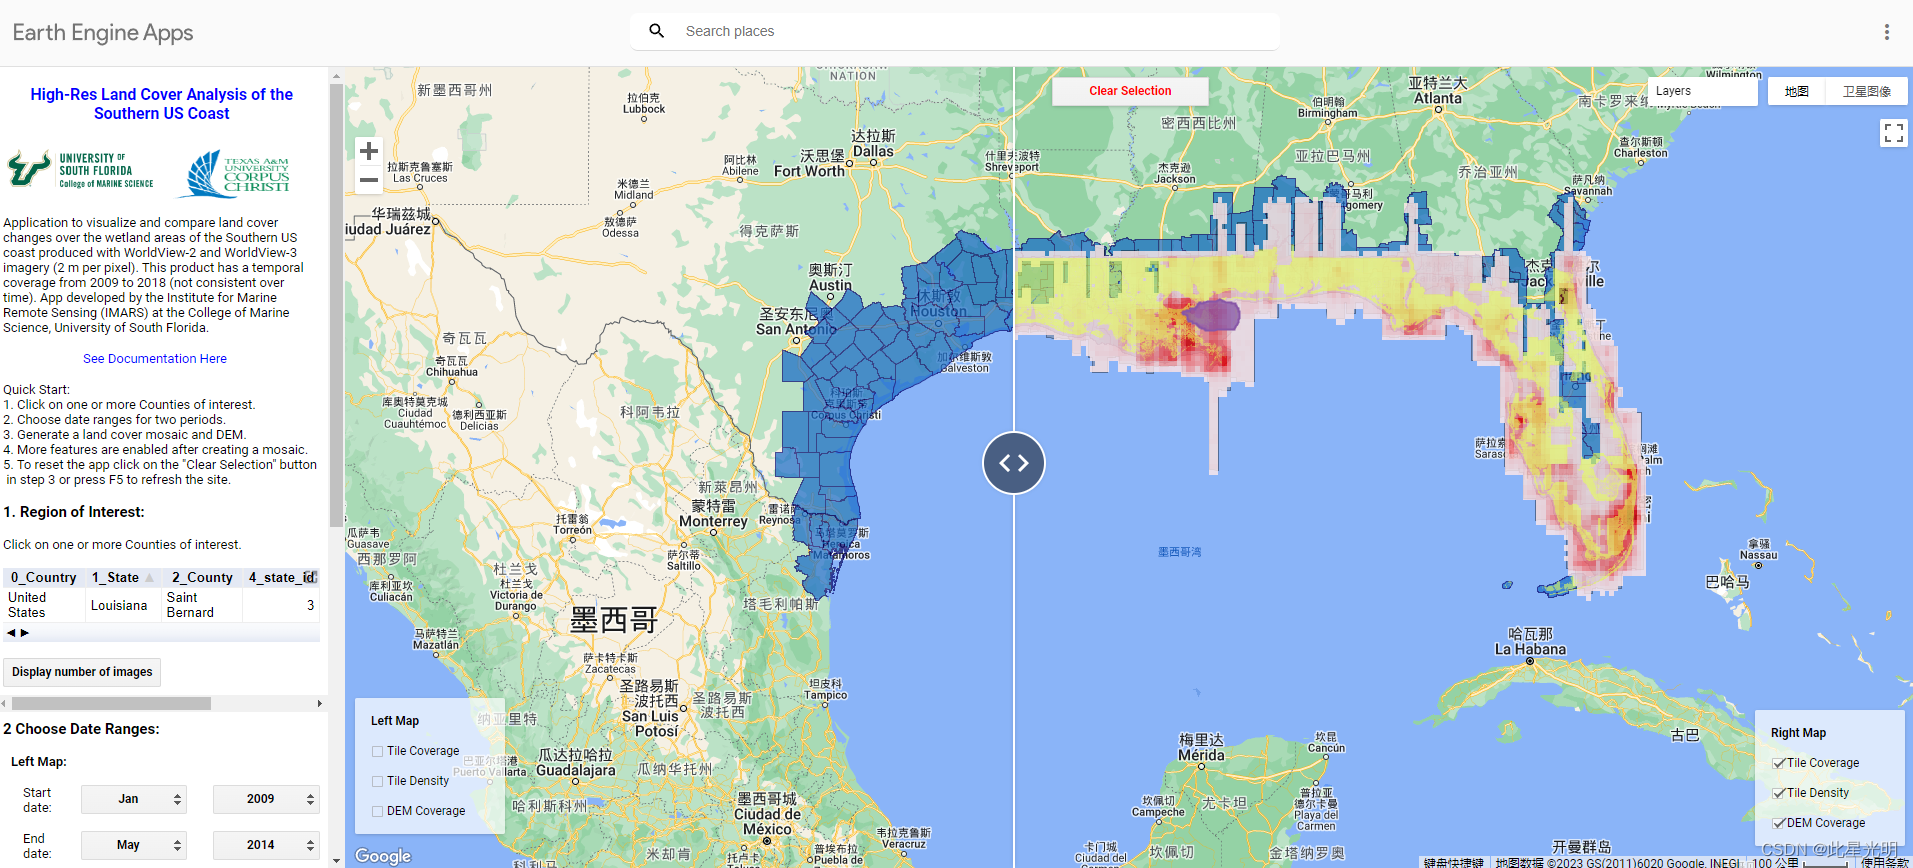
美国南部海岸湿地地区土地覆盖变化的可视化和比较应用

用WorldView-2和WorldView-3图像(每像素2米)制作的美国南部海岸湿地地区土地覆盖变化的可视化和比较应用。这个产品的时间覆盖面从2009年到2018年(时间上不一致)。应用程序由南佛罗里达大学海洋科学学院的海洋遥感研究所开发。谷歌地球引擎(GEE)的应用,以非常高的分辨率可视化和比较墨西哥湾北部和佛罗里达州湿地地区的土地覆盖变化和数字高程模型(DEM)。
三维湿地应用程序提供了对两个大型集合的访问,(1)土地覆盖和(2)DEM,摄入地球引擎。土地覆盖产品提供了对WorldView-2和WorldView-3卫星提供的12,929张每像素2米的处理和分类图像的访问,时间范围从2009年到2018年(这在时间上不一致)。
DEM产品是在墨西哥湾北部和佛罗里达州的湿地和沿海地区的178次机载地形激光雷达测量(裸地)建立的。该产品的水平分辨率为每像素2米,垂直精度为0.2米。
3D湿地应用程序是通过GEE开放访问的。用户不需要GEE账户就可以使用应用程序界面中的所有功能。如果用户有一个GEE账户,就可以使用高级版本,点击一个按钮就可以将数据导出到相应的Google Drive账户。在这一点上,不需要有使用GEE的经验。然而,通过代码编辑器访问土地覆盖和DEM集合以用于其他特定用途时,需要有GEE的知识(参见GEE文档)。
APP:
2.feature
在一个或多个选定县中创建、可视化和比较两个用户定义时期的土地覆盖镶嵌图
可视化与所选县关联的 DEM
查看选定县中可用的图像(土地覆盖)数量以及用于创建马赛克的图像数量
创建包括所有或单个土地覆盖类别的马赛克
在地图上绘制横断面并探索海拔和土地覆盖剖面
将生成的马赛克和 DEM 下载为 .png,最大分辨率 1000x1000px(基本界面)
将生成的马赛克和 DEM 导出为 GeoTiff 图像(高级界面)
计算整个区域或高程范围内镶嵌图中每个类的面积 (km2),并导出为 .csv 文件(高级界面)
通过代码编辑器(高级界面)访问整个土地覆盖和 DEM 集合。
4常见问题
土地覆盖是如何生成的?
土地覆盖是通过计算所选县中所有可用图像堆栈中每个像素的最大值生成的。 这会优先处理具有较高像素值的类,例如已开发(像素值 11),并最大限度地减少云的存在(像素值 1)。 如果选择了单个类,那么最终的马赛克只是各个像素值的堆叠。
我是否需要 Google Earth Engine 帐户才能使用该应用程序?
不需要,任何人都可以通过GEE App平台使用3D湿地app。 但是,导出数据和其他高级功能需要 GEE 帐户。
我可以访问土地覆盖和 DEM 集合吗?
是的,可以通过 GEE 代码编辑器(高级界面)完全访问这些集合。
我可以通过应用程序下载生成的马赛克和 DEM 吗?
是的,马赛克可以下载为 .png(基本界面)或 .tiff(高级界面)。
按下“生成”按钮后我没有看到任何地图
确保您至少选择了一个县。
确保您已为左右地图选择了有效时间段。
检查所选 County 和 Tile Coverage 图层的可用图像数。
我没有看到要下载的任何地图或区域估计
确保您已在“任务”选项卡中按下“运行”。
检查进程是否仍在服务器上运行。
在您的 Google 云端硬盘中搜索任何新文件。
为什么我在尝试绘制高程剖面时看到错误?
样带必须从有效的土地覆盖和 DEM 值开始。
我可以更改 DEM 图层的颜色条图例吗?
颜色条从百分位数 1% 到百分位数 99% 自动生成。 只能使用高级界面中启用的图层按钮(右上角)来编辑颜色和范围。 要编辑地图左侧的 DEM 图层,您需要将拆分器一直拖动到图层按钮的右侧。
免责声明
3D 湿地应用程序提供对经过处理的卫星图像和 DEM 数据的访问,作为公共和学术用途的工具。 原始卫星数据是 DigitalGlobe 的财产。 3D 湿地应用程序是 NSF 授予美国南部沿海和湿地地区生境、生物多样性和洪水灾害评估的增强型 3-D 地图研究项目的产物 南佛罗里达州,与 TAMU-CC Harte 研究所的 James Gibeaut 合作。
WorldView 图像由南佛罗里达大学海洋科学学院的海洋遥感研究所 (IMARS) 处理,DEM 由德克萨斯 A&M 大学科珀斯克里斯蒂分校的哈特墨西哥湾研究所获得。 Google Earth Engine 是 dat 的平台
代码:
//////////////////////////////////////////////////////////////////////////////////////////////////////////
//////////////    High-res wetland cover of the Northern Gulf of Mexico and Florida APP    ///////////////
//////////////                              For Basic Use                                  ///////////////
//////////////////////////////////////////////////////////////////////////////////////////////////////////

// Script by: Luis Lizcano-Sandoval
// College of Marine Science, University of South Florida
// Date: 11/12/2020
// Contact: luislizcanos@usf.edu


// Load some datasets.
var tile_coverage = ee.FeatureCollection("users/lizcanosandoval/wv-regions/tile_coverage");
var density = ee.Image("users/lizcanosandoval/wv-regions/Region_Density");
var regions = ee.FeatureCollection("users/lizcanosandoval/wv-regions/wv_counties_buffer");

// Set static variables for months and years.
var month = {
  'Jan' : ['01-01', '01-31'],
  'Feb' : ['02-01', '02-28'],
  'Mar' : ['03-01', '03-31'],
  'Apr' : ['04-01', '04-30'],
  'May' : ['05-01', '05-31'],
  'Jun' : ['06-01', '06-30'],
  'Jul' : ['07-01', '07-31'],
  'Aug' : ['08-01', '08-31'],
  'Sep' : ['09-01', '09-30'],
  'Oct' : ['10-01', '10-31'],
  'Nov' : ['11-01', '11-30'],
  'Dec' : ['12-01', '12-31']
  };
var year = ['2009','2010','2011','2012','2013','2014','2015','2016','2017','2018'];

// Dictionary of classes:
var pixelClass = {
  'All' : 0,
  'Soil' : 2,
  'Water' : 3,
  'Dead Grass' : 5,
  'Marsh' : 6,
  'Scrub' : 7,
  'Grass' : 8,
  'Forested Upland' : 9,
  'Forested Wetland' : 10,
  'Developed' : 11,
  };

// Import image collection:
var wetlands = ee.ImageCollection("projects/imars-3d-wetlands/alabama")
  .merge(ee.ImageCollection("projects/imars-3d-wetlands/fl_big_bend"))
  .merge(ee.ImageCollection("projects/imars-3d-wetlands/fl_monroe"))
  .merge(ee.ImageCollection("projects/imars-3d-wetlands/fl_ne"))
  .merge(ee.ImageCollection("projects/imars-3d-wetlands/fl_panhandle"))
  .merge(ee.ImageCollection("projects/imars-3d-wetlands/fl_se"))
  .merge(ee.ImageCollection("projects/imars-3d-wetlands/fl_sw"))
  .merge(ee.ImageCollection("projects/imars-3d-wetlands/louisiana_e"))
  .merge(ee.ImageCollection("projects/imars-3d-wetlands/louisiana_w"))
  .merge(ee.ImageCollection("projects/imars-3d-wetlands/mississippi"))
  .merge(ee.ImageCollection("projects/imars-3d-wetlands/texas_central"))
  .merge(ee.ImageCollection("projects/imars-3d-wetlands/texas_ne"))
  .merge(ee.ImageCollection("projects/imars-3d-wetlands/texas_sw"));

//Import DEM collection:
var dem = ee.ImageCollection("projects/imars-3d-wetlands/DEM_GoM");
var dem_cover = ee.Image("projects/imars-3d-wetlands/DEM_coverage100");

// Styles for map layers
var region_STYLE = {color: '#00006E', fillColor: '#1569C7', width: 1};
var highlight_STYLE = {color: '8856a7', fillColor: '8856a7C0'};
var tile_STYLE = {color: '#000000', fillColor: '#736F6E', width: 1};
var densityPalette = [
  "#FFEBEB",
  "#FFCFCF",
  "#FF7D7D",
  "#FF4141",
  "#FF0000",
  "#CD0000",
  "#950000",
  "#780000",
  "#5F0000"
  ];

/////////////////////////////////////////////////////////
var leftMap = ui.Map();
var rightMap = ui.Map();

// Configure our map with a minimal set of controls.
leftMap.setControlVisibility(true);
leftMap.setControlVisibility({scaleControl: true, zoomControl: true});
leftMap.style().set({cursor: 'crosshair'});
leftMap.setCenter(-89.27, 27.49, 6);
rightMap.setControlVisibility(true);
rightMap.setControlVisibility({scaleControl: true, zoomControl: true});
rightMap.style().set({cursor: 'crosshair'});
//rightMap.setCenter(-89.27, 27.49, 6);

// Create the application title bar.
var clickTitleL = ui.Label('Click on Regions of Interest', {fontWeight: 'bold', fontSize: '18px',position:'top-center'});
var clickTitleR = ui.Label('Click on Regions of Interest', {fontWeight: 'bold', fontSize: '18px',position:'top-center'});
leftMap.add(clickTitleL);
rightMap.add(clickTitleR);

// Add layers to the map
leftMap.addLayer(regions.style(region_STYLE), {opacity: 0.7}, 'Counties');
leftMap.layers().set(1, ui.Map.Layer(tile_coverage.style(tile_STYLE), {opacity: 0.4}, 'Coverage',false));
leftMap.layers().set(2, ui.Map.Layer(density, {min:1, max:200, palette: densityPalette}, 'Tile Density',false,0.8));
leftMap.layers().set(3, ui.Map.Layer(dem_cover,{palette: '#e5ff58'},'DEM Coverage',false,0.6));

rightMap.addLayer(regions.style(region_STYLE), {opacity: 0.7}, 'Counties');
rightMap.layers().set(1, ui.Map.Layer(tile_coverage.style(tile_STYLE), {opacity: 0.4}, 'Coverage',false));
rightMap.layers().set(2, ui.Map.Layer(density, {min:1, max:200, palette: densityPalette}, 'Tile Density',false,0.8));
rightMap.layers().set(3, ui.Map.Layer(dem_cover,{palette: '#e5ff58'},'DEM Coverage',false,0.6));


/// LAYER CHECKBOX:

// Create a panel to hold the chart.
var layerPanel_left = ui.Panel();
layerPanel_left.style().set({
  width: '150px',
  position: 'bottom-left',
  backgroundColor: 'rgba(255, 255, 255, 0.7)'
});
var layerPanel_right = ui.Panel();
layerPanel_right.style().set({
  width: '150px',
  position: 'bottom-right',
  backgroundColor: 'rgba(255, 255, 255, 0.7)'
});

// Add panels to the map.
leftMap.add(layerPanel_left);
rightMap.add(layerPanel_right);

// Create checkboxes.
// Left side:
var checkbox1_left = ui.Checkbox('Tile Coverage', false);
checkbox1_left.style().set({fontSize: '11px',backgroundColor: 'rgba(255, 255, 255, 0)'});
checkbox1_left.onChange(function(checked) {
  // Shows or hides the map layer based on the checkbox's value.
  leftMap.layers().get(1).setShown(checked);
});
var checkbox2_left = ui.Checkbox('Tile Density', false);
checkbox2_left.style().set({fontSize: '11px',backgroundColor: 'rgba(255, 255, 255, 0)'});
checkbox2_left.onChange(function(checked) {
  leftMap.layers().get(2).setShown(checked);
});
var checkbox3_left = ui.Checkbox('DEM Coverage', false);
checkbox3_left.style().set({fontSize: '11px',backgroundColor: 'rgba(255, 255, 255, 0)'});
checkbox3_left.onChange(function(checked) {
  leftMap.layers().get(3).setShown(checked);
});

// Right side:
var checkbox1_right = ui.Checkbox('Tile Coverage', false);
checkbox1_right.style().set({fontSize: '11px',backgroundColor: 'rgba(255, 255, 255, 0)'});
checkbox1_right.onChange(function(checked) {
  // Shows or hides the map layer based on the checkbox's value.
  rightMap.layers().get(1).setShown(checked);
});
var checkbox2_right = ui.Checkbox('Tile Density', false);
checkbox2_right.style().set({fontSize: '11px',backgroundColor: 'rgba(255, 255, 255, 0)'});
checkbox2_right.onChange(function(checked) {
  rightMap.layers().get(2).setShown(checked);
});
var checkbox3_right = ui.Checkbox('DEM Coverage', false);
checkbox3_right.style().set({fontSize: '11px',backgroundColor: 'rgba(255, 255, 255, 0)'});
checkbox3_right.onChange(function(checked) {
  rightMap.layers().get(3).setShown(checked);
});

// Add title to the layer panel:
var layerboxTitle_l = ui.Label('Left Map');
  layerboxTitle_l.style().set('fontWeight', 'bold');
  layerboxTitle_l.style().set({fontSize:'12px',padding:'0px', textAlign:'left',backgroundColor:'rgba(255,255,255,0)'});
layerPanel_left.widgets().set(0,layerboxTitle_l);

var layerboxTitle_r = ui.Label('Right Map');
  layerboxTitle_r.style().set('fontWeight', 'bold');
  layerboxTitle_r.style().set({fontSize:'12px',padding:'0px', textAlign:'left',backgroundColor:'rgba(255,255,255,0)'});
layerPanel_right.widgets().set(0,layerboxTitle_r);

// Add checkboxes to the panels
var subPanelStyle = {backgroundColor:'rgba(255,255,255,0)'};

layerPanel_left.widgets().set(1,ui.Panel({
  widgets:[checkbox1_left,checkbox2_left,checkbox3_left],style: subPanelStyle}));

layerPanel_right.widgets().set(1,ui.Panel({
  widgets:[checkbox1_right,checkbox2_right,checkbox3_right],style: subPanelStyle}));


// Split map:
var splitPanel = ui.SplitPanel({
  firstPanel: leftMap,
  secondPanel: rightMap,
  orientation: 'horizontal',
  wipe: true,
  //style: {width: '1200px'}
  style: {stretch: 'both'}
});

// Link the two maps:
var linker = ui.Map.Linker([leftMap, rightMap]);
ui.root.widgets().reset([splitPanel]);

// Create a panel:
var panel = ui.Panel({
  layout: ui.Panel.Layout.flow('vertical'),
  style: {width: '350px'}
});

// Add the title
var appTitle = ui.Label('High-Res Land Cover Analysis of the Southern US Coast');
  appTitle.style().set('color', 'blue');
  appTitle.style().set('fontWeight', 'bold');
  appTitle.style().set({fontSize:'16px', padding:'10px', textAlign: 'center'});

//Add logo
var logo1 = ee.Image("users/lizcanosandoval/logos/USF-CMS-Logo");
var logo2 = ee.Image("users/lizcanosandoval/logos/TAMUCC_block-color");
var branding1 = ui.Thumbnail({
  image:logo1,
  params:{bands:['b1','b2','b3'],min:0,max:255},
  style:{width:'150px',height:'40px', padding: '0px 0px 0px 4px'}
});
var branding2 = ui.Thumbnail({
  image:logo2,
  params:{bands:['b1','b2','b3'],min:0,max:255},
  style:{width:'120px',height:'50px', padding: '0px 0px 0px 4px'}
});

// Add description
var appDesc = ui.Label('Application to visualize and compare land cover changes over the wetland areas of'+
    ' the Southern US coast produced with WorldView-2 and WorldView-3 imagery (2 m per pixel).'+
    ' This product has a temporal coverage from 2009 to 2018 (not consistent over time).'+
    ' App developed by the Institute for Marine Remote Sensing (IMARS) at the College of Marine Science, '+
    'University of South Florida.');
appDesc.style().set({fontSize:'13px', padding:'0px'});

var docum = ui.Label({
    value: 'See Documentation Here',
    style: {
    fontSize: '13px',
    padding:'0px 0px 0px 80px',
    stretch: 'horizontal',
    textAlign: 'left'}
});
docum.setUrl('https://github.com/luislizcano/3D-wetlands-app');

var start = ui.Label('Quick Start: \n1. Click on one or more Counties of interest. \n2. Choose date ranges for two periods.'+
    '\n3. Generate a land cover mosaic and DEM. \n4. More features are enabled after creating a mosaic.'+
    '\n5. To reset the app click on the "Clear Selection" button \n in step 3 or press F5 to refresh the site.');
start.style().set({fontSize:'13px', padding:'0px', whiteSpace: 'pre'});
// Add widgets to panel
panel.widgets().set(0,appTitle); //Add title to panel
panel.widgets().set(1,ui.Panel([branding1,branding2],ui.Panel.Layout.flow('horizontal'))); //Add logo to panel
panel.widgets().set(2,appDesc); //Add description to panel
panel.widgets().set(3,docum); //Add documentation link
panel.widgets().set(4,start);

///// SIDEPANEL SETTINGS ///////

///// REGIONS SECTION /////
var titleRegion = ui.Label({
  value: '1. Region of Interest:',
  style: {
    fontWeight: 'bold',
    fontSize: '15px',
    padding: '0px',
    stretch: 'horizontal',
    textAlign: 'left'}
});
var textRegion = ui.Label('Click on one or more Counties of interest.');
textRegion.style().set({fontSize:'13px', padding:'0px'});

// Add widgets to panel
panel.widgets().set(5,titleRegion);
panel.widgets().set(6,textRegion);

//// Functions to create a table of properties from selected features on map.
//// Most of this functions were modified from the 'Global Population Explorer APP':

// Empty variable for selecting points on map.
var selectedPoints = [];

// Returns the list of features the user has selected.
function getSelectedFeatures() {
  return regions.filterBounds(ee.Geometry.MultiPoint(selectedPoints));
}

// Makes a table of the given features by name.
function makeResultsTable(regions) {
  var table = ui.Chart.feature.byFeature(regions, '0_Country');
  table.setChartType('Table');
  table.setOptions({allowHtml: true, pageSize: 5, sortColumn: 1});
  table.style().set({stretch: 'both'});
  return table;
}

// Makes a bar chart of the given FeatureCollection of countries by name.
function makeResultsBarChart(regions) {
  //Filter image collection by area
  var filterCollection = wetlands.filterBounds(getSelectedFeatures());
  // Get a list of image dates in format YYYY-MM
  var dates = filterCollection
    .map(function(image) {
      return ee.Feature(null, {'date': image.date().format('YYYY-MM')});
    }).aggregate_array('date');
  //Get frequency histogram and get keys and values
  var hist = dates.reduce(ee.Reducer.frequencyHistogram());
  var keys = ee.Dictionary(hist).keys();
  var values = ee.Dictionary(hist).values();
  // Create Chart
  var chart = ui.Chart.array.values({
  array: values,
  axis: 0,
  xLabels: keys
  });
  // Set chart style properties.
  var chartStyle = {
    title: 'Available Images For The Selected Counties',
    hAxis: {
      title: 'Number of Images',
      titleTextStyle: {italic: false, bold: true},
      gridlines: {color: 'FFFFFF'},
    },
    vAxis: {
      title: 'Year-Month',
      titleTextStyle: {italic: false, bold: true},
      gridlines: {color: 'FFFFFF'},
      format: 'short',
      baselineColor: 'FFFFFF',
    },
    chartArea: {backgroundColor: 'EBEBEB'}
  };
  chart.setSeriesNames(['Images']);
  chart.setChartType('BarChart');
  chart.setOptions(chartStyle);
  chart.style().set({stretch: 'both'});
  return chart;
}

// Updates the map overlay using the currently-selected features.
function updateOverlay() {
  var overlay = getSelectedFeatures().style(highlight_STYLE);
  leftMap.layers().set(4, ui.Map.Layer(overlay,{},'Selected Region')); //Layer number 5
  rightMap.layers().set(4, ui.Map.Layer(overlay,{},'Selected Region'));//Layer number 5
}

// Updates the table using the currently-selected table function.
// This function was modified from the 'Global Population Explorer APP'
function updateTable() {
  var TableBuilder = chartTypeToggleButton.value;
  var table = TableBuilder(getSelectedFeatures());
  resultsPanel.clear().add(table);//.add(newbuttonTable);
  buttonTable.widgets().reset([newbuttonTable]);//buttonTable.clear().add(newbuttonTable)
}

// Register a click handler for the map that adds the clicked point to the
// list and updates the map overlay and table accordingly.
function handleMapClick(location) {
  selectedPoints.push([location.lon, location.lat]);
  updateOverlay();
  updateTable();
  }

// Add selection to map
leftMap.onClick(handleMapClick);
rightMap.onClick(handleMapClick);

// A button widget that toggles (or cycles) between states.
// To construct a ToggleButton, supply an array of objects describing
// the desired states, each with 'label' and 'value' properties.
// This function was modified from the 'Global Population Explorer APP'
function ToggleButton(states, onClick) {
  var index = 0;
  var button = ui.Button(states[index].label);
  button.value = states[index].value;
  button.onClick(function() {
    index = ++index % states.length;
    button.setLabel(states[index].label);
    button.value = states[index].value;
    onClick();
  });
  return button;
}

// Our chart type toggle button: the button text is the opposite of the
// current state, since you click the button to switch states.
// This function was modified from the 'Global Population Explorer APP'
var chartTypeToggleButton = ToggleButton(
    [{value:makeResultsTable,label:'Display number of images'},
    {value:makeResultsBarChart,label:'Display selected Counties'}], updateTable);

// Create an empty panel to be updated with table results.
var resultsPanel = ui.Panel();

// Empty panel to be replaced by a button with chart results
var buttonTable = ui.Panel();
var newbuttonTable = ui.Panel(
  [chartTypeToggleButton],
  ui.Panel.Layout.Flow('horizontal'), {margin: '0 0 0 auto', width: '500px'});

// Add widget panel to the master panel
panel.widgets().set(7,resultsPanel);//ui.Panel.Layout.flow('horizontal')
panel.widgets().set(8,buttonTable);

///// DATES SECTION - LEFT MAP/////
var textChoose = ui.Label({
  value: '2 Choose Date Ranges:',
  style: {
    fontWeight: 'bold',
    fontSize: '15px',
    padding: '0px',
    stretch: 'horizontal',
    textAlign: 'left'}
});

var textLeftMap = ui.Label({
  value: 'Left Map:',
  style: {
    fontWeight: 'bold',
    fontSize: '13px',
    padding: '0px 0px 0px 8px',
    stretch: 'horizontal',
    textAlign: 'left'}
});

var textStart = ui.Label({
  value: 'Start date:',
  style: {
    fontSize: '13px',
    padding: '0px 0px 0px 20px',
    stretch: 'horizontal',
    }
});

var startMonth = ui.Select({
  items: Object.keys(month),
  placeholder: 'Choose Month...',
  style: {width: '35%', stretch: 'horizontal',padding:'0px 0px 0px 10px'}
});

var startYear = ui.Select({
  items: year,
  placeholder: 'Choose Year...',
  style: {width: '35%', stretch: 'horizontal',padding:'0px 0px 0px 10px'}
});

var textEnd = ui.Label({
  value: 'End date:',
  style: {
    fontSize: '13px',
    padding: '0px 0px 0px 20px',
    stretch: 'horizontal',
    }
});

var endMonth = ui.Select({
  items: Object.keys(month),
  placeholder: 'Choose Month...',
  style: {width: '35%', stretch: 'horizontal',padding:'0px 0px 0px 10px'}
});

var endYear = ui.Select({
  items: year,
  placeholder: 'Choose Year...',
  style: {width: '35%', stretch: 'horizontal',padding:'0px 0px 0px 10px'}
});

// Add widgets to panel
panel.widgets().set(9,ui.Panel([
  textChoose,
  textLeftMap],
  ui.Panel.Layout.flow('vertical')));
panel.widgets().set(10,ui.Panel([
  textStart,
  startMonth,
  startYear],
  ui.Panel.Layout.flow('horizontal')));
panel.widgets().set(11,ui.Panel([
  textEnd,
  endMonth,
  endYear],
  ui.Panel.Layout.flow('horizontal')));


///// DATES SECTION - RIGHT MAP/////
var textRightMap = ui.Label({
  value: 'Right Map:',
  style: {
    fontWeight: 'bold',
    fontSize: '13px',
    padding: '0px 0px 0px 8px',
    stretch: 'horizontal',
    textAlign: 'left'}
});

var textStartR = ui.Label({
  value: 'Start date:',
  style: {
    fontSize: '13px',
    padding: '0px 0px 0px 20px',
    stretch: 'horizontal',
    }
});

var startMonthR = ui.Select({
  items: Object.keys(month),
  placeholder: 'Choose Month...',
  style: {width: '35%', stretch: 'horizontal',padding:'0px 0px 0px 10px'}
});

var startYearR = ui.Select({
  items: year,
  placeholder: 'Choose Year...',
  style: {width: '35%', stretch: 'horizontal',padding:'0px 0px 0px 10px'}
});

var textEndR = ui.Label({
  value: 'End date:',
  style: {
    fontSize: '13px',
    padding: '0px 0px 0px 20px',
    stretch: 'horizontal',
    }
});

var endMonthR = ui.Select({
  items: Object.keys(month),
  placeholder: 'Choose Month...',
  style: {width: '35%', stretch: 'horizontal',padding:'0px 0px 0px 10px'}
});

var endYearR = ui.Select({
  items: year,
  placeholder: 'Choose Year...',
  style: {width: '35%', stretch: 'horizontal',padding:'0px 0px 0px 10px'}
});

// Add widgets to panel
panel.widgets().set(12,ui.Panel([
  textRightMap],
  ui.Panel.Layout.flow('vertical')));
panel.widgets().set(13,ui.Panel([
  textStartR,
  startMonthR,
  startYearR],
  ui.Panel.Layout.flow('horizontal')));
panel.widgets().set(14,ui.Panel([
  textEndR,
  endMonthR,
  endYearR],
  ui.Panel.Layout.flow('horizontal')));


///// GENERATE MOSAIC SECTION /////
var textMosaic = ui.Label({
  value: '3. Generate Land Cover Mosaic and DEM:',
  style: {
    fontWeight: 'bold',
    fontSize: '15px',
    padding: '0px',
    stretch: 'horizontal',
    textAlign: 'left'}
});

var textPixel = ui.Label({
    value: 'Select either one or all classes to create the mosaic. Then hit the "Generate" button and wait a few seconds'+
      ' for the mosaic to load. The DEM associated to the selected area will show up in a new layer.'+
      ' Click on "Clear Selection" to clear outputs and select a new area of interest.',
    style: {
    fontSize: '13px',
    padding: '0px',
    stretch: 'horizontal',
    textAlign: 'left'}
});

var classSelector = ui.Select({
  items: Object.keys(pixelClass),
  placeholder: 'Choose Class...',
  style: {width: '65%', stretch: 'horizontal',padding:'0px 0px 0px 100px'}
});


// Add widget to panel
panel.widgets().set(15,ui.Panel([
  textMosaic,
  textPixel,
  classSelector],
  ui.Panel.Layout.flow('vertical')));


//////////////////////////////////////////////////////////////////////////////////////
/////////////////////////////////////////////////////////////////////////////////////

// Function to create mosaics from selected regions and dates.
function doMosaic() {
  // Get start and end dates from button selections
  var startDate = startYear.getValue() + "-" + month[startMonth.getValue()][0];
  var endDate = endYear.getValue() + "-" + month[endMonth.getValue()][0];

  //Filter pixel values from the selector
  var pixelValue = ee.Number(pixelClass[classSelector.getValue()]);
  var maskPixels = function (image){
  var mask = ee.Image(image).eq(pixelValue);
    return image.updateMask(mask);
    };

  //Select pixels equal to 11-developed
  var developed = function (image){
    var mask = ee.Image(image).eq(11);
    return image.updateMask(mask);
  };

  //Create mask of only water
  var water = function (image){
    var mask = ee.Image(image).eq(3);
    return image.updateMask(mask);
  };

  // Filter the collection by dates and counties selected.
  var filterCollection = wetlands//.filterMetadata('system:index','not_contains','Cloudy')
                        .filterDate(startDate, endDate)
                        .filterBounds(getSelectedFeatures());

  // Function to clean missclassified pixels
  var cleanDeveloped = function(collection){
    // Clean misclassified cloudy pixels:
    var fullCollection = collection//.filterMetadata('system:index','not_contains','Cloudy')
                          .filterBounds(getSelectedFeatures());
    //Select only developed pixels
    var devCollection = fullCollection.map(developed);
    //Create mosaic suming pixel values
    var sumDeveloped = devCollection.sum();
    //Select pixels greater than 33 (presence of developed class in 3 or more images)
    var selectThreshold = sumDeveloped.gt(32);
    //Create a mask for misclassified pixels
    var justDeveloped = sumDeveloped.updateMask(selectThreshold);
    //Some areas over water bodies have cloudy pixels we can mask out
    var waterCollection = fullCollection.map(water);
    var waterMask = ee.ImageCollection(waterCollection).max().mask().not();
  return justDeveloped.updateMask(waterMask);
  }

  //Apply water mask on the cleaned collection. This is the mask for
  //"real" developed pixels.
  var realDeveloped = cleanDeveloped(wetlands)

  // Function to clean mosaic
  var cleanCollection = filterCollection.map(function (image){
    var developed = image.eq(11); //Developed
    var imageUpdated = image.updateMask(developed); //Developed mask
    var falseImg = realDeveloped.mask().not();
    var maskDev = imageUpdated.updateMask(falseImg).mask().not();
    var imageMask = image.updateMask(maskDev);
    return imageMask;
  })

  // Select the pixel value if one class is selected
  var condition = ee.Algorithms.If({
    condition: pixelValue.neq(0),
    trueCase: ee.ImageCollection(filterCollection.map(maskPixels)),
    falseCase: ee.ImageCollection(cleanCollection)
   });

  // Create mosaic - LEFT
  var mosaicImage = ee.ImageCollection(condition).max().clip(getSelectedFeatures());

  // Palette color codes
  var palette = [
  "#8C8C8C",       // 0 no data
  "#FFFFFF",       // 1 cloud
  "#621E01",       // 2 soil
  "#1F59CC",       // 3 water
  "FF00FF",        // 4 - unused
  "#E2D924",       // 5 dead grass
  "#7CCD11",       // 6 marsh
  "#AD6309",       // 7 scrub
  "#27D310",       // 8 grass
  "106F00",       // 9 forested upland
  "1EE682",       // 10 forested wetland
  "1E1E1E",       // 11 developed
  ];


  // Clip DEM by counties selected:
  // Filter the collection by dates and counties selected.
  var filterDEM = dem.filterBounds(getSelectedFeatures());
  var clipDEM = filterDEM.mosaic().clip(getSelectedFeatures()).rename('dem');

  // Find min-max values of the DEM region:
  var rangeDem = clipDEM.reduceRegion({reducer:ee.Reducer.percentile([1,50,99]),geometry:getSelectedFeatures(),scale:100,bestEffort:true});

  // Dictionary with values to use in a Server side function using evaluate() ahead.
  var minMax = ee.Dictionary({
    per1: rangeDem.getNumber('dem_p1'),
    per99: rangeDem.getNumber('dem_p99'),
    per50: rangeDem.getNumber('dem_p50')
  });

  var dem_palette = ['030d81','0519ff','05e8ff','11ff01','fbff01','ff9901','ff0000','ad0000'];

  //Add DEM and Mosaic to map
  minMax.evaluate(function(dict) {
    var dem_vis = {
      min: dict.per1,
      max: dict.per99,
      palette: dem_palette
    };
    leftMap.addLayer(clipDEM, dem_vis,'DEM',false); // (Layer #6)
  });
  leftMap.addLayer(mosaicImage, {min:0, max:11, palette: palette},'Left LC Mosaic'); // (Layer #7)

  //Add layers to checkbox
  var checkbox4_left = ui.Checkbox('DEM', false);
  checkbox4_left.style().set({fontSize: '11px',backgroundColor: 'rgba(255, 255, 255, 0)'});
  checkbox4_left.onChange(function(checked) {
    leftMap.layers().get(6).setShown(checked);
  });
  var checkbox5_left = ui.Checkbox('Left LC Mosaic', true);
  checkbox5_left.style().set({fontSize: '11px',backgroundColor: 'rgba(255, 255, 255, 0)'});
  checkbox5_left.onChange(function(checked) {
    leftMap.layers().get(5).setShown(checked);
  });

  layerPanel_left.widgets().set(2,ui.Panel({
    widgets:[checkbox4_left,checkbox5_left],style: subPanelStyle}));

  // Additionally, show the number of images used to create current mosaic
  var count = filterCollection.size();
  count.evaluate(function(result){
    countLabel = ui.Label('Images used for left mosaic: '+ result, {fontSize: '13px', padding:'0px 0px 0px 20px'});
    countImages.widgets().reset([countLabel]);
      });

  //////////////////
  //Right Mosaic: //
  //////////////////
  // Get start and end dates from button selections
  var startDateR = startYearR.getValue() + "-" + month[startMonthR.getValue()][0];
  var endDateR = endYearR.getValue() + "-" + month[endMonthR.getValue()][0];

  // Filter the collection by dates selected.
  var filterCollectionR = wetlands//.filterMetadata('system:index','not_contains','Cloudy')
                        .filterDate(startDateR, endDateR)
                        .filterBounds(getSelectedFeatures());

  // Function to clean mosaic
  var cleanCollectionR = filterCollectionR.map(function (image){
    var developed = image.eq(11); //Developed
    var imageUpdated = image.updateMask(developed); //Developed mask
    var falseImg = realDeveloped.mask().not();
    var maskDev = imageUpdated.updateMask(falseImg).mask().not();
    var imageMask = image.updateMask(maskDev);
    return imageMask;
  });

  // Select the pixel value if one class is selected
  var conditionR = ee.Algorithms.If({
    condition: pixelValue.neq(0),
    trueCase: ee.ImageCollection(filterCollectionR.map(maskPixels)),
    falseCase: ee.ImageCollection(cleanCollectionR)
   });

  // Create mosaic
  var mosaicImageR = ee.ImageCollection(conditionR).max().clip(getSelectedFeatures());

  //Add mosaic to map
  minMax.evaluate(function(dict) {
    var dem_vis = {
      min: dict.per1,
      max: dict.per99,
      palette: dem_palette
    };
    rightMap.addLayer(clipDEM, dem_vis,'DEM',false); // (Layer #6)
  });
  rightMap.addLayer(mosaicImageR, {min:0, max:11, palette: palette},'Right LC Mosaic'); // (Layer #7)

  //Add layers to checkbox
  var checkbox4_right = ui.Checkbox('DEM', false);
  checkbox4_right.style().set({fontSize: '11px',backgroundColor: 'rgba(255, 255, 255, 0)'});
  checkbox4_right.onChange(function(checked) {
    rightMap.layers().get(6).setShown(checked);
  });
  var checkbox5_right = ui.Checkbox('Right LC Mosaic', true);
  checkbox5_right.style().set({fontSize: '11px',backgroundColor: 'rgba(255, 255, 255, 0)'});
  checkbox5_right.onChange(function(checked) {
    rightMap.layers().get(5).setShown(checked);
  });

  layerPanel_right.widgets().set(2,ui.Panel({
    widgets:[checkbox4_right,checkbox5_right],style: subPanelStyle}));

  // Additionally, show the number of images used to create current mosaic
  var countR = filterCollectionR.size();
  countR.evaluate(function(result){
    countLabel = ui.Label('Images used for right mosaic: '+ result, {fontSize: '13px', padding:'0px 0px 0px 20px'});
    countImagesR.widgets().reset([countLabel]);
      });

  //// GRADIENT BAR FOR DEM
  // Creates a color bar thumbnail image for use in legend from the given color
  // palette.
  minMax.evaluate(function(dict) {
    var dem_vis = {
      min: dict.per1,
      max: dict.per99,
      palette: dem_palette
    };
    function makeColorBarParams(colorPalette) {
      return {
        bbox: [0, 0, 1, 0.1],
        dimensions: '50x5',
        format: 'png',
        min: 0,
        max: 1,
        palette: colorPalette,
      };
    }

    // Create the color bar for the legend.
    var colorBar = ui.Thumbnail({
      image: ee.Image.pixelLonLat().select(0),
      params: makeColorBarParams(dem_palette),
      style: {stretch: 'horizontal', margin: '0px 8px', maxHeight: '24px'},
    });

    // Create a panel with three numbers for the legend.
    var legendLabels = ui.Panel({
      widgets: [
        ui.Label(dict.per1.toFixed(1), {margin: '4px 8px'}),
        ui.Label(
            (dict.per99.toFixed(1)/2),
            {margin: '4px 8px', textAlign: 'center', stretch: 'horizontal'}),
        ui.Label(dict.per99.toFixed(1), {margin: '4px 8px'})
      ],
      layout: ui.Panel.Layout.flow('horizontal')
    });

    var legendTitle = ui.Label({
      value: 'Elevation (m):',
      style: {fontWeight: 'bold',fontSize:'12px'}
    });

    // Add the legendPanel to the map.
    var legendPanel = ui.Panel({widgets:[legendTitle, colorBar, legendLabels]});
    subPaneldem.add(legendPanel);
  })


  //Settings for downloading mosaics
  var geometry = ee.Geometry(getSelectedFeatures().geometry(10)).bounds();

  var url = mosaicImage.getThumbURL({
    'dimensions': 1000,
    'min': 0,
    'max': 11,
    'palette': palette,
    'region': geometry,
    'crs': 'EPSG:3857'
  });
  var urlR = mosaicImageR.getThumbURL({
    'dimensions': 1000,
    'min': 0,
    'max': 11,
    'palette': palette,
    'region': geometry,
    'crs': 'EPSG:3857'
  });
  minMax.evaluate(function(dict) {
    var urlDEM = clipDEM.getThumbURL({
      'dimensions': 1000,
      'min': dict.per1,
      'max': dict.per99,
      'palette': dem_palette,
      'region': geometry,
      'crs': 'EPSG:3857'
    });
  downloadTextDEM.setUrl(urlDEM);
  downloadTextDEM.style().set({shown: true});
  });
  downloadText.setUrl(url);
  downloadTextR.setUrl(urlR);

  //Make items visible.
  chartDesc.style().set({shown: true});
  textChart.style().set({shown: true});
  chartButton.style().set({shown: true});
  chartButton2.style().set({shown: true});
  textDownload.style().set({shown: true});
  textDownloadInfo.style().set({shown: true});
  downloadText.style().set({shown: true});
  downloadTextR.style().set({shown: true});

  /// Profile Chart Settings
  var dem_repr = clipDEM.reproject({
      crs: 'EPSG:4326',
      scale: 2
    });
  //Reproject mosaic and remap pixel values
  var from = [0,1,2,3,5,6,7,8,9,10,11];
  var to = [0,1,2,3,4,5,6,7,8,9,10];
  var mosaicL_repr = mosaicImage.reproject({
      crs: 'EPSG:4326',
      scale: 2
    }).remap(from,to);
  var mosaicR_repr = mosaicImageR.reproject({
      crs: 'EPSG:4326',
      scale: 2
    }).remap(from,to);
  //Concatenate images and convert to bands.
  concatenated = ee.ImageCollection([dem_repr,mosaicL_repr]).toBands().toFloat();
  concatenated2 = ee.ImageCollection([dem_repr,mosaicR_repr]).toBands().toFloat();
  //print(concatenated)

  //Show class palette in Panel.
  panel.widgets().get(17).style().set({shown: true});

  leftMap.centerObject(geometry,9)
}


// Add mosaic button
var mosaicButton = ui.Button({
  label: 'Generate', style: {width: '45%', stretch: 'horizontal',padding:'0px 0px 0px 10px'}
});

// Add function to the mosaic button
mosaicButton.onClick(doMosaic);

// Clears the set of selected points and resets the overlay and results
// panel to their default state.
function clearResults() {
  selectedPoints = [];
  mosaicButton = [];
  //Remove layers
  leftMap.layers().remove(leftMap.layers().get(6)); //It removes the layer #7 (Mosaic layer)
  leftMap.layers().remove(leftMap.layers().get(5)); //It removes the layer #6 (DEM layer)
  leftMap.layers().remove(leftMap.layers().get(4)); //It removes the layer #5 (Selected features)
  rightMap.layers().remove(leftMap.layers().get(6)); //It removes the layer #7 (Mosaic layer)
  rightMap.layers().remove(rightMap.layers().get(5)); //It removes the layer #6 (DEM layer)
  rightMap.layers().remove(rightMap.layers().get(4)); //It removes the layer #5 (Selected features)
  //Remove checkboxes
  layerPanel_left.widgets().remove(layerPanel_left.widgets().get(2)); //Removes checkboxes
  layerPanel_right.widgets().remove(layerPanel_right.widgets().get(2)); //Removes checkboxes
  //Reset Image Counters
  var clearLabel = ui.Label('Cleared!', {fontSize: '13px', padding:'0px 0px 0px 20px'});
  var clearLabelR = ui.Label('', {fontSize: '13px', padding:'0px 0px 0px 20px'});
  countImages.widgets().reset([clearLabel]); //Reset Number of Images Widget
  countImagesR.widgets().reset([clearLabelR]); //Reset Number of Images Widget
  //Reset DEM Bar Gradient
  var reset_subPanel = ui.Panel();
  subPaneldem.widgets().reset([reset_subPanel]);
  //Reset Selection Table Results
  var reset_buttonTable = ui.Panel();
  var reset_resultsPanel = ui.Panel();
  buttonTable.widgets().reset([reset_buttonTable]);
  resultsPanel.widgets().reset([reset_resultsPanel]);
  //Reset Chart Button and others:
  concatenated = ee.Image(); //For first chart
  var reset_subPanel2a = ui.Panel();
  subPanelChart.widgets().reset([reset_subPanel2a]);
  concatenated2 = ee.Image(); //For second chart
  var reset_subPanel2b = ui.Panel();
  subPanelChart2.widgets().reset([reset_subPanel2b]);
  //Hide items again.
  chartDesc.style().set({shown: false});
  textChart.style().set({shown: false});
  chartButton.style().set({shown: false});
  chartButton2.style().set({shown: false});
  textDownload.style().set({shown: false});
  textDownloadInfo.style().set({shown: false});
  downloadText.style().set({shown: false});
  downloadTextR.style().set({shown: false});
  downloadTextDEM.style().set({shown: false});
  //Hide class palette
  panel.widgets().get(17).style().set({shown: false});
}

// A panel containing the two buttons, including the clearResults function.
var buttonPanel = ui.Panel(
    [mosaicButton,
    ui.Button('Clear Selection', clearResults, false,
    {width:'45%',stretch:'horizontal',padding:'0px 0px 0px 10px',color: 'red'})],
    ui.Panel.Layout.Flow('horizontal'));


// Add widget to panel
panel.widgets().set(16,buttonPanel);

//clearResults();

// Function to add classes palette in panel:
var add_legend2 = function(title, lbl, pal, lbl2, pal2) {
   var legend = ui.Panel({style: {position: 'bottom-right'}}), entry;
   legend.add(ui.Label({value: title, style: {fontWeight: 'bold', fontSize: '12px', margin: '0px 0px 4px 8px', padding: '0px' } }));
   for (var x = 0; x < lbl.length; x++){
     entry = [ ui.Label({style:{fontSize: '10px', color: pal[x], margin: '0 0 4px 8px'}, value: '██'}),
       ui.Label({value: labels[x], style: {fontSize: '10px', margin: '0px 0px 4px 4px',backgroundColor: '#f3f3f3'}})];
     legend.add(ui.Panel(entry, ui.Panel.Layout.Flow('horizontal'),{backgroundColor: '#f3f3f3'}));
   }
   var legend2 = ui.Panel({style: {position: 'bottom-right'}}), entry2;
   legend2.add(ui.Label({value: '', style: {fontWeight: 'bold', fontSize: '12px', margin: '14px 0px 4px 8px', padding: '0px' } }));
   for (var y = 0; y < lbl2.length; y++){
     entry2 = [ ui.Label({style:{fontSize: '10px', color: pal2[y], margin: '0 0 4px 8px'}, value: '██'}),
       ui.Label({value: labels2[y], style: {fontSize: '10px', margin: '0px 0px 4px 4px',backgroundColor: '#f3f3f3'}})];
     legend2.add(ui.Panel(entry2, ui.Panel.Layout.Flow('horizontal'),{backgroundColor: '#f3f3f3'}));
   }
    // Put both legends in the same panel:
    panel.widgets().set(17,ui.Panel([legend,legend2],ui.Panel.Layout.Flow('horizontal'),{padding:'0px 0px 0px 60px'})); };
   //rightMap.add(legend); };

// First part of the legend:
var labels = ['01 Cloud','02 Soil','03 Water','04 Dead grass','05 Marsh'];
var lg_palette = ['FFFFFF','621E01','1F59CC','E2D924','7CCD11'];
// Second part of the legend:
var labels2 = ['06 Scrub','07 Grass','08 Forested Upland','09 Forested Wetland','10 Developed'];
var lg_palette2 = ['AD6309','27D310','106F00','1EE682','1E1E1E'];

// Run function to add legend in panel:
add_legend2('Classes:', labels, lg_palette, labels2, lg_palette2);
panel.widgets().get(17).style().set({shown: false});
//print(panel.getLayout(17))

// Create sub-panel to allocate the number of images used to create a mosaic,
// and add it to the master panel.
var countImages = ui.Panel();
var countImagesR = ui.Panel();
var countLabel = ui.Label();
var countLabelR = ui.Label();
countImages.add(countLabel);
countImagesR.add(countLabelR);
panel.widgets().set(18,countImages);
panel.widgets().set(19,countImagesR);

// Create sub-panel to allocate the DEM color bar,
// and add it to the master panel.
var subPaneldem = ui.Panel();
panel.widgets().set(20,subPaneldem);


//////  4. PROFILE CHART
/// Get generated DEM
var concatenated = ee.Image();
var concatenated2 = ee.Image();

/// Drawing transect functions (LEFT MAP)
var drawingTools = leftMap.drawingTools();
drawingTools.setShown(false);

var dummyGeometry = ui.Map.GeometryLayer({geometries: null, name: 'geometry', color: 'e00000'});
drawingTools.layers().add(dummyGeometry);

function clearGeometry() {
  var layers = drawingTools.layers();
  layers.get(0).geometries().remove(layers.get(0).geometries().get(0));
}

function drawLine() {
  clearGeometry();
  drawingTools.setShape('line');
  drawingTools.draw();
}

function createChart() {
  // Make the chart panel visible the first time a geometry is drawn.
  //if (!chartPanel.style().get('shown')) {
  //  chartPanel.style().set('shown', true);
  //}

  // Get the drawn geometry; it will define the reduction region.
  var aoi = drawingTools.layers().get(0).getEeObject();

  // Set the drawing mode back to null; turns drawing off.
  drawingTools.setShape(null);

  function sampleLinePoints(line, count) {
    var length = line.length();
    var step = line.length().divide(count);
    var distances = ee.List.sequence(0, length, step);

    function makePointFeature(coord, offset) {
      var pt = ee.Algorithms.GeometryConstructors.Point(coord);
      return new ee.Feature(pt).set('offset', offset);
    }

    var lines = line.cutLines(distances).geometries();

    var points =   lines.zip(distances).map(function(s) {
      var line = ee.List(s).get(0);
      var offset = ee.List(s).get(1);
      return makePointFeature(ee.Geometry(line).coordinates().get(0), offset);
    });

    points = points.add(makePointFeature(line.coordinates().get(-1), length));

    return new ee.FeatureCollection(points);
  }

  function getScale(image) {
    return image.projection().nominalScale().divide(ee.Projection('EPSG:4326').nominalScale());
  }

  function createProfileChart(image, line) {
    var scale = getScale(image);
    var segmentCount = aoi.length(1, 'EPSG:4326').divide(scale.multiply(28));//Pixel size 1.94 * 25.77 = 50m interval
    var points = sampleLinePoints(line, segmentCount);
    var samples = image.reduceRegions(points, ee.Reducer.first());
    var chart = ui.Chart.feature.byFeature(samples, 'offset');
    // Set chart style properties.
    var chartStyle = {
      title: 'Profile Chart: Left Map',
      series: {
        0: {targetAxisIndex: 0, type: 'line', color: '1d6b99'},
        1: {
          targetAxisIndex: 1,
          type: 'line',
          lineWidth: 0,
          pointSize: 1,
          color: 'e37d05'
          }
      },
      hAxis: {
        title: 'Transect length (m)',
        titleTextStyle: {italic: false, bold: true},
        gridlines: {color: 'FFFFFF'},
        viewWindow: {min: 0}
      },
      vAxes: {
        0: {
          title: 'Elevation (m)',
          titleTextStyle: {italic: false, bold: true},
          gridlines: {color: 'FFFFFF'},
          format: 'short',
          baselineColor: 'FFFFFF',
        },
        1: {
          title: 'Land Cover Class',
          titleTextStyle: {italic: false, bold: true},
          gridlines: {color: 'FFFFFF'},
          format: 'short',
          baselineColor: 'FFFFFF',
        }
      },
      chartArea: {backgroundColor: 'EBEBEB'},
      explorer: {}
    };
    chart.setSeriesNames(['Elevation','Land Cover Class']);
    chart.setOptions(chartStyle);
    //chart.style().set({stretch: 'both'});
    return chart;
  }

  var profileChart = createProfileChart(concatenated,aoi);

  // Replace the existing chart in the chart panel with the new chart.
  subPanelChart.widgets().reset([profileChart]);
}

drawingTools.onDraw(ui.util.debounce(createChart, 500));
drawingTools.onEdit(ui.util.debounce(createChart, 500));


/// Drawing transect functions (RIGHT MAP)
var drawingTools2 = rightMap.drawingTools();
drawingTools2.setShown(false);

var dummyGeometry2 = ui.Map.GeometryLayer({geometries: null, name: 'geometry', color: 'e00000'});
drawingTools2.layers().add(dummyGeometry2);

function clearGeometry2() {
  var layers = drawingTools2.layers();
  layers.get(0).geometries().remove(layers.get(0).geometries().get(0));
}

function drawLine2() {
  clearGeometry2();
  drawingTools2.setShape('line');
  drawingTools2.draw();
}

function createChart2() {
  // Get the drawn geometry; it will define the reduction region.
  var aoi = drawingTools2.layers().get(0).getEeObject();

  // Set the drawing mode back to null; turns drawing off.
  drawingTools2.setShape(null);

  function sampleLinePoints(line, count) {
    var length = line.length();
    var step = line.length().divide(count);
    var distances = ee.List.sequence(0, length, step);

    function makePointFeature(coord, offset) {
      var pt = ee.Algorithms.GeometryConstructors.Point(coord);
      return new ee.Feature(pt).set('offset', offset);
    }

    var lines = line.cutLines(distances).geometries();

    var points =   lines.zip(distances).map(function(s) {
      var line = ee.List(s).get(0);
      var offset = ee.List(s).get(1);
      return makePointFeature(ee.Geometry(line).coordinates().get(0), offset);
    });

    points = points.add(makePointFeature(line.coordinates().get(-1), length));

    return new ee.FeatureCollection(points);
  }

  function getScale(image) {
    return image.projection().nominalScale().divide(ee.Projection('EPSG:4326').nominalScale());
  }

  function createProfileChart2(image, line) {
    var scale = getScale(image);
    var segmentCount = aoi.length(1, 'EPSG:4326').divide(scale.multiply(28));//Pixel size 1.94 * 25.77 = 50m interval
    var points = sampleLinePoints(line, segmentCount);
    var samples = image.reduceRegions(points, ee.Reducer.first());
    var chart = ui.Chart.feature.byFeature(samples, 'offset');
    // Set chart style properties.
    var chartStyle = {
      title: 'Profile Chart: Right Map',
      series: {
        0: {targetAxisIndex: 0, type: 'line', color: '1d6b99'},
        1: {
          targetAxisIndex: 1,
          type: 'line',
          lineWidth: 0,
          pointSize: 1,
          color: 'e37d05'
          }
      },
      hAxis: {
        title: 'Transect length (m)',
        titleTextStyle: {italic: false, bold: true},
        gridlines: {color: 'FFFFFF'},
        viewWindow: {min: 0}
      },
      vAxes: {
        0: {
          title: 'Elevation (m)',
          titleTextStyle: {italic: false, bold: true},
          gridlines: {color: 'FFFFFF'},
          format: 'short',
          baselineColor: 'FFFFFF',
        },
        1: {
          title: 'Land Cover Class',
          titleTextStyle: {italic: false, bold: true},
          gridlines: {color: 'FFFFFF'},
          format: 'short',
          baselineColor: 'FFFFFF',
        }
      },
      chartArea: {backgroundColor: 'EBEBEB'},
      explorer: {}
    };
    chart.setSeriesNames(['Elevation','Land Cover Class']);
    chart.setOptions(chartStyle);
    //chart.style().set({stretch: 'both'});
    return chart;
  }

  var profileChart2 = createProfileChart2(concatenated2,aoi);

  // Replace the existing chart in the chart panel with the new chart.
  subPanelChart2.widgets().reset([profileChart2]);
}

drawingTools2.onDraw(ui.util.debounce(createChart2, 500));
drawingTools2.onEdit(ui.util.debounce(createChart2, 500));


var chartDesc = ui.Label({
  value: '4. Profile Chart:',
  style: {
    fontWeight: 'bold',
    fontSize: '15px',
    padding: '0px',
    stretch: 'horizontal',
    textAlign: 'left'}
});

var textChart = ui.Label({
    value: 'Click on the respective button to draw a transect on the map and wait for profile chart to render.'+
      ' Click button again to draw a new transect.',
    style: {
    fontSize: '13px',
    padding: '0px',
    stretch: 'horizontal',
    textAlign: 'left'}
});
var chartButton = ui.Button({
  label: 'ꟷꟷ Left Map',
  onClick: drawLine,
  style: {padding:'0px 0px 0px 60px'}
});
var chartButton2 = ui.Button({
  label: 'ꟷꟷ Right Map',
  onClick: drawLine2,
  style: {padding:'0px 0px 0px 10px'}
});

//Hide items
chartDesc.style().set({shown: false});
textChart.style().set({shown: false});
chartButton.style().set({shown: false});
chartButton2.style().set({shown: false});

// Add widgets to Panel
panel.widgets().set(21,ui.Panel([
  chartDesc,
  textChart],
  ui.Panel.Layout.flow('vertical')));
panel.widgets().set(22,ui.Panel([
  chartButton,chartButton2],
  ui.Panel.Layout.flow('horizontal')));
//panel.widgets().set(23,ui.Panel([
//  chartButton2],
//  ui.Panel.Layout.flow('horizontal')));

// Create sub-panel to allocate the profile chart,
// and add it to the master panel.
var subPanelChart = ui.Panel(); //Profile Chart Left Map
var subPanelChart2 = ui.Panel(); //Profile Chart Right Map
panel.widgets().set(24,subPanelChart);
panel.widgets().set(25,subPanelChart2);


///// DOWNLOAD MOSAIC SECTION /////

var textDownload = ui.Label({
  value: '5. Download Land Cover Mosaics and DEM (.png):',
  style: {
    fontWeight: 'bold',
    fontSize: '15px',
    padding: '0px',
    stretch: 'horizontal',
    textAlign: 'left'}
});
var textDownloadInfo = ui.Label({
    value: 'Download mosaics in png format. Max resolution is 1000x1000 pixels. The image may take some seconds/minutes'+
      ' to show up and download. Warning: There is risk of exceeding the Earth Engine capacity if the mosaic is too large, so'+
      ' it is recommended to work with one (or a few) counties at a time if you want to download images.',
    style: {
    fontSize: '13px',
    padding: '0px',
    stretch: 'horizontal',
    textAlign: 'left'}
});

// Download button
var downloadText = ui.Label({
  value: 'Left Map', style: {padding:'0px 0px 0px 20px'}
});
var downloadTextR = ui.Label({
  value: 'Right Map', style: {padding:'0px 0px 0px 20px'}
});
var downloadTextDEM = ui.Label({
  value: 'DEM', style: {padding:'0px 0px 0px 20px'}
});

//Hide items
textDownload.style().set({shown: false});
textDownloadInfo.style().set({shown: false});
downloadText.style().set({shown: false});
downloadTextR.style().set({shown: false});
downloadTextDEM.style().set({shown: false});

// Add widgets to panel
panel.widgets().set(26,ui.Panel([
  textDownload,
  textDownloadInfo],
  ui.Panel.Layout.flow('vertical')));
panel.widgets().set(27,ui.Panel([
  downloadText,
  downloadTextR,
  downloadTextDEM],
  ui.Panel.Layout.flow('horizontal')));


///// ADVANCED INTERFACE /////

var linkDesc = ui.Label({
  value: 'For Earth Engine Users:',
  style: {
    fontWeight: 'bold',
    fontSize: '15px',
    padding: '0px',
    stretch: 'horizontal',
    textAlign: 'left'}
});

var textLinkInfo = ui.Label({
    value: 'If you have a GEE account, you can use the'+
      ' advanced interface of this App, which enables complete access to the image'+
      ' collection, download of mosaics and area calculations.',
    style: {
    fontSize: '13px',
    padding: '0px',
    stretch: 'horizontal',
    textAlign: 'left'}
});

var Link = ui.Label({
    value: 'Advanced Interface',
    style: {
    fontSize: '13px',
    padding:'0px 0px 0px 80px',
    stretch: 'horizontal',
    textAlign: 'left'}
});
Link.setUrl('https://code.earthengine.google.com/08cca563bf9fc4cce30f3f8d3cff00e2');

panel.widgets().set(28,ui.Panel([
  linkDesc,
  textLinkInfo,
  Link],
  ui.Panel.Layout.flow('vertical')));

////// FINAL INFORMATION //////////
var textFinal = ui.Label({
  value: 'More Information:',
  style: {
    fontWeight: 'bold',
    fontSize: '15px',
    padding: '0px',
    stretch: 'horizontal',
    textAlign: 'left'}
});
var textFinalInfo = ui.Label({
    value: 'If you are interested in our work or want to provide feedback,'+
      ' please contact Dr. Frank Muller-Karger (carib@usf.edu) or Luis Lizcano-Sandoval (luislizcanos@usf.edu).',
    style: {
    fontSize: '13px',
    padding: '0px',
    stretch: 'horizontal',
    textAlign: 'left'}
});

panel.widgets().set(29,ui.Panel([
  textFinal,
  textFinalInfo],
  ui.Panel.Layout.flow('vertical')));

ui.root.insert(0, panel);

- 点赞
- 收藏
- 关注作者
评论(0)