利用sentinel 1和2进行指定区域逐月NDVI的监测,此过程中所用的技术要点是利用起止时间来确定每一个月的个数,从而分别计算出每一个月指定区域的NDVI。期间用到了KMEANS聚类,从而将样本点进行训练分类。
函数:
ee.Clusterer.wekaKMeans(nClusters, init, canopies, maxCandidates, periodicPruning, minDensity, t1, t2, distanceFunction, maxIterations, preserveOrder, fast, seed)
Cluster data using the k means algorithm. Can use either the Euclidean distance (default) or the Manhattan distance. If the Manhattan distance is used, then centroids are computed as the component-wise median rather than mean. For more information see:
D. Arthur, S. Vassilvitskii: k-means++: the advantages of careful seeding. In: Proceedings of the eighteenth annual ACM-SIAM symposium on Discrete algorithms, 1027-1035, 2007.
Arguments:
nClusters (Integer):
Number of clusters.
init (Integer, default: 0):
Initialization method to use.0 = random, 1 = k-means++, 2 = canopy, 3 = farthest first.
canopies (Boolean, default: false):
Use canopies to reduce the number of distance calculations.
maxCandidates (Integer, default: 100):
Maximum number of candidate canopies to retain in memory at any one time when using canopy clustering. T2 distance plus, data characteristics, will determine how many candidate canopies are formed before periodic and final pruning are performed, which might result in exceess memory consumption. This setting avoids large numbers of candidate canopies consuming memory.
periodicPruning (Integer, default: 10000):
How often to prune low density canopies when using canopy clustering.
minDensity (Integer, default: 2):
Minimum canopy density, when using canopy clustering, below which a canopy will be pruned during periodic pruning.
t1 (Float, default: -1.5):
The T1 distance to use when using canopy clustering. A value < 0 is taken as a positive multiplier for T2.
t2 (Float, default: -1):
The T2 distance to use when using canopy clustering. Values < 0 cause a heuristic based on attribute std. deviation to be used.
distanceFunction (String, default: "Euclidean"):
Distance function to use. Options are: Euclidean & Manhattan
maxIterations (Integer, default: null):
Maximum number of iterations.
preserveOrder (Boolean, default: false):
Preserve order of instances.
fast (Boolean, default: false):
Enables faster distance calculations, using cut-off values. Disables the calculation/output of squared errors/distances
seed (Integer, default: 10):
The randomization seed.
Returns: Clusterer
代码:
// 定义研究区
var roi=geometry;
Map.centerObject(roi,10);
//定义时间
var startDate = ee.Date('2019-01-01');
var endDate = ee.Date('2020-12-31');
//S2影像的设定
// 为2019-2020年期间创建S2图像集。
var S2 = ee.ImageCollection('COPERNICUS/S2')
//filter start and end date
.filter(ee.Filter.date(startDate, endDate))
.filterMetadata('CLOUDY_PIXEL_PERCENTAGE', 'less_than',100)//云量小于100
//filter according to drawn boundary边界筛选
.filterBounds(roi)
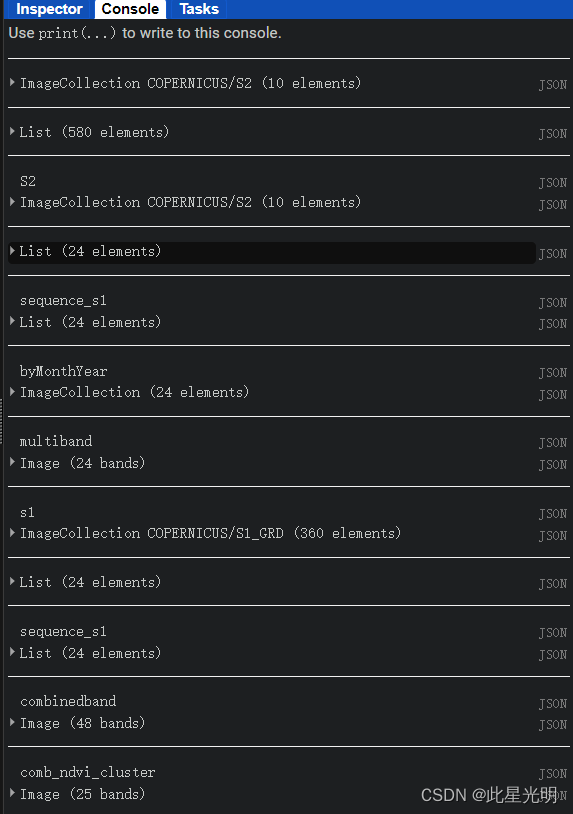
print(S2.limit(10))
print(S2.aggregate_array('SPACECRAFT_NAME'))
// Function to calculate and add an NDVI band NDVI函数
var addNDVI = function(image) {
return image.addBands(image.normalizedDifference(['B8', 'B4'] )); //'B8', 'B4'
};
// Add NDVI band to image collection 对影像集合进行NDVI计算并且选择器NDVI波段
var S2 = S2.map(addNDVI).select(['nd']);
print('S2',S2.limit(10)) ;
var NDVI=S2.select('nd');
// For month
var month = 1;
// 计算区间数,这里用了一个很简单的方法进行了时间的获取
var months = endDate.difference(startDate,'month').divide(month).toInt();
//建立时间序列
var sequence = ee.List.sequence(0, months);
print(sequence)
var sequence_s1 = sequence.map(function(num){
//数字化其变量
num = ee.Number(num);
//中间间隔的时间设定,开始时间和就是默认的时间,终止时间往后加一个月
var Start_interval = startDate.advance(num.multiply(month), 'month');
var End_interval = startDate.advance(num.add(1).multiply(month), 'month');
//按照上面的时间进行影像筛选
var subset = NDVI.filterDate(Start_interval,End_interval);
//获取子集的最大值,然后设定时间属性,因为在计算了max之后时间贤惠能干会丢失
return subset.max().set('system:time_start',Start_interval);
});
print('sequence_s1',sequence_s1)
//将上面的影像子集放入到影像集合中
var byMonthYear = ee.ImageCollection.fromImages(sequence_s1);
print('byMonthYear',byMonthYear)
//这里有一个非常实用的函数将一个影像集合转化为一个单波段的影像
var multibandNDVI = byMonthYear.toBands().clip(roi);
print('multiband',multibandNDVI);
//定义时间波段,将上面的子集命名的波段改名
var bandsName=['2019-01','2019-02','2019-03','2019-04','2019-05','2019-06',
'2019-07','2019-08','2019-09','2019-10','2019-11','2019-12',
'2020-01','2020-02','2020-03','2020-04','2020-05','2020-06',
'2020-07','2020-08','2020-09','2020-10','2020-11','2020-12']
var multiband1_ndvi = multibandNDVI.rename(bandsName).clip(roi);//(monList)//
//s1影像的设定,基本步骤同上
var sentinel1_vh = ee.ImageCollection('COPERNICUS/S1_GRD')
.filter(ee.Filter.listContains('transmitterReceiverPolarisation', 'VH'))
.select('VH')
.filter(ee.Filter.eq('instrumentMode', 'IW'))
.filter(ee.Filter.eq('resolution_meters', 10))
.filter(ee.Filter.date(startDate, endDate))
.filter(ee.Filter.bounds(roi))
print('s1',sentinel1_vh);
// For month
var month = 1;
// Calculating number of intervals计算所有的月数
var months = endDate.difference(startDate,'month').divide(month).toInt();
// Generating a sequence //建立一个所有月份的时间序列
var sequence = ee.List.sequence(0, months);
print(sequence)
var sequence_s1 = sequence.map(function(num){
num = ee.Number(num);
var Start_interval = startDate.advance(num.multiply(month), 'month');
var End_interval = startDate.advance(num.add(1).multiply(month), 'month');
var subset = sentinel1_vh.filterDate(Start_interval,End_interval);
return subset.median().set('system:time_start',Start_interval);
});
print('sequence_s1',sequence_s1)
var byMonthYearS1 = ee.ImageCollection.fromImages(sequence_s1);
var multibands1 = byMonthYearS1.toBands().clip(roi);
//多波段重命名
var multibands1 = multibands1.rename(bandsName).clip(roi);//.rename(monLists1).clip(roi);//
//将S1和S2合并
var combinedband=multiband1_ndvi.addBands(multibands1);
print('combinedband',combinedband);
//将影像进行采样
var training = combinedband.sample({
region: roi,
scale: 10,
numPixels: 3000,
tileScale:8,
// geometries:true
});
//Map.addLayer(training,{},'points')
//这里用Kmeans分类器进行训练
var clusterer = ee.Clusterer.wekaKMeans(20).train({
features:training
});
//使用经过训练的聚类器对输入进行聚类。
var result_cluster =combinedband.cluster(clusterer).byte();//combands
// print('result_s2',result_s2)
//设定分类数量
var clusters = [0, 1, 2, 3, 4,5,6,7,8,9,
10,11,12,13,14,15,16,17,18,19,
20,21,22,23,24,25,26,27,28,29];
var values0 = [1, 2, 3, 4,5,
6,7,8,9,10,
11,12,13,14,15,
16,17,18,19,20,
21,22,23,24,25,26,27,28,29,30];
var values1 = [0, 0, 0, 1,0,
1,0,1,0,0,
0,0,1,0,0,
1,1,0,0,0,
0,0,0,0,0,
0,0,0,0,0];
/*
var values1 = [0, 0, 0, 0,1,
0,1,0,1,0,
0,0,0,1,0,
0,1,1,0,0,
0,0,0,0,0,
0,0,0,0,0];
*/
var values2 = [0, 0, 0, 2,0,
3,0,4,0,0,
0,0,1,0,0,
2,3,0,0,0,
0,0,0,4,0,
0,0,0,0,0];
/*
var values2 = [0, 0, 0, 0, 2,0,
3,0,4,0,0,
0,0,1,0,0,
2,3,0,0,0,
0,0,0,4,0,
0,0,0,0];
*/
//这里根据定义的value值进行重新赋值映射,
//var result_cluster = result_cluster.remap(clusters,values0);
var remapped_cluster = result_cluster.rename('remapped');// .remap(clusters, values0).byte().clip(roi);//.updateMask(slope.lt(slope_th))
var remapped_cluster1=remapped_cluster.remap(values0,values1);
var remapped_cluster1=remapped_cluster1.updateMask(remapped_cluster1);
var remapped_cluster2=remapped_cluster.remap(values0,values2).updateMask(remapped_cluster1);
//
///
var comb_ndvi_cluster=multiband1_ndvi.addBands(remapped_cluster);
print("comb_ndvi_cluster",comb_ndvi_cluster);
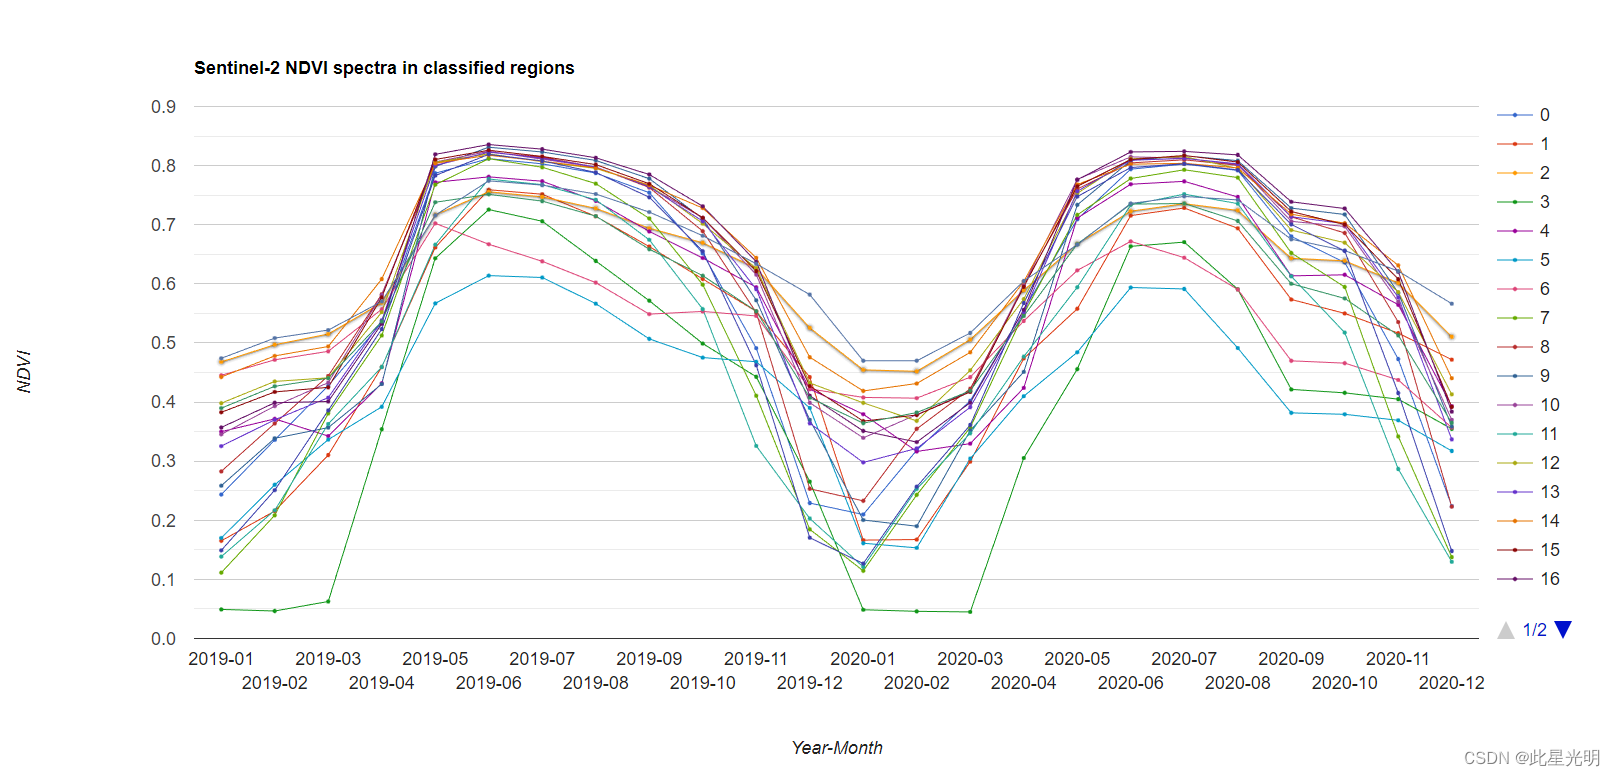
// 定义图表的定制选项。
var options = {
lineWidth: 1,
pointSize: 2,
hAxis: {title: 'Year-Month'},
vAxis: {title: 'NDVI'},
title: 'Sentinel-2 NDVI spectra in classified regions'
};
// 制作图表,设置选项。
var chart_class_ndvi = ui.Chart.image.byClass(
comb_ndvi_cluster, 'remapped', roi, ee.Reducer.median(), 500)//, classNames, wavelengths)
.setOptions(options)
.setChartType('ScatterChart');
// Print the chart.
//print(chart_class_ndvi);
//
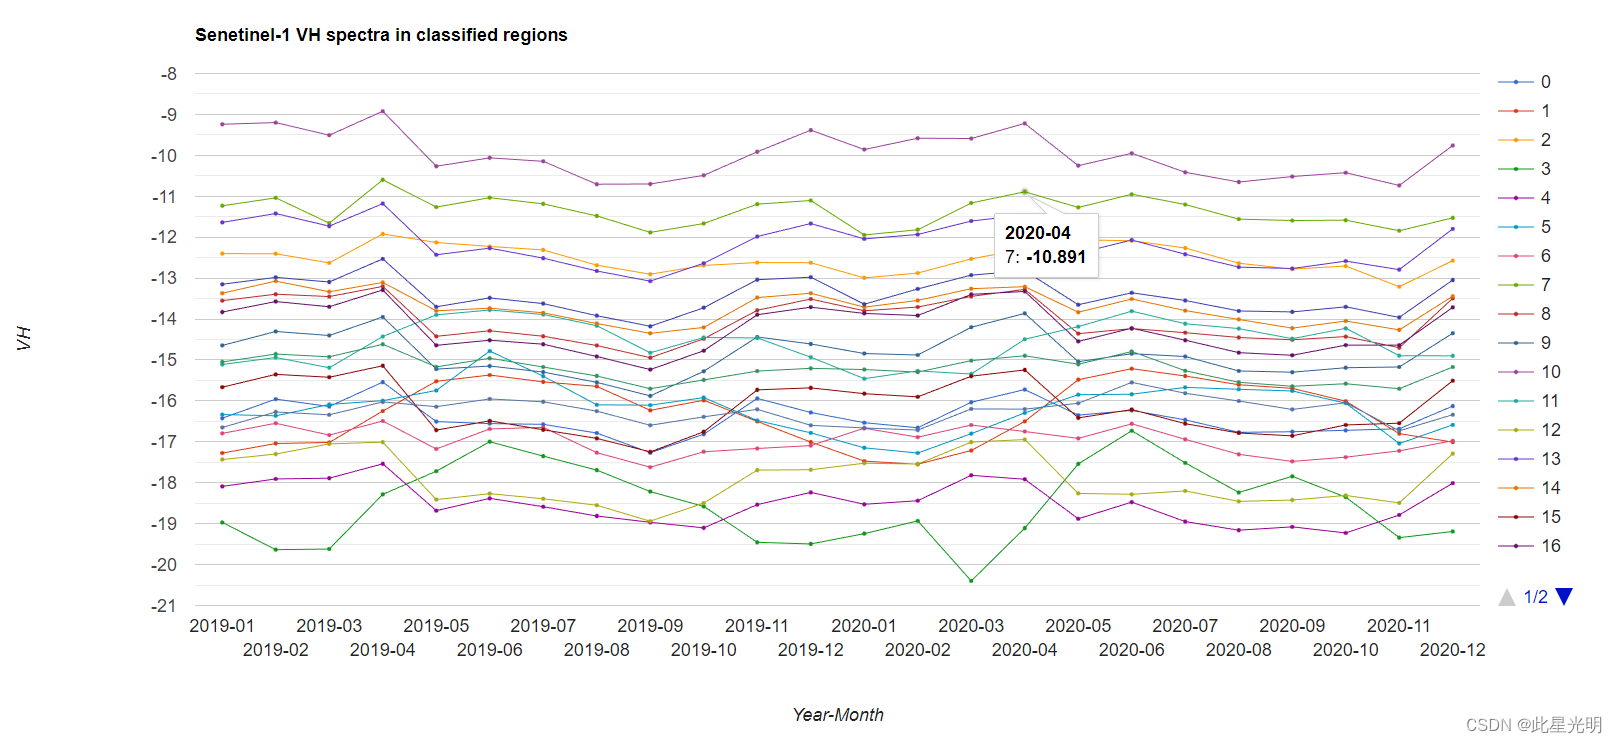
var comb_vh_cluster=multibands1.addBands(remapped_cluster);
print("comb_vh_cluster",comb_vh_cluster);
// Define chart customization options.
var options = {
lineWidth: 1,
pointSize: 2,
hAxis: {title: 'Year-Month'},
vAxis: {title: 'VH'},
title: 'Senetinel-1 VH spectra in classified regions'
};
// Make the chart, set the options.
var chart_class_vh = ui.Chart.image.byClass(
comb_vh_cluster, 'remapped', roi, ee.Reducer.median(), 500)//, classNames, wavelengths)
.setOptions(options)
.setChartType('ScatterChart');
// Print the chart.
//print(chart_class_vh);
Map.addLayer(multiband1_ndvi , {min: 0.2, max: 0.8}, 'NDVI',0);
Map.addLayer(multibands1 , {min: -25, max: -10}, 'VH',0);
Map.addLayer(remapped_cluster.randomVisualizer(), {}, 're_groups_s2',0);
Map.addLayer(remapped_cluster1, {min:1,max:1,palette:['white','red']}, 'binary_rice',1);
Map.addLayer(remapped_cluster2.randomVisualizer(), {}, 'pattern_rice',1);
///
// 在地图旁边创建一个面板
var panel = ui.Panel({style:{width: '550px'}});
ui.root.add(panel);
// value: 'SENTINEL-2 NDVI & SENTINEL-1 VH Explorer',
var label1 = ui.Label({
value: 'SENTINEL-2 NDVI & SENTINEL-1 VH Explorer: Paddy Clustering',
style: {
//fontSize: '20px',
color: 'white',
backgroundColor :'blue',
// border: '1px solid black',
// fontWeight: 'bold',
padding: '5px',
margin: '12px 0px 0px 8px', fontWeight: 'bold', fontSize: '14px', border: '1px solid black',
padding: '5px 5px 5px 5px',
}
// style: {
// fontSize: '16px',
// color: 'red',
// fontWeight: 'bold',
// padding: '5px',
// }
});
var label2 = ui.Label({
value: 'Developed by Rudiyanto',
style: {
fontSize: '16px',
color: 'red',
// fontWeight: 'bold',
padding: '5px',
}
});
var affiliationLabel= ui.Label('Instructions',{fontWeight: 'bold',padding: '3px',});
var affiliation= ui.Label(
"Program of Crop Science\n"+
"Faculty of Fisheries and Food Science\n"+
"Universiti Malaysia Terengganu\n"+
"Email: rudiyanto@umt.edu.my\n"
, {whiteSpace:'pre',padding: '5px',fontSize: '16px',
color: 'red',
// fontWeight: 'bold',
}
);
var affiliationPanel = ui.Panel([affiliationLabel,affiliation]);
var affiliationPanel = ui.Panel([affiliation]);
panel.add(label1);
panel.add(label2);
panel.add(affiliationPanel);
panel.add(chart_class_ndvi);
panel.add(chart_class_vh);


评论(0)