uniapp使用echarts
【摘要】 <script> export default(){ data(){ return{ salary:[], hyDataList:[], industry:[], ratio:[{name:'',value:''}], widths:'' } }, methods:{ searchJobZx(){ this.com...
<script>
	export default(){
		data(){
			return{
				salary:[],
				hyDataList:[],
				industry:[],
				ratio:[{name:'',value:''}],
                widths:''
			}
		},
		methods:{
			searchJobZx(){
				this.commitd='';
				this.$axios.post('地址',{id:this.univerSityId}).then((result)=>{
					if(result.status){
						//查出渲染echarts的数据
						this.settingZLineImg();
					}
				})
			},
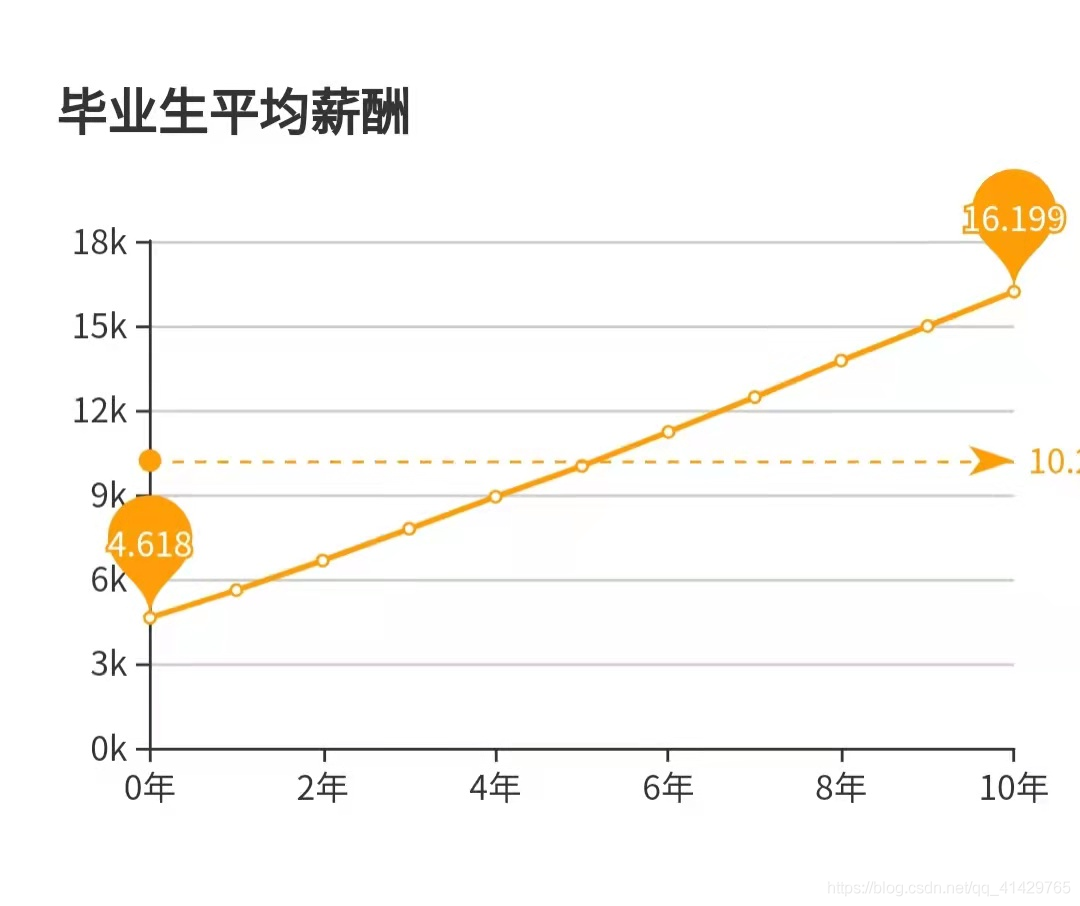
			settingZLineImg(){
				this.optionLine={
						title: {
							text: '毕业生平均薪酬',
							left:'left'
						},
						tooltip: {
							trigger: 'axis'
						},
						color:['#FF9D05'],

						xAxis: {
							type: 'category',
							boundaryGap: false,
							data: this.salary
						},
						yAxis: {
							type: 'value',
							axisLabel: {
								formatter: '{value}k'
							}
						},
						series: [
							{
								name: '薪资',
								type: 'line',
								data: this.hyDataList,
								markPoint: {
									data: [
										{type: 'max', name: '最大值'},
										{type: 'min', name: '最小值'}
									]
								},
								markLine: {
									data: [
										{type: 'average', name: '平均值'}
									]
								}
							}
						]
					}
				 this.settingBImg();
			},
			//设置行业分布的饼状图
			settingBImg(){
				this.optionB={
					title: {
						text: '行业分布',
						left: 'center'
					},
					tooltip: {
						trigger: 'axis',
						formatter: '{a} <br/>{b} : {c} ({d}%)'
					},
					legend: {
						bottom: 20,
						left: 'center',
						data:this.industry
					},
					 color: ['#FF9F7F','#9FE6B8','#32C5E9','#FEC20A','#412F2E','#0099FF','#FF0000','#C759FF','#19A033','#0C0C59'],
					series: [
						{
							type: 'pie',
							radius: '65%',
							center: ['50%', '36%'],
							selectedMode: 'single',
							data: this.ratio,

							emphasis: {
								itemStyle: {
									shadowBlur: 10,
									shadowOffsetX: 0,
									shadowColor: 'rgba(0, 0, 0, 0.5)'
								}
							},
							label:{
								normal: {
									position: 'inner',
									formatter:'{c}%'
								}
							},
							labelLine: {
								normal: {
									show: false // show设置线是否显示,默认为true,可选值:true ¦ false
								}
							}
						},
					],
				}
				//渲染完毕将值设置为1
				this.commitd='1'
			}
		},
		onLoad(){
			uni.getSystemInfo({
				success:res=>{
					//获取屏幕宽度设置echarts的宽
					this.widths=res.windowWidth
				}
			})
		}
    }
</script>
在uniapp中是无法直接引用echarts的所以使用uniapp的预渲染renderjs,同一个页面写两个script
<script module="echarts" lang="renderjs">
let myChartB, myChartZ,myChartL
	export default {
		mounted() {
			// // 动态引入较大类库避免影响页面展示
			this.zyx();
		},
		methods: {
		    zyx(){
                //由于我一次性需要渲染三个echarts所有需要将一层层的echarts嵌套渲染,
                //渲染完毕将this.commitd设置为‘1’所以需要在正式初始化echarts的时候需要作下判断
				if (typeof window.echarts === 'function'&&this.commitd==='1') {
						this.initEcharts()
				} else {
					// 动态引入较大类库避免影响页面展示
					const script = document.createElement('script')
					// view 层的页面运行在 www 根目录,其相对路径相对于 www 计算
					script.src = 'static/echarts.js'
					script.onload = this.initEcharts.bind(this)
					document.head.appendChild(script)
				}
			},
			initEcharts() {
				  myChartB = echarts.init(document.getElementById('radiusImg'))
			      myChartB.setOption(this.optionB)
				  myChartZ=  echarts.init(document.getElementById('zhuZImg'))
				  myChartZ.setOption(this.optionZImg)
				  myChartL=  echarts.init(document.getElementById('lineImg'))
			      myChartL.setOption(this.optionLine)
			},
			updateDailyChart(newValue, oldValue, ownerInstance, instance){
				myChartB = echarts.init(document.getElementById('radiusImg'))
				myChartB.setOption(this.optionB)
				myChartZ=  echarts.init(document.getElementById('zhuZImg'))
				myChartZ.setOption(this.optionZImg)
				myChartL=  echarts.init(document.getElementById('lineImg'))
				myChartL.setOption(this.optionLine)
			},

			onClick(event, ownerInstance) {
				// 调用 service 层的方法
				ownerInstance.callMethod('onViewClick', {
					test: 'test'
				})
			}
		},
	}
</script>
<!-- 设置行业的饼状图 -->
<view id="radiusImg" class="echarts b" :style="'width:'+widths+'px'"
:prop="optionB" @click="echarts.onClick"
:change:prop="echarts.updateDailyChart">
</view>
<!-- <radio-echart ref="radioE"></radio-echart> -->
<!-- 设置折线图 -->
<view id="lineImg" class="echarts" :style="'width:'+widths+'px'"
:prop="optionLine" @click="echarts.onClick"
:change:prop="echarts.updateDailyChart"></view>.echarts {
margin-top: 100rpx;
height: 300px;
}
.echarts.b{
height:900rpx;
}
【声明】本内容来自华为云开发者社区博主,不代表华为云及华为云开发者社区的观点和立场。转载时必须标注文章的来源(华为云社区)、文章链接、文章作者等基本信息,否则作者和本社区有权追究责任。如果您发现本社区中有涉嫌抄袭的内容,欢迎发送邮件进行举报,并提供相关证据,一经查实,本社区将立刻删除涉嫌侵权内容,举报邮箱:
cloudbbs@huaweicloud.com
- 点赞
- 收藏
- 关注作者


评论(0)