海量数据模拟


作者: 西魏陶渊明 博客: https://blog.springlearn.cn/ (opens new window)
西魏陶渊明
莫笑少年江湖梦,谁不少年梦江湖
# 一、创建表
-
create table dept
-
(
-
dno int(5) primary key default 0,
-
dname varchar(20) not null default '',
-
loc varchar(30) default ''
-
) engine =innodb default charset=utf8;
-
-
create table emp
-
(
-
eid int(5) primary key,
-
ename varchar(20) not null default '',
-
job varchar(20) not null default '',
-
deptno int(5) not null default 0
-
) engine =innodb default charset=utf8;
-

# 二、存储函数插入海量数量
存储过程无return,存储函数有。
# 1. 创建存储函数生成id和name
name随机字符串
-
delimiter $
-
create function randstring(n int) returns varchar(255)
-
begin
-
declare all_str varchar(100) default 'abcdefghijklmnopqrstuvwxyzABCDEFGHIJKLMNOPQRSTUVWXYZ';
-
declare return_str varchar(255) default '';
-
declare i int default 0;
-
while i <n
-
do
-
set return_str = concat(return_str,substring(all_str,rand()*52,1));
-
set i = i+1;
-
end while;
-
return return_str;
-
end $
ERROR 1418 (HY000): This function has none of DETERMINISTIC, NO SQL, or READS SQL DATA in its declaration and binary logging is enabled (you *might* want to use the less safe log_bin_trust_function_creators variable)
如果开启了慢慢查询日志,在开启存储函数就会冲突,解决办法1就是管理慢日志查询。
解决办法2:
show variables like '%log_bin_trust_function_creators%';
set global log_bin_trust_function_creators=1;
id随机数
-
delimiter $
-
create function rand_num()returns int(5)
-
begin
-
declare i int default 0;
-
set i = floor(rand() * 100);
-
return i;
-
end $;
# 2. 通过存储过程插入海量数据emp
-
create procedure insert_emp(in eid_start int(10),in data_times int(10))
-
begin
-
declare i int default 0;
-
set autocommit = 0;
-
repeat
-
insert into emp values(eid_start + i,randstring(5),'other',rand_num());
-
set i = i + 1;
-
until i = data_times
-
end repeat;
-
commit;
-
end $;
# 2. 通过存储过程插入海量数据dept
-
create procedure insert_dept(in dno_start int(10),in data_times int(10))
-
begin
-
declare i int default 0;
-
set autocommit = 0;
-
repeat
-
insert into dept values(dno_start+i,randstring(6),randstring(8));
-
set i = i + 1;
-
until i = data_times
-
end repeat;
-
commit;
-
end$
# 3. 插入海量数据
delimiter ;分割符改回原来
员工表插入80w条数据 call insert_emp(1000,800000); 部门表插入30条数据 call insert_dept(10,30);
-
mysql> select count(1) from emp;
-
+----------+
-
| count(1) |
-
+----------+
-
| 800000 |
-
+----------+
-
1 row in set (0.05 sec)
-
-
mysql> select count(1) from dept;
-
+----------+
-
| count(1) |
-
+----------+
-
| 30 |
-
+----------+
-
1 row in set (0.00 sec)
# 三、利用profiles分析海量数据
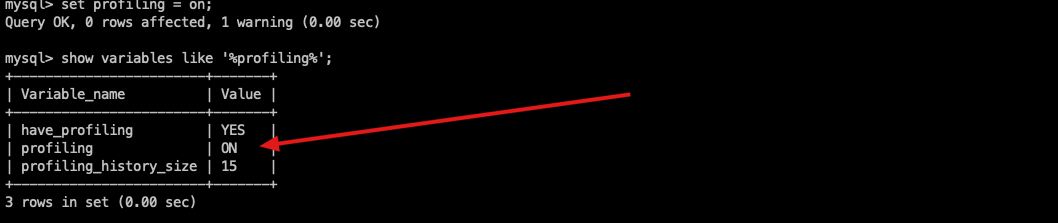
# 1. 打开profiles
-
set profiling = on;
-
show variables like '%profiling%';
-
-
mysql> set profiling = on;
-
Query OK, 0 rows affected, 1 warning (0.00 sec)
-
-
mysql> show variables like '%profiling%';
-
+------------------------+-------+
-
| Variable_name | Value |
-
+------------------------+-------+
-
| have_profiling | YES |
-
| profiling | ON |
-
| profiling_history_size | 15 |
-
+------------------------+-------+
-
3 rows in set (0.00 sec)
# 2. 查询每条耗时
profiles会记录每个sql的耗时
-
mysql> show profiles;
-
+----------+------------+-----------------------------------+
-
| Query_ID | Duration | Query |
-
+----------+------------+-----------------------------------+
-
| 1 | 0.00164000 | show variables like '%profiling%' |
-
| 2 | 0.04513900 | select count(1) from emp |
-
| 3 | 0.00056200 | select count(1) from dept |
-
+----------+------------+-----------------------------------+
-
3 rows in set, 1 warning (0.00 sec)
但是这样不能精确匹配到耗时在哪里。此时可以使用profile精确来分析sql
# 3. 精确查询耗时
精确 根据上面的Query_ID来精确查找 show profile all for query 2;
-
+--------------------------------+----------+----------+------------+-------------------+---------------------+--------------+---------------+---------------+-------------------+-------------------+-------------------+-------+-------------------------+----------------------+-------------+
-
| Status | Duration | CPU_user | CPU_system | Context_voluntary | Context_involuntary | Block_ops_in | Block_ops_out | Messages_sent | Messages_received | Page_faults_major | Page_faults_minor | Swaps | Source_function | Source_file | Source_line |
-
+--------------------------------+----------+----------+------------+-------------------+---------------------+--------------+---------------+---------------+-------------------+-------------------+-------------------+-------+-------------------------+----------------------+-------------+
-
| starting | 0.000106 | 0.000094 | 0.000012 | 0 | 0 | 0 | 0 | 0 | 0 | 0 | 0 | 0 | NULL | NULL | NULL |
-
| Executing hook on transaction | 0.000008 | 0.000004 | 0.000004 | 0 | 0 | 0 | 0 | 0 | 0 | 0 | 0 | 0 | launch_hook_trans_begin | rpl_handler.cc | 1106 |
-
| starting | 0.000013 | 0.000010 | 0.000002 | 0 | 0 | 0 | 0 | 0 | 0 | 0 | 0 | 0 | launch_hook_trans_begin | rpl_handler.cc | 1108 |
-
| checking permissions | 0.000009 | 0.000007 | 0.000003 | 0 | 0 | 0 | 0 | 0 | 0 | 0 | 0 | 0 | check_access | sql_authorization.cc | 2202 |
-
| Opening tables | 0.000047 | 0.000045 | 0.000002 | 0 | 0 | 0 | 0 | 0 | 0 | 0 | 0 | 0 | open_tables | sql_base.cc | 5587 |
-
| init | 0.000012 | 0.000008 | 0.000003 | 0 | 0 | 0 | 0 | 0 | 0 | 0 | 0 | 0 | execute | sql_select.cc | 661 |
-
| System lock | 0.000014 | 0.000012 | 0.000003 | 0 | 0 | 0 | 0 | 0 | 0 | 0 | 0 | 0 | mysql_lock_tables | lock.cc | 332 |
-
| optimizing | 0.000010 | 0.000007 | 0.000002 | 0 | 0 | 0 | 0 | 0 | 0 | 0 | 0 | 0 | optimize | sql_optimizer.cc | 213 |
-
| statistics | 0.000037 | 0.000023 | 0.000014 | 0 | 0 | 0 | 0 | 0 | 0 | 0 | 1 | 0 | optimize | sql_optimizer.cc | 423 |
-
| preparing | 0.000025 | 0.000023 | 0.000003 | 0 | 0 | 0 | 0 | 0 | 0 | 0 | 0 | 0 | optimize | sql_optimizer.cc | 497 |
-
| executing | 0.000007 | 0.000004 | 0.000003 | 0 | 0 | 0 | 0 | 0 | 0 | 0 | 0 | 0 | exec | sql_executor.cc | 228 |
-
| Sending data | 0.044768 | 0.072019 | 0.003191 | 0 | 810 | 0 | 0 | 0 | 0 | 0 | 9 | 0 | exec | sql_executor.cc | 304 |
-
| end | 0.000018 | 0.000009 | 0.000010 | 0 | 0 | 0 | 0 | 0 | 0 | 0 | 0 | 0 | execute | sql_select.cc | 714 |
-
| query end | 0.000006 | 0.000004 | 0.000002 | 0 | 0 | 0 | 0 | 0 | 0 | 0 | 0 | 0 | mysql_execute_command | sql_parse.cc | 4520 |
-
| waiting for handler commit | 0.000013 | 0.000011 | 0.000001 | 0 | 0 | 0 | 0 | 0 | 0 | 0 | 0 | 0 | ha_commit_trans | handler.cc | 1533 |
-
| closing tables | 0.000009 | 0.000008 | 0.000002 | 0 | 0 | 0 | 0 | 0 | 0 | 0 | 0 | 0 | mysql_execute_command | sql_parse.cc | 4566 |
-
| freeing items | 0.000026 | 0.000012 | 0.000013 | 0 | 0 | 0 | 0 | 1 | 0 | 0 | 0 | 0 | mysql_parse | sql_parse.cc | 5237 |
-
| cleaning up | 0.000011 | 0.000009 | 0.000002 | 0 | 0 | 0 | 0 | 0 | 0 | 0 | 0 | 0 | dispatch_command | sql_parse.cc | 2147 |
-
+--------------------------------+----------+----------+------------+-------------------+---------------------+--------------+---------------+---------------+-------------------+-------------------+-------------------+-------+-------------------------+----------------------+-------------+
-
18 rows in set, 1 warning (0.00 sec)
我们可以看到信息太多了,我们其实只用关系几列的数据就行了。
-
mysql> show profile cpu,block io for query 2;
-
+--------------------------------+----------+----------+------------+--------------+---------------+
-
| Status | Duration | CPU_user | CPU_system | Block_ops_in | Block_ops_out |
-
+--------------------------------+----------+----------+------------+--------------+---------------+
-
| starting | 0.000106 | 0.000094 | 0.000012 | 0 | 0 |
-
| Executing hook on transaction | 0.000008 | 0.000004 | 0.000004 | 0 | 0 |
-
| starting | 0.000013 | 0.000010 | 0.000002 | 0 | 0 |
-
| checking permissions | 0.000009 | 0.000007 | 0.000003 | 0 | 0 |
-
| Opening tables | 0.000047 | 0.000045 | 0.000002 | 0 | 0 |
-
| init | 0.000012 | 0.000008 | 0.000003 | 0 | 0 |
-
| System lock | 0.000014 | 0.000012 | 0.000003 | 0 | 0 |
-
| optimizing | 0.000010 | 0.000007 | 0.000002 | 0 | 0 |
-
| statistics | 0.000037 | 0.000023 | 0.000014 | 0 | 0 |
-
| preparing | 0.000025 | 0.000023 | 0.000003 | 0 | 0 |
-
| executing | 0.000007 | 0.000004 | 0.000003 | 0 | 0 |
-
| Sending data | 0.044768 | 0.072019 | 0.003191 | 0 | 0 |
-
| end | 0.000018 | 0.000009 | 0.000010 | 0 | 0 |
-
| query end | 0.000006 | 0.000004 | 0.000002 | 0 | 0 |
-
| waiting for handler commit | 0.000013 | 0.000011 | 0.000001 | 0 | 0 |
-
| closing tables | 0.000009 | 0.000008 | 0.000002 | 0 | 0 |
-
| freeing items | 0.000026 | 0.000012 | 0.000013 | 0 | 0 |
-
| cleaning up | 0.000011 | 0.000009 | 0.000002 | 0 | 0 |
-
+--------------------------------+----------+----------+------------+--------------+---------------+
-
18 rows in set, 1 warning (0.01 sec)
-
-
mysql>
# 4. 全局查询日志
仅仅在调优和开发中使用,生产要关闭
show variables like '%general_log%';
开启全局日志记录并将sql都写入到表中
-
set global general_log = 1;
-
set global log_output = 'table';
-
mysql> show variables like '%general_log%';
-
+------------------+------------------------------------+
-
| Variable_name | Value |
-
+------------------+------------------------------------+
-
| general_log | OFF |
-
| general_log_file | /usr/local/var/mysql/localhost.log |
-
+------------------+------------------------------------+
-
2 rows in set (0.01 sec)
-
-
mysql> set global general_log = 1;
-
Query OK, 0 rows affected (0.00 sec)
-
-
mysql> show variables like '%general_log%';
-
+------------------+------------------------------------+
-
| Variable_name | Value |
-
+------------------+------------------------------------+
-
| general_log | ON |
-
| general_log_file | /usr/local/var/mysql/localhost.log |
-
+------------------+------------------------------------+
-
2 rows in set (0.01 sec)
开启之后就可以在mysql库中的general_log表中进行查询
select * from mysql.general_log; 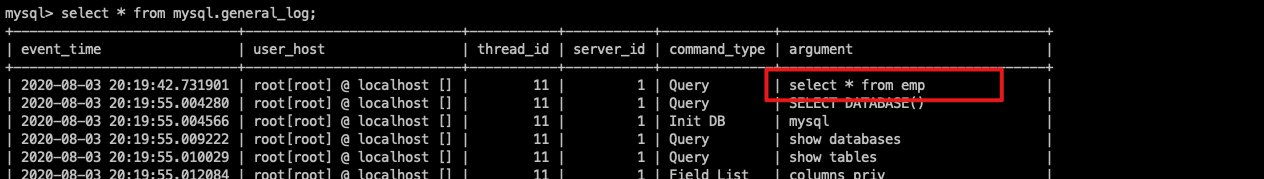
将sql设置到文件中
-
set global general_log = 1;
-
set global log_output = 'file';
-
set global general_log_file='/Users/liuxin/general.log';

最后求关注,求订阅,谢谢你的阅读!
文章来源: springlearn.blog.csdn.net,作者:西魏陶渊明,版权归原作者所有,如需转载,请联系作者。
原文链接:springlearn.blog.csdn.net/article/details/125857977

- 点赞
- 收藏
- 关注作者
评论(0)