python利用open3d以及mayavi可视化pcd点云(二进制)

【摘要】
pcd点云的存储形式一共有两种,分别是binary和ascll码的形式,其详解见https://blog.csdn.net/qq_37534947/article/details/107187907 下面...
pcd点云的存储形式一共有两种,分别是binary和ascll码的形式,其详解见https://blog.csdn.net/qq_37534947/article/details/107187907
下面的代码是针对两者的,即都可以适用。
前期准备:
open3d的安装:
pip install open3d
pip install open3d-python==0.7.0.0 (这个必须有)
mayavi的安装:
需要顺序安装的包vtk、mayavi
这里推荐whl下载,因为pip直接安装vtk比较慢,下载地址:
https://download.csdn.net/download/qq_37534947/12515312
#binary
import open3d as o3d
import numpy as np
import numpy as np
import mayavi.mlab
def read_pcd(file_path1):
    pcd = o3d.io.read_point_cloud(file_path1)
    #pcd2 = o3d.io.read_point_cloud(file_path2)
    print(np.asarray(pcd.points))
    #print(np.asarray(pcd2.points))
    #colors = np.asarray(pcd.colors) * 255
    pointcloud = np.asarray(pcd.points)
    #pointcloud2 = np.asarray(pcd2.points)
    print(pointcloud.shape)
    #print(pointcloud2.shape)
    x = pointcloud[:, 0]  # x position of point
    xmin = np.amin(x, axis=0)
    xmax = np.amax(x, axis=0 )
    y = pointcloud[:, 1]  # y position of point
    ymin = np.amin(y, axis=0)
    ymax = np.amax(y, axis=0)
    z = pointcloud[:, 2]  # z position of point
    zmin = np.amin(z, axis=0)
    zmax = np.amax(z, axis=0)
    print(xmin,xmax,ymin,ymax,zmin,zmax)
    d = np.sqrt(x ** 2 + y ** 2)  # Map Distance from sensor
    vals = 'height'
    if vals == "height":
        col = z
    else:
        col = d
    fig = mayavi.mlab.figure(bgcolor=(0, 0, 0), size=(640, 500))
    mayavi.mlab.points3d(x, y, z,
                         col,  # Values used for Color
                         mode="point",
                         # 灰度图的伪彩映射
                         colormap='spectral',  # 'bone', 'copper', 'gnuplot'
                         # color=(0, 1, 0),   # Used a fixed (r,g,b) instead
                         figure=fig,
                         )
    # 绘制原点
    mayavi.mlab.points3d(0, 0, 0, color=(1, 1, 1), mode="sphere",scale_factor=0.2)
    # 绘制坐标
    axes = np.array(
        [[20.0, 0.0, 0.0, 0.0], [0.0, 20.0, 0.0, 0.0], [0.0, 0.0, 20.0, 0.0]],
        dtype=np.float64,
    )
    #x轴
    mayavi.mlab.plot3d(
        [0, axes[0, 0]],
        [0, axes[0, 1]],
        [0, axes[0, 2]],
        color=(1, 0, 0),
        tube_radius=None,
        figure=fig,
    )
    #y轴
    mayavi.mlab.plot3d(
        [0, axes[1, 0]],
        [0, axes[1, 1]],
        [0, axes[1, 2]],
        color=(0, 1, 0),
        tube_radius=None,
        figure=fig,
    )
    #z轴
    mayavi.mlab.plot3d(
        [0, axes[2, 0]],
        [0, axes[2, 1]],
        [0, axes[2, 2]],
        color=(0, 0, 1),
        tube_radius=None,
        figure=fig,
    )
    mayavi.mlab.show()

#mayavi显示点云
read_pcd("pcdfolder/Benewake_Horn_X2_PointCloud_0023.pcd")#,"pcdfolder/Benewake_Horn_X2_PointCloud_0001.pcd")
- 1
- 2
- 3
- 4
- 5
- 6
- 7
- 8
- 9
- 10
- 11
- 12
- 13
- 14
- 15
- 16
- 17
- 18
- 19
- 20
- 21
- 22
- 23
- 24
- 25
- 26
- 27
- 28
- 29
- 30
- 31
- 32
- 33
- 34
- 35
- 36
- 37
- 38
- 39
- 40
- 41
- 42
- 43
- 44
- 45
- 46
- 47
- 48
- 49
- 50
- 51
- 52
- 53
- 54
- 55
- 56
- 57
- 58
- 59
- 60
- 61
- 62
- 63
- 64
- 65
- 66
- 67
- 68
- 69
- 70
- 71
- 72
- 73
- 74
- 75
- 76
- 77
- 78
分析:
1)这里open3d的主要作用是打开pcd格式的文件,然后存储到pcd 变量中,可以从shape中看到其大小是(x,3),其中x是指点云的个数。
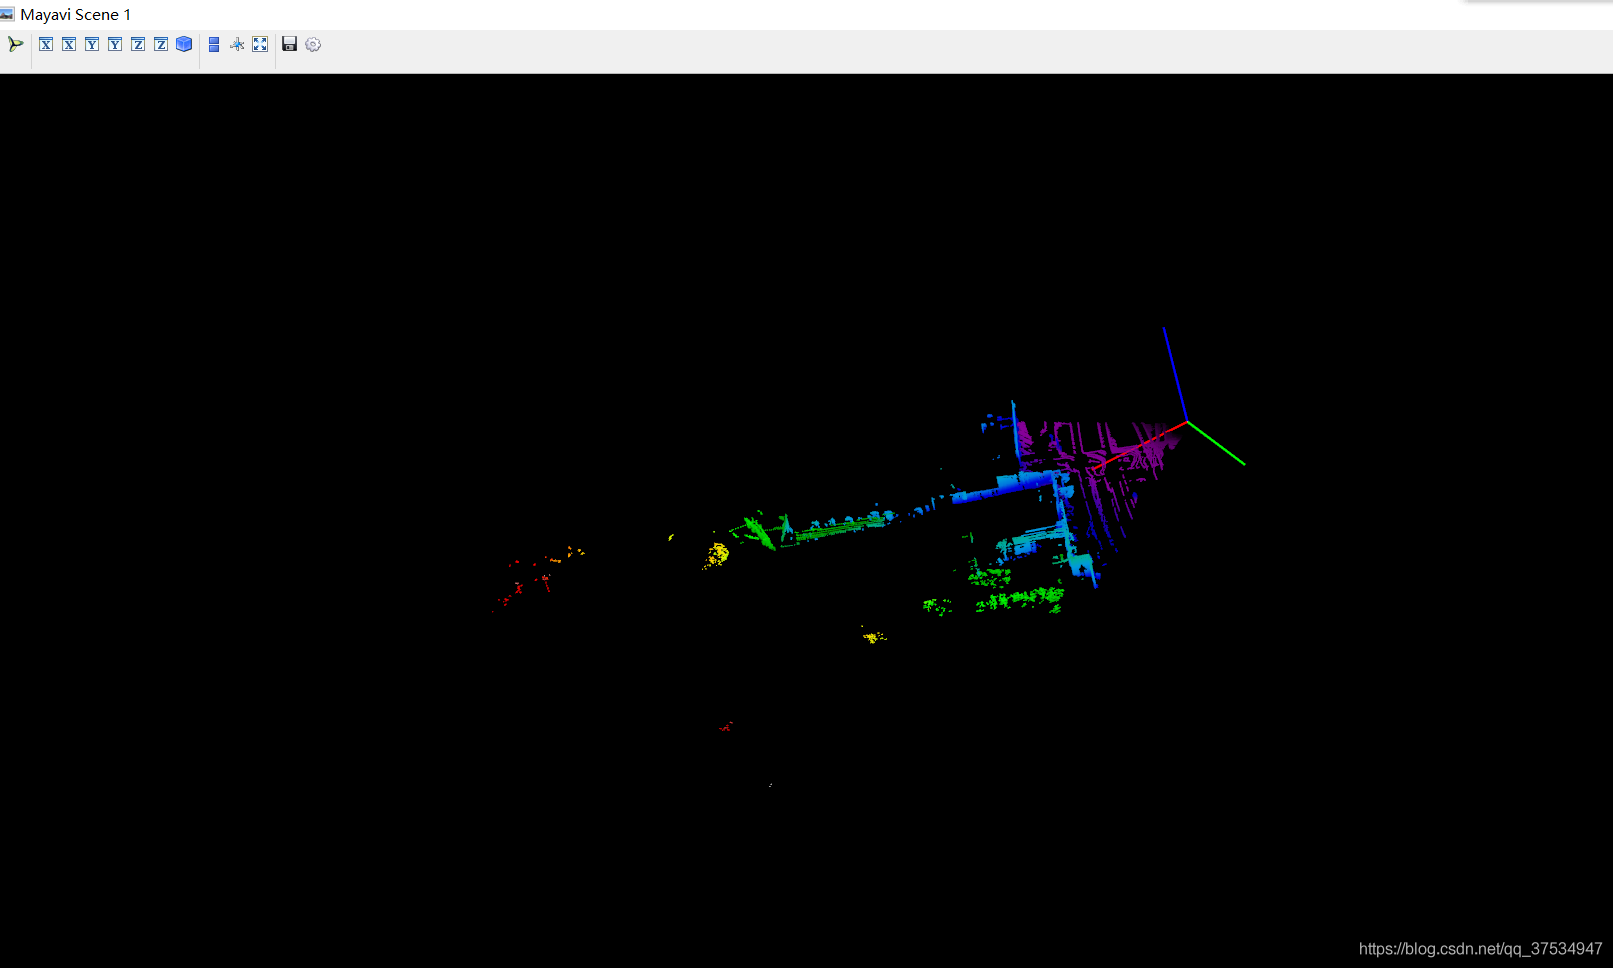
2)mayavi主要是用于显示点云,其中包括显示所有的点以及绘制横坐标以及纵坐标和绘制原点等。
其使用参考链接:
https://www.cnblogs.com/dalanjing/p/12289517.html
https://www.cnblogs.com/ssyfj/p/9303698.html
结果截图:
文章来源: blog.csdn.net,作者:Studying_swz,版权归原作者所有,如需转载,请联系作者。
原文链接:blog.csdn.net/qq_37534947/article/details/107183646

【版权声明】本文为华为云社区用户转载文章,如果您发现本社区中有涉嫌抄袭的内容,欢迎发送邮件进行举报,并提供相关证据,一经查实,本社区将立刻删除涉嫌侵权内容,举报邮箱:
cloudbbs@huaweicloud.com
- 点赞
- 收藏
- 关注作者
评论(0)