通俗易懂的Latex教程文档

本篇文档可以搭配视频讲解使用。
讲解视频:
通俗易懂的Latex教程(附数学建模国赛美赛模板)
完整视频:https://www.bilibili.com/video/BV1aT4y1f74w
这是一份面向刚入门数模,想要快速上手Latex排版的同学的Latex教学文档。
在线编辑网站overleaf:https://www.overleaf.com/
我所使用的环境:TeX Live (自带编辑器TeXworks)
编辑器:TeXstudio
TeX Live和TeXstudio的安装
首先来看看TeX Live和TeXstudio的安装。
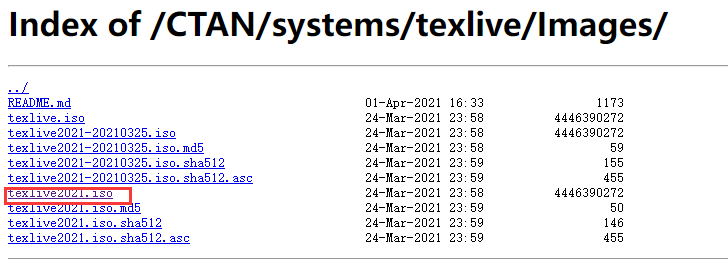
TeX Live安装镜像下载:
https://mirrors.ustc.edu.cn/CTAN/systems/texlive/Images/
点击下载texlive2021.iso文件
TeXstudio的安装包下载:
http://texstudio.sourceforge.net/
国外服务器下载较慢,特此放上我备份的文件链接
texlive: https://pan.baidu.com/s/1LPuqPjdl6AI8-AZTCIGBEg?pwd=8888
TeXstudio:https://pan.baidu.com/s/1Rzlij_NH5eAZ0FB1J8gKFw?pwd=8888
下载之后的安装配置可以参考博文:
https://blog.csdn.net/UCB001/article/details/112546694
Latex基本框架
\documentclass{article}
\usepackage[UTF8]{ctex}

\begin{document}
文件内容
\end{document}
- 1
- 2
- 3
- 4
- 5
- 6
标题
Latex标题层级:
- section
- subsection
- subsubsection
- paragraph
- subparagraph
一级标题
\section{一级标题内容}
- 1
二级标题
\subsection{二级标题内容}
- 1
三级标题
\subsubsection{三级标题内容}
- 1
sub:下一级
目录
\tableofcontents
- 1
分页
\newpage
- 1
列表
无序列表:
\begin{itemize}
	\item 第一点内容
	\item 第二点内容
	\item 第三点内容
\end{itemize}
- 1
- 2
- 3
- 4
- 5
有序列表:
\begin{enumerate}
	\item 第一点内容
	\item 第二点内容
	\item 第三点内容
\end{enumerate}
- 1
- 2
- 3
- 4
- 5
字体设置
字体加粗:
\textbf{加粗的字体}
- 1
斜体:
\textit{倾斜的字体}
- 1
下划线:
\underline{}
- 1
行内缩进:
\hspace{0.65em}
- 1
段内间隔:
\vspace{2ex}
- 1
图片
需要使用两个宏包
\usepackage{float} %设置图片浮动位置的宏包
\usepackage{graphicx} %插入图片的宏包
\usepackage{subfigure} %插入多图时用子图显示的宏包
- 1
- 2
- 3
单张图片:
\begin{figure}[H]
	\centering
	\includegraphics[width=8cm]{../pic/p.png}% 图片相对位置
	\caption{这里是图片的标题} % 图片标题
\end{figure}
- 1
- 2
- 3
- 4
- 5
多张图片(以两张图片为例):
\begin{figure}[H]
	\centering
	\subfigure[子图一的标题]{				% 图片1([]内为子图标题)
		\includegraphics[width=0.45\textwidth]{../pic/p.png}}% 子图1的相对位置
	\subfigure[子图二的标题]{				% 图片2
		\includegraphics[width=0.45\textwidth]{../pic/p.png}}% 子图2的相对位置
	\caption{总图标题}		% 总图标题
\end{figure}
- 1
- 2
- 3
- 4
- 5
- 6
- 7
- 8
多张图片(以三张图片为例):
\begin{figure}[H]
	\centering
	\subfigure[子图一的标题]{				% 图片1([]内为子图标题)
		\includegraphics[width=0.3\textwidth]{../pic/p.png}}% 子图1的相对位置
	\subfigure[子图二的标题]{				% 图片2
		\includegraphics[width=0.3\textwidth]{../pic/p.png}}% 子图2的相对位置
	\subfigure[子图三的标题]{				% 图片2
		\includegraphics[width=0.3\textwidth]{../pic/p.png}}% 子图3的相对位置
	\caption{总图标题}		% 总图标题
\end{figure}
- 1
- 2
- 3
- 4
- 5
- 6
- 7
- 8
- 9
- 10
注:图片的标题是在下面,表格的标题是在上面。
公式
带公式标号:
\begin{equation}

\end{equation}
- 1
- 2
- 3
不带公式标号:
$$ 公式内容 $$
- 1
或者:
\[公式内容\]
- 1
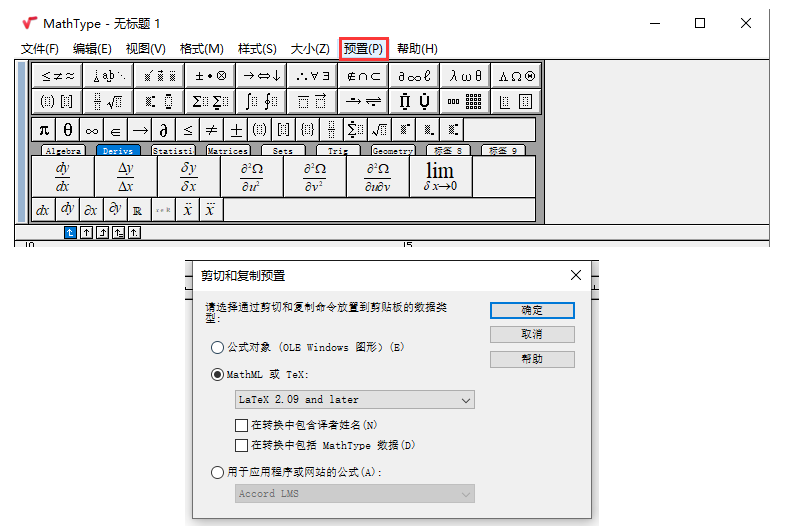
公式复制神器:MathType
剪切和复制预置
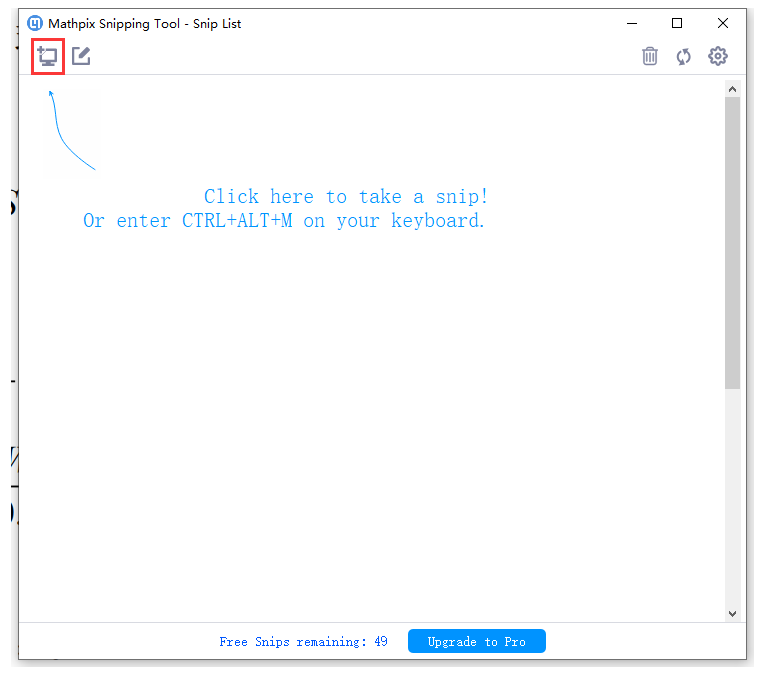
公式识别神器:Mathpix
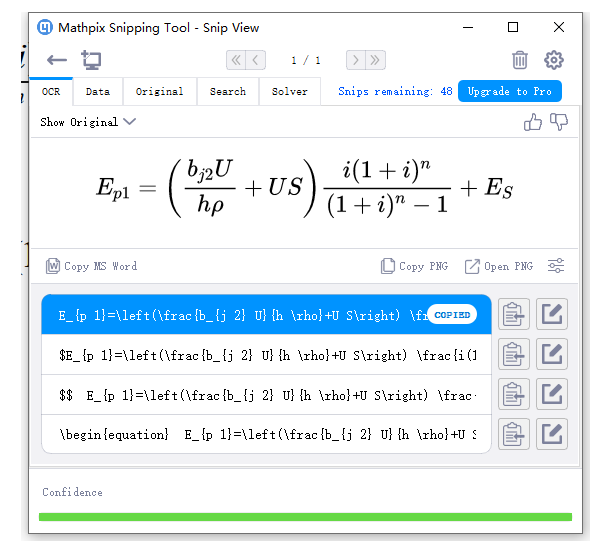
注:有时候公式中会出现加粗的字母,这时候识别的公式会报错,此时需导入宏包:
\usepackage{amsmath}
- 1
表格
符号说明:
\begin{table}[H]
	\centering
	\caption{符号说明}
	\begin{tabular}{cc}
		\hline
		\makebox[0.3\textwidth][c]{符号}	&  \makebox[0.4\textwidth][c]{意义} \\ \hline
		$L_n$	    & 经度\\ \hline
		$L_a$	    & 纬度 \\ \hline
	\end{tabular}
\end{table}
- 1
- 2
- 3
- 4
- 5
- 6
- 7
- 8
- 9
- 10
注:c表示水平居中,l表示左对齐,r表示右对齐,|表示竖线,hline表示横线。
表格表注插入
引入宏包:
\usepackage{threeparttable}
- 1
在end{tabular}上插入:
	\begin{tablenotes}
		\footnotesize
		\item 注:由于篇幅有限,这里仅展示部分数据。
	\end{tablenotes}
- 1
- 2
- 3
- 4
表格过宽自适应页面
遇到可以表格过宽跳出页面的情况,可在tabular外面套一层
\resizebox{\linewidth}{!}{tabular}
- 1
使用案例:
\begin{table}[H]
	\scriptsize
	\caption{Table of evaluation indicators}
	\resizebox{\linewidth}{!}{
	\begin{tabular}{|c|c|ccc|}
		\hline
		\rowcolor[HTML]{DAE8FC}
		Target layer                                                                                                             & Guideline layer                                                                                         & \multicolumn{3}{c|}{\cellcolor[HTML]{DAE8FC}Indicator layer}                                             \\ \hline
		{\color[HTML]{000000} }                                                                                                  &                                                                                                         & \multicolumn{1}{c|}{territorial area+}                                & \multicolumn{1}{c|}{D1}  & 0.0703 \\ \cline{3-5}
		{\color[HTML]{000000} }                                                                                                  & \multirow{-2}{*}{\begin{tabular}[c]{@{}c@{}}Natural factors\\ C1 = 0.1145\end{tabular}}                 & \multicolumn{1}{c|}{territorial sea area+}                            & \multicolumn{1}{c|}{D2}  & 0.0442 \\ \cline{2-5}
		{\color[HTML]{000000} }                                                                                                  &                                                                                                         & \multicolumn{1}{c|}{restrictive decrees+}                             & \multicolumn{1}{c|}{D3}  & 0.1004 \\ \cline{3-5}
		{\color[HTML]{000000} }                                                                                                  & \multirow{-2}{*}{\begin{tabular}[c]{@{}c@{}}Policy factors\\ C2 = 0.2008\end{tabular}}                  & \multicolumn{1}{c|}{taxation policies+}                               & \multicolumn{1}{c|}{D4}  & 0.1004 \\ \cline{2-5}
		{\color[HTML]{000000} }                                                                                                  &                                                                                                         & \multicolumn{1}{c|}{investment in recycling technology+}              & \multicolumn{1}{c|}{D5}  & 0.1004 \\ \cline{3-5}
		{\color[HTML]{000000} }                                                                                                  &                                                                                                         & \multicolumn{1}{c|}{number of waste treatment plants+}                & \multicolumn{1}{c|}{D6}  & 0.1003 \\ \cline{3-5}
		{\color[HTML]{000000} }                                                                                                  & \multirow{-3}{*}{\begin{tabular}[c]{@{}c@{}}Economy factors\\ C3 = 0.3011\end{tabular}}                 & \multicolumn{1}{c|}{share of secondary and tertiary sectors(in GDP)-} & \multicolumn{1}{c|}{D7}  & 0.1004 \\ \cline{2-5}
		{\color[HTML]{000000} }                                                                                                  & \begin{tabular}[c]{@{}c@{}}Population factors\\ C4 = 0.0473\end{tabular}                                & \multicolumn{1}{c|}{population density-}                              & \multicolumn{1}{c|}{D8}  & 0.0473 \\ \cline{2-5}
		{\color[HTML]{000000} }                                                                                                  &                                                                                                         & \multicolumn{1}{c|}{plastics demand-}                                 & \multicolumn{1}{c|}{D9}  & 0.0354 \\ \cline{3-5}
		{\color[HTML]{000000} }                                                                                                  & \multirow{-2}{*}{\begin{tabular}[c]{@{}c@{}}Plastic alternatives factors\\ C5 = 0.1358\end{tabular}}    & \multicolumn{1}{c|}{Cross-Price Elasticity of Demand+}                & \multicolumn{1}{c|}{D10} & 0.1004 \\ \cline{2-5}
		{\color[HTML]{000000} }                                                                                                  &                                                                                                         & \multicolumn{1}{c|}{civic education level+}                           & \multicolumn{1}{c|}{D11} & 0.1004 \\ \cline{3-5}
		\multirow{-12}{*}{{\color[HTML]{000000} \begin{tabular}[c]{@{}c@{}}Plastic \\ \\  Waste \\   \\ Reduction\end{tabular}}} & \multirow{-2}{*}{\begin{tabular}[c]{@{}c@{}}Environmental awareness factors\\ C6 = 0.2008\end{tabular}} & \multicolumn{1}{c|}{government publicity level+}                      & \multicolumn{1}{c|}{D12} & 0.1004 \\ \hline
	\end{tabular}}
	\begin{tablenotes}
		\item[1] Note: + for positive indicators (developmental indicators), - for negative indicators (restrictive indicators)
	\end{tablenotes}
\end{table}
- 1
- 2
- 3
- 4
- 5
- 6
- 7
- 8
- 9
- 10
- 11
- 12
- 13
- 14
- 15
- 16
- 17
- 18
- 19
- 20
- 21
- 22
- 23
- 24
- 25
表格添加颜色
直接用网格网站添加颜色会报错,此时需导入宏包:
\usepackage[table]{xcolor}
- 1
绘制三线表
绘制三线表可以灵活运用\toprule,\midrule两个添加线的指令
使用案例:
\begin{table}[H]
	\centering
	\caption{Table of properties of different plastics}
	\begin{tabular}{c c c}
		\toprule
		\textbf{Type} & \textbf{Average life-time}(year) & \textbf{Production rate}(billion/year) \\
		\midrule
		PETE & 0.5 & 1.06 \\
		LDPE & 2.3 & 0.94 \\
		PS & 1.4 & 0.89 \\
		\bottomrule
	\end{tabular}
\end{table}
- 1
- 2
- 3
- 4
- 5
- 6
- 7
- 8
- 9
- 10
- 11
- 12
- 13
注:生成三线表时,可能会报错,此时需引入宏包:
\usepackage{multirow}
- 1
实用网站:
2、https://www.tablesgenerator.com/
参考文献
\begin{thebibliography}{9}%宽度9
	\bibitem{1} 姜启源,谢金星,叶俊.数学模型(第四版)[M].北京:高等教育出版社,2011.
	\bibitem{2} 参考文献2.
\end{thebibliography}
- 1
- 2
- 3
- 4
引用参考文献
首先设置:
\newcommand{\upcite}[1]{\textsuperscript{\textsuperscript{\cite{#1}}}}
- 1
引用:
\upcite{1}
- 1
特殊符号的插入
插入格式:
$..$
- 1
符号大全:
https://www.caam.rice.edu/~heinken/latex/symbols.pdf
附录:插入美化的代码块
导入两个宏包:
\usepackage{listings}
\usepackage{xcolor}
- 1
- 2
使用模块(代码内容替换成自己的内容即可):
\lstset{language=python}

\lstset{
	numbers=left,
	numberstyle= \tiny,
	keywordstyle= \color{ blue!70},
	commentstyle= \color{red!50!green!50!blue!50},
	frame=shadowbox, % 阴影效果
	rulesepcolor= \color{ red!20!green!20!blue!20} ,
	escapeinside=``, % 英文分号中可写入中文
	breaklines=true,
	xleftmargin=2em, aboveskip=1em,
	framexleftmargin=2em
}
\noindent 对sonar数据集分类的代码如下:
\begin{lstlisting}
代码内容
\end{lstlisting}
- 1
- 2
- 3
- 4
- 5
- 6
- 7
- 8
- 9
- 10
- 11
- 12
- 13
- 14
- 15
- 16
- 17
- 18
注,若代码中有中文注释,需作如下调整:
在菜单栏中的“选项”,进行下图设置
设置页面为A4纸大小
latex默认的页面较窄,通过下面的代码能将页面设置成A4纸大小。
\usepackage{geometry}
\geometry{
	a4paper,
	total={170mm,257mm},
	left=20mm,
	top=20mm,
}
- 1
- 2
- 3
- 4
- 5
- 6
- 7
注释
Texstudio快捷键
多行注释:Ctrl+T
多行解注释::Ctrl+U
模板使用
模板可在群文件中进行下载。使用详情见视频。
国赛模板
美赛模板
交流群:710413249
问题Q&A
下面整理了一些群友常问的问题,这里做一个统一回答和记录。
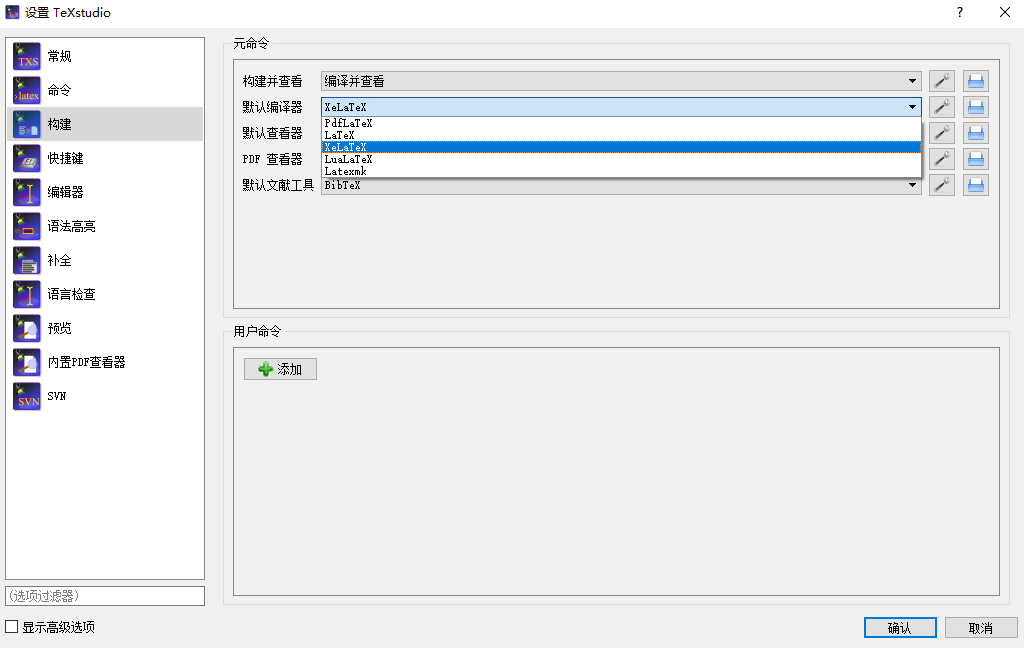
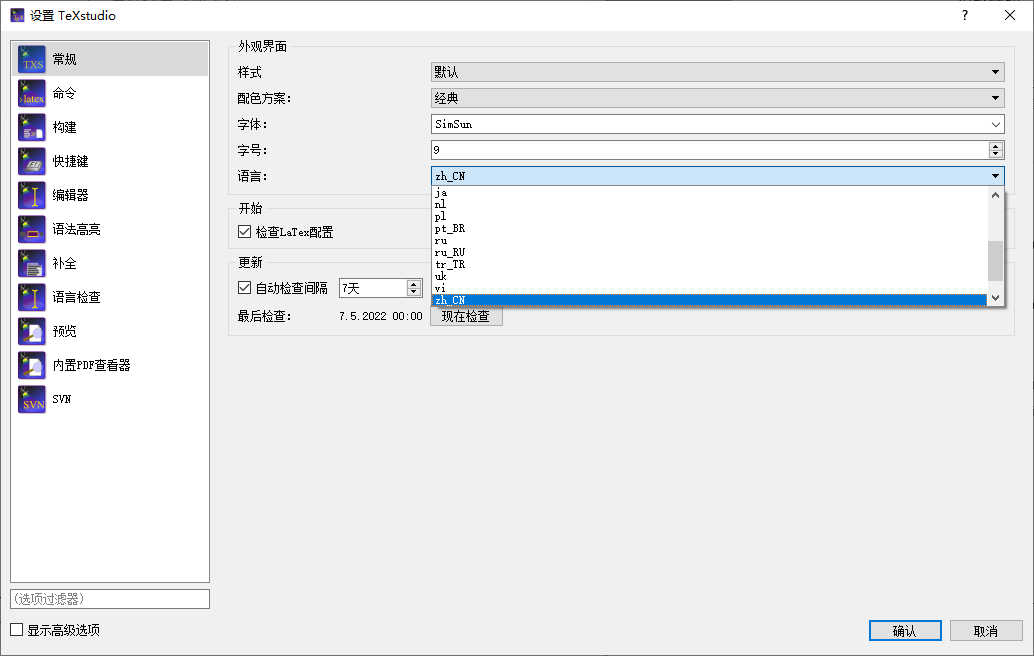
1.TeXstudio怎么设置为中文
选项->设置TeXstudio
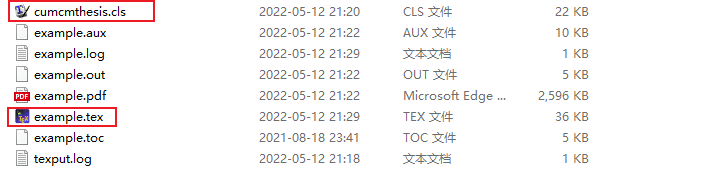
2.报错File `cumcmthesis.cls’ not found.
这个报错的意思是找不到cumcmthesis.cls这个文件,这个文件是配置文件,里面设置了各章节的结构/类型,使用模板需保证其在和.tex的同文件夹下。
3.想修改页码怎么办?
有的比赛规定摘要页不包括页码,从正文第一页开始标号。
这里可以在\begin{abstract}下方添加命令
\thispagestyle{empty}
- 1
这个命令表示清空当前页的页码号
然后再在正文第一页的section中添加命令
\setcounter{page}{1}
- 1
这个命令表示页码从当前页从1开始重新计数
4.如何取消标题序号?
Latex默认会添加标题,可通过在标题后面加*的方式,取消标题序号
例如:
\section* {Introduction}
- 1
5.如何添加副标题?
副标题就是在题目下面加一行小字,以美赛模板为例,可在title这里这样进行修改:
\title{A Glimpse of Music Change through Influence Networks
\normalsize this is subtitle}
- 1
- 2
更多字号参考:

6.国赛模板目录标题重合Bug?
正常来说国赛模板没问题,不过在Section超过10个之后,会存在目录序号和标题重合的问题,如图:

模板没有考虑到有人的小节会超过10个,遇到这种问题时,首先要想想是否是自己的论文过于细分了,数模通常来说不会超过五个问题,加上一些模型假设、灵敏度分析这类的内容,总数也不会超过十个。如果遇到超过5个的问题,可以按照我经验分享里提到的小技巧,将多个问题进行合并。
言归正传,如果实在无法压缩,还是有办法解决这个问题。
方法一:在后面重合的标题前加空格
注意Latex中直接加空格是无效的,可以用\quad符号来表示1em的水平空格
例如:
\section{$\quad$模型的三次推广}
- 1
效果如下:

方法二:统一设置目录中Section和序号之间的间距
在\documentclass下面添加命令:
\dottedcontents{section}[2em]{\normalsize}{2.5em}{4pt}
- 1
效果如下:

这样做会连带把模板中的字体也进行修改,个人觉得不如方法一美观。
7.国赛模板如何修改目录间距/更改目录字体大小?
如果说,修改目录间距/修改字体大小的目的是为了让目录显示在一页上,那可以采用问题4的技巧,取消某些小标题的序号,因为模板默认情况是比较美观的,修改可能会破坏美感。
如果实在需要修改,也可以采用下面的办法。
在国赛模板的配置文件cumcmthesis.cls中最下方注释了有关目录样式的设置。可以通过图示中的方式进行修改。

另外附上Latex中字体大小设置选项:
从小到大顺序依次为:
\tiny, \scriptsize, \footnotesize, \small, \normalsize, \large, \Large, \LARGE, \huge, \Huge
8.国赛模板参考文献如何根据引用顺序自动生成
原模板参考文献为手动添加,要实现自动按引用顺序生成需使用到BibTeX这种引用格式。
使用方式,在参考文献部分添加两句
\bibliographystyle{unsrt}
\bibliography{reference}
- 1
- 2
第一句的unsrt指定的是引用类型,还有其它可选形式:
- plain-此格式的参考文献的条目的编号是按照作者的字母顺序
- unsrt – 基本上跟 plain 类型一样,此格式的参考文献的条目的编号是按照引用的顺序,而不是按照作者的字母顺序
- alpha – 类似于 plain 类型,当参考文献的条目的编号基于作者名字和出版年份的顺序
- abbrv – 缩写格式
第二句的reference是对应reference.bib文件
引用时,新建reference.bib文件,在内部复制BibTeX的格式的参考文献。例如,在百度学术/谷歌学术上,点击引用,可直接导出这种格式信息。正文引用时,使用\upcite{xxx},xxx对应BibTeX@article中第一个内容。
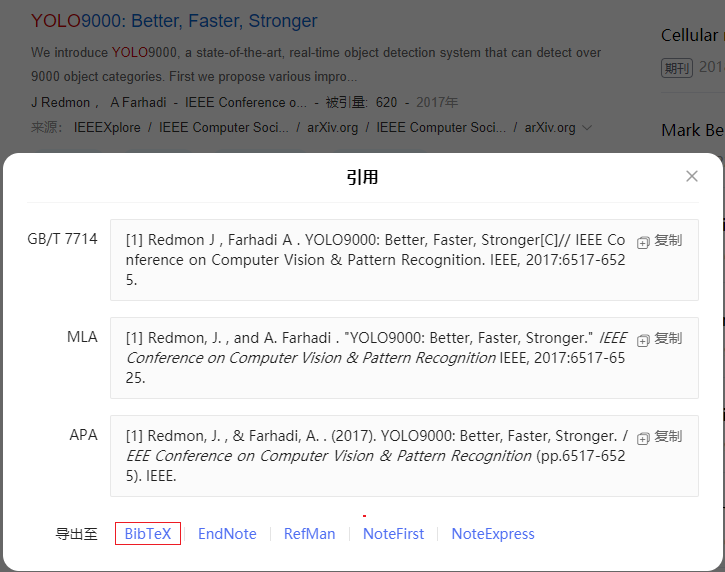
注,知网无法直接导出这种格式,需借助Zotero等工具转换。
国赛模板已更新,可在群文件->论文模板下载Latex国赛模板v2.0(新增bib文献添加方式).zip
9.“如图x所示”这个x能否自动对应图表标号
在论文中,如果调换图的顺序,图的标号会自动变化,有没有办法让论文里的文字也对应图的标号发生变化。方法是在图里面添加\label{fig:value},这个value为自定义的变量名,在外面用\ref{fig:value}引用即可,示例:
如图\ref{fig:value}所示:
\begin{figure}[H]
	\small
	\centering
	\includegraphics[width=8cm]{../../img/1.png}
	\caption{图表标题}
	\label{fig:value}
\end{figure}
- 1
- 2
- 3
- 4
- 5
- 6
- 7
- 8
写在最后
希望群友能踊跃提问,群内已开匿名功能,如果不好意思提问,可以匿名提问,正是在提出问题和解决问题的过程中,这篇文档能够得以更加丰富。
文章来源: zstar.blog.csdn.net,作者:zstar-_,版权归原作者所有,如需转载,请联系作者。
原文链接:zstar.blog.csdn.net/article/details/120615302

- 点赞
- 收藏
- 关注作者
评论(0)