【雷达通信】基于matlab雷达目标生成和检测【含Matlab源码 1938期】
一、获取代码方式
获取代码方式1:
完整代码已上传我的资源:【雷达通信】基于matlab雷达目标生成和检测【含Matlab源码 1938期】
获取代码方式2:
通过订阅紫极神光博客付费专栏,凭支付凭证,私信博主,可获得此代码。
备注:
订阅紫极神光博客付费专栏,可免费获得1份代码(有效期为订阅日起,三天内有效);
二、简介
现代雷达在工作过程中, 为了兼顾同时多种模式的功能或者为了提高抗干扰性能, 对某组回波信号进行剔除处理, 导致了雷达接收到的回波信号是不连续的, 这种非连续采样会导致雷达回波信号在某个距离单元上对目标进行检测出现严重的栅瓣问题, 因此如何利用接收到的少量回波信息对回波信号进行恢复, 从而实现对目标的有效检测是近年来研究热点问题。
1 CA-CFAR算法
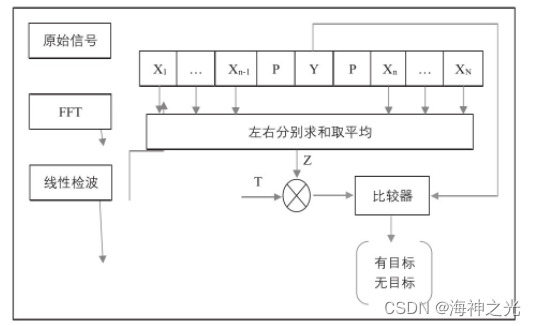
CA-CFAR(均值类CFAR)算法的核心思想是通过对参考窗内的采样数据取平均来估计背景噪声功率。事实上,目标峰值并不在一个单元上,而是在一些范围单元上有所延伸,目标相邻的数个单元不作为背景杂波的估计,作为保护单元P。对于每个单元格,T是常数,并根据窗口N值大小进行计算。如果目标Y值超过门限(T×Z),则判定检测到目标。具体的算法框图如下图1所示。

图1 CA-CFAR算法框图
三、部分源代码
clear all
clc;
close all;

%% Radar Specifications

Range_res = 1;
Light_speed = 3e8;
Max_range = 200;
Max_velocity = 100;


%speed of light = 3e8
%% User Defined Range and Velocity of target
% *%TODO* :
% define the target's initial position and velocity. Note : Velocity
% remains contant
Range_target = 120;
Velocity_target = 40;


%% FMCW Waveform Generation

% *%TODO* :
%Design the FMCW waveform by giving the specs of each of its parameters.
% Calculate the Bandwidth (B), Chirp Time (Tchirp) and Slope (slope) of the FMCW
% chirp using the requirements above.


%Operating carrier frequency of Radar
fc= 77e9;             %carrier freq

B_sweep = Light_speed/(2*Range_res);

T_c = 5.5*2*Max_range/Light_speed;

slope = B_sweep/T_c;

%The number of chirps in one sequence. Its ideal to have 2^ value for the ease of running the FFT
%for Doppler Estimation.
Nd=128;                   % #of doppler cells OR #of sent periods % number of chirps

%The number of samples on each chirp.
Nr=1024;                  %for length of time OR # of range cells

% Timestamp for running the displacement scenario for every sample on each
% chirp
t=linspace(0,Nd*T_c,Nr*Nd); %total time for samples

%Creating the vectors for Tx, Rx and Mix based on the total samples input.
Tx=zeros(1,length(t)); %transmitted signal
Rx=zeros(1,length(t)); %received signal
Mix = zeros(1,length(t)); %beat signal


%Similar vectors for range_covered and time delay.
r_t=zeros(1,length(t));
td=zeros(1,length(t));


%% Signal generation and Moving Target simulation
% Running the radar scenario over the time.

for i=1:length(t)


    % *%TODO* :
    %For each time stamp update the Range of the Target for constant velocity.

    r_t(i) = Range_target + t(i)*Velocity_target;
    td(i) = r_t(i)*2/Light_speed;

    % *%TODO* :
    %For each time sample we need update the transmitted and
    %received signal.
    Tx(i) = cos(2*pi*(fc*t(i)+0.5*slope*t(i)^2));
    Rx(i) = cos(2*pi*(fc*(t(i)-td(i))+0.5*(t(i)-td(i))^2*slope));

    % *%TODO* :
    %Now by mixing the Transmit and Receive generate the beat signal
    %This is done by element wise matrix multiplication of Transmit and
    %Receiver Signal
    Mix(i) = Tx(i).*Rx(i);

end

%% RANGE MEASUREMENT


 % *%TODO* :
%reshape the vector into Nr*Nd array. Nr and Nd here would also define the size of
%Range and Doppler FFT respectively.

Mix = reshape(Mix,[Nr, Nd]);

 % *%TODO* :
%run the FFT on the beat signal along the range bins dimension (Nr) and
%normalize.
fft1D = fft(Mix,Nr);

 % *%TODO* :
% Take the absolute value of FFT output

fft1D = abs(fft1D);
fft1D = fft1D/max(fft1D);

 % *%TODO* :
% Output of FFT is double sided signal, but we are interested in only one side of the spectrum.
% Hence we throw out half of the samples.

final_fft1D = fft1D(1:Nr/2+1);

%plotting the range
figure ('Name','Range from First FFT')
plot(fft1D)
axis ([0 200 0 1]);
ylabel('Normalized Amplitude')
xlabel('Range');
 % *%TODO* :
 % plot FFT output
- 1
- 2
- 3
- 4
- 5
- 6
- 7
- 8
- 9
- 10
- 11
- 12
- 13
- 14
- 15
- 16
- 17
- 18
- 19
- 20
- 21
- 22
- 23
- 24
- 25
- 26
- 27
- 28
- 29
- 30
- 31
- 32
- 33
- 34
- 35
- 36
- 37
- 38
- 39
- 40
- 41
- 42
- 43
- 44
- 45
- 46
- 47
- 48
- 49
- 50
- 51
- 52
- 53
- 54
- 55
- 56
- 57
- 58
- 59
- 60
- 61
- 62
- 63
- 64
- 65
- 66
- 67
- 68
- 69
- 70
- 71
- 72
- 73
- 74
- 75
- 76
- 77
- 78
- 79
- 80
- 81
- 82
- 83
- 84
- 85
- 86
- 87
- 88
- 89
- 90
- 91
- 92
- 93
- 94
- 95
- 96
- 97
- 98
- 99
- 100
- 101
- 102
- 103
- 104
- 105
- 106
- 107
- 108
- 109
- 110
- 111
- 112
- 113
- 114
- 115
- 116
- 117
- 118
- 119
- 120
- 121
四、运行结果


五、matlab版本及参考文献
1 matlab版本
2014a
2 参考文献
[1] 沈再阳.精通MATLAB信号处理[M].清华大学出版社,2015.
[2]高宝建,彭进业,王琳,潘建寿.信号与系统——使用MATLAB分析与实现[M].清华大学出版社,2020.
[3]王文光,魏少明,任欣.信号处理与系统分析的MATLAB实现[M].电子工业出版社,2018.
3 备注
简介此部分摘自互联网,仅供参考,若侵权,联系删除
文章来源: qq912100926.blog.csdn.net,作者:海神之光,版权归原作者所有,如需转载,请联系作者。
原文链接:qq912100926.blog.csdn.net/article/details/125685049
- 点赞
- 收藏
- 关注作者


评论(0)