Google Earth Engine(GEE)——S2影像异常值

【摘要】 在计算索引并生成高质量马赛克时,有一个明显的图像是异常值。我已经确定了图像,问题在于 B5 波段的值非常低,这使得索引具有非常高的值。编号:哥白尼/S2_SR/20200829T174909_20200829T175522_T13UFP代码:var imageCollection = ee.ImageCollection("COPERNICUS/S2_SR"), geometry =...
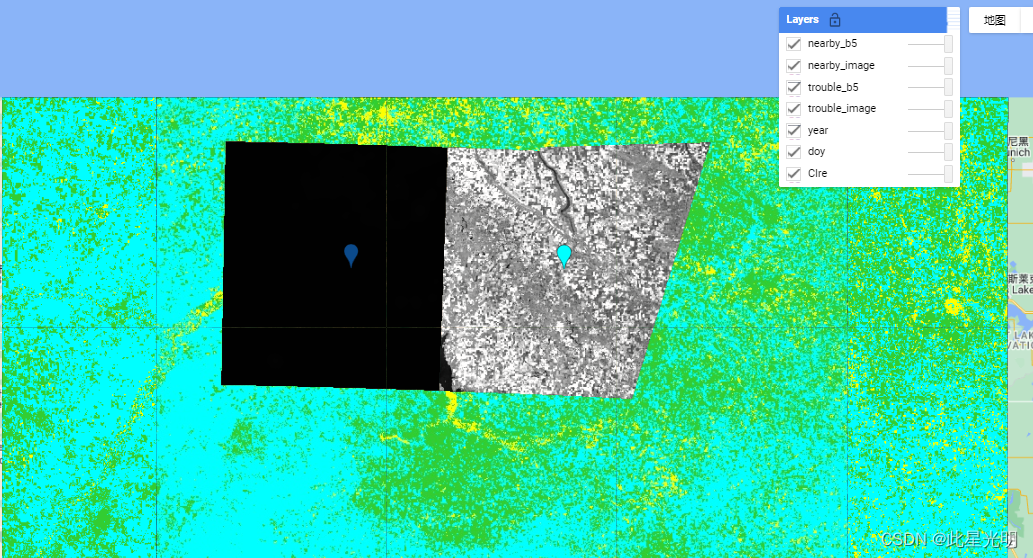
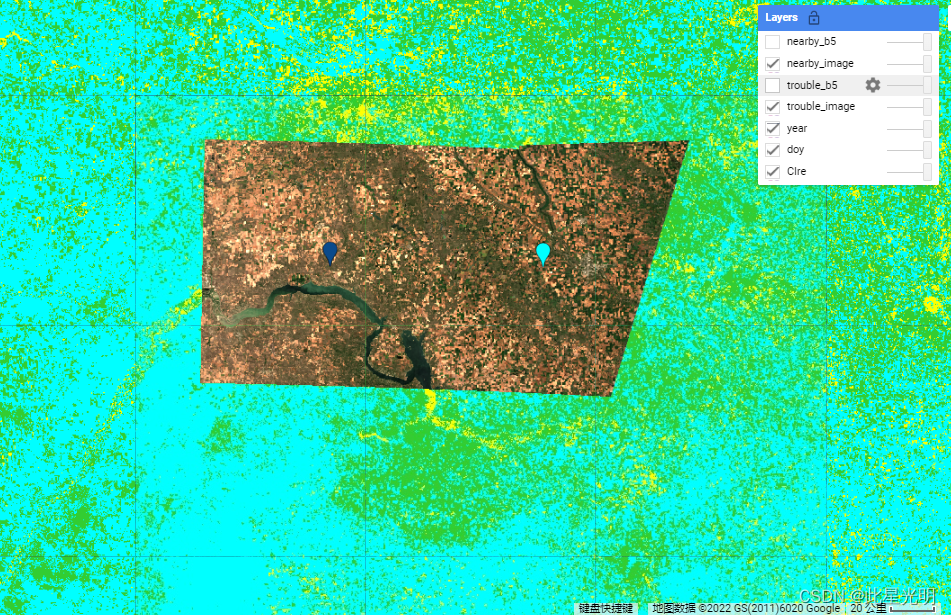
在计算索引并生成高质量马赛克时,有一个明显的图像是异常值。我已经确定了图像,问题在于 B5 波段的值非常低,这使得索引具有非常高的值。
编号:哥白尼/S2_SR/20200829T174909_20200829T175522_T13UFP
代码:
var imageCollection = ee.ImageCollection("COPERNICUS/S2_SR"),
geometry =
/* color: #98ff00 */
/* shown: false */
/* displayProperties: [
{
"type": "rectangle"
}
] */
ee.Geometry.Polygon(
[[[-103.99506389984352, 48.962358795597474],
[-103.99506389984352, 46.88665586989701],
[-99.68842327484352, 46.88665586989701],
[-99.68842327484352, 48.962358795597474]]], null, false),
geometry2 = /* color: #0b4a8b */ee.Geometry.Point([-102.87049298795543, 48.22935423511586]),
geometry3 = /* color: #00ffff */ee.Geometry.Point([-101.57471425064051, 48.22316284019277]);
//get veg bare soil water
function maskSCL(image) {
var scl = image.select('SCL');
var mask = scl.gte(4).and(scl.lte(6));
return image.updateMask(mask);//.divide(10000);
}
//calculate red edge chlorophyll index
var getIndices = function(img){
var im = img.divide(10000);
var CIre=im.select('B7').divide(im.select('B5')).subtract(1).rename("CIre");
return im.addBands(CIre).copyProperties(img,['system:time_start']);
}
function addDOY(im){
var doy = im.date().getRelative('day', 'year');
var doyBand = ee.Image.constant(doy).uint16().rename('doy')
doyBand = doyBand.updateMask(im.select('B8').mask())
var yr = im.date().get('year')
var yrBand = ee.Image.constant(yr).uint16().rename('year')
yrBand = yrBand.updateMask(im.select('B8').mask())
return im.addBands(doyBand).addBands(yrBand)
}
//max CIre from July-Sept
var dataset1 = imageCollection
.filterBounds(geometry)
.filter(ee.Filter.calendarRange(2018, 2021, 'year'))
.filter(ee.Filter.calendarRange(7, 9, 'month'))
.map(maskSCL)
.map(getIndices)
.map(addDOY)
.select('CIre', 'doy', 'year');
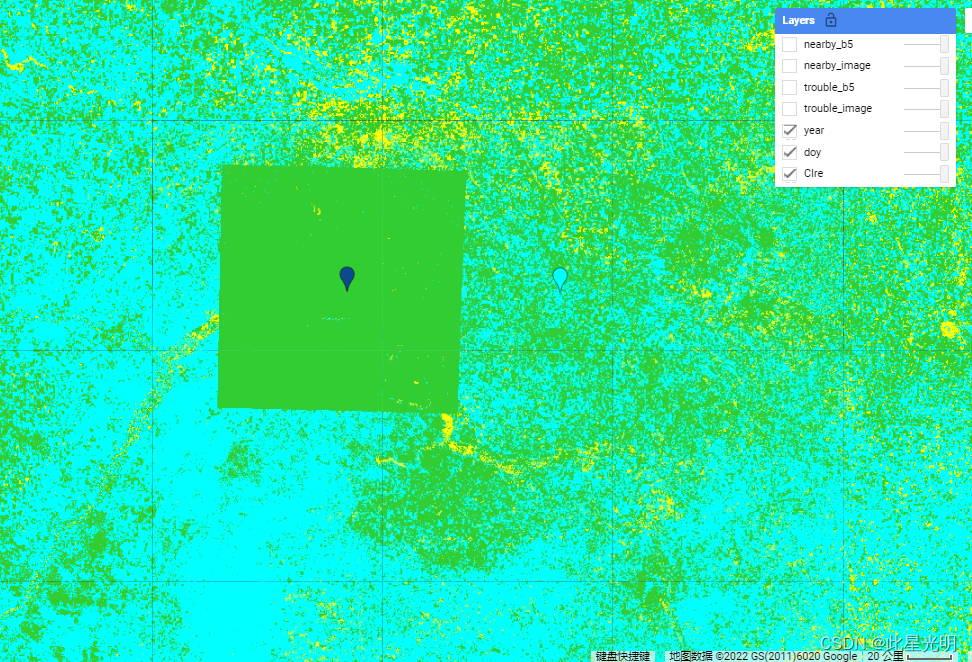
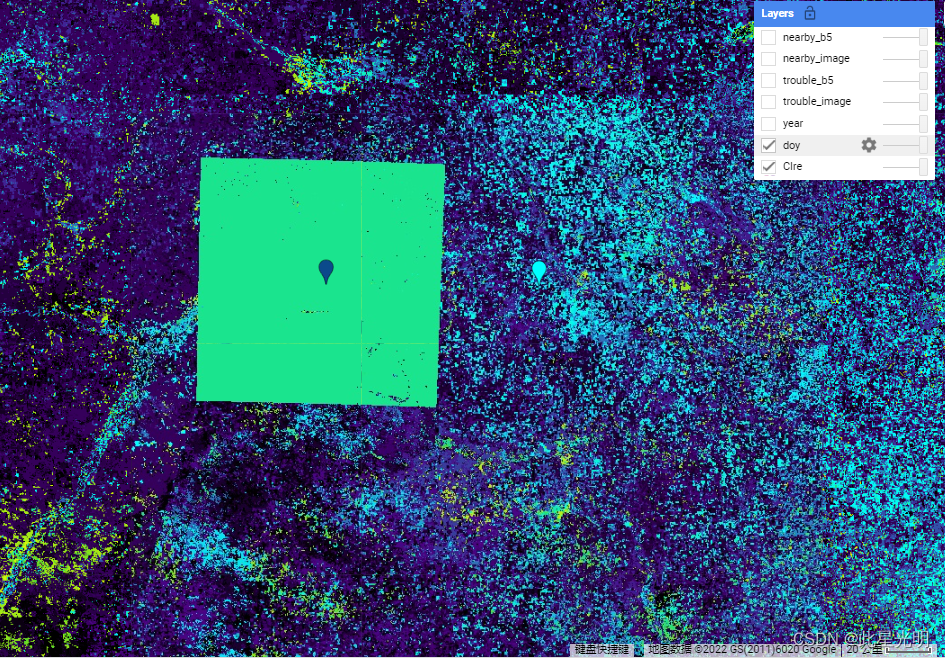
var CIre_max = dataset1.qualityMosaic('CIre');
Map.addLayer(CIre_max.select('CIre'),
{min:0,max:20,palette:['black','indigo','cyan','limegreen','yellow']},'CIre')
Map.addLayer(CIre_max.select('doy'),
{min:183,max:274,palette:['black','indigo','cyan','limegreen','yellow']},'doy')
Map.addLayer(CIre_max.select('year'),
{min:2018,max:2021,palette:['indigo','cyan','limegreen','yellow']},'year')
// var index = dataset1
// .select('CIre')
// .reduce(ee.Reducer.percentile([98]))
// //calculate band to use for quality mosaic of 98th percentile values
// // loop over image collection
// //get absolute difference from 98th percentile
// //convert to 1/abs dif + .1 to use as band for quality mosaic
// var forQM = dataset1.map(function(x){
// // get absolute difference of the percentiles with the CI
// var selector = x.select('CIre').subtract(index).abs();
// var selector_fixed = selector.eq(0).multiply(0.1).add(selector)
// // invert to let the min diff be the largest value
// var invsel = ee.Image.constant(1).divide(selector_fixed);
// // add inverted difference band to the image and name properly
// return x.addBands(invsel.rename('selector_CIre'))
// });
// // // // use the new selectors to perform the quality mosaic and add to map
// var CIre_p98QM = forQM
// .qualityMosaic('selector_CIre')
// .select(['CIre', 'doy'])
// Map.addLayer(CIre_p98QM.select('CIre'),
// {min:0,max:20,palette:['black','indigo','cyan','limegreen','yellow']},'CIre_p98')
// Map.addLayer(CIre_p98QM.select('doy'),
// {min:183,max:274,palette:['black','indigo','cyan','limegreen','yellow']},'doy_p98')
///print trouble image
//ID COPERNICUS/S2_SR/20200829T174909_20200829T175522_T13UFP
//Think B5 is not right
var checkit = imageCollection
.filterBounds(geometry2)
.filter(ee.Filter.calendarRange(2020, 2020, 'year'))
.filter(ee.Filter.calendarRange(240, 242, 'day_of_year'))
print(checkit)
Map.addLayer(checkit.max(),{bands:['B4','B3','B2'], min:100,max:2000},'trouble_image')
Map.addLayer(checkit.max(),{bands:['B5'], min:100,max:2000},'trouble_b5')
///nearby image same time period...B5 better
var checkit = imageCollection
.filterBounds(geometry3)
.filter(ee.Filter.calendarRange(2020, 2020, 'year'))
.filter(ee.Filter.calendarRange(240, 242, 'day_of_year'))
print(checkit)
Map.addLayer(checkit.max(),{bands:['B4','B3','B2'], min:100,max:2000},'nearby_image')
Map.addLayer(checkit.max(),{bands:['B5'], min:100,max:2000},'nearby_b5')

![]()
![]()

![]()
往期推荐:
欢迎大家关注和转发
另外,大家有什么问题可以在后台消息进行回复,我将不定期查看消息,回答或解决大家的问题,谢谢!

【声明】本内容来自华为云开发者社区博主,不代表华为云及华为云开发者社区的观点和立场。转载时必须标注文章的来源(华为云社区)、文章链接、文章作者等基本信息,否则作者和本社区有权追究责任。如果您发现本社区中有涉嫌抄袭的内容,欢迎发送邮件进行举报,并提供相关证据,一经查实,本社区将立刻删除涉嫌侵权内容,举报邮箱:
cloudbbs@huaweicloud.com
- 点赞
- 收藏
- 关注作者
评论(0)