【图像拼接】基于matlab Harris角点检测图像拼接【含Matlab源码 517期】

一、简介
1 不同类型的角点
在现实世界中,角点对应于物体的拐角,道路的十字路口、丁字路口等。从图像分析的角度来定义角点可以有以下两种定义:
角点可以是两个边缘的角点;
角点是邻域内具有两个主方向的特征点;
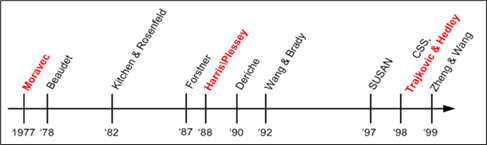
前者往往需要对图像边缘进行编码,这在很大程度上依赖于图像的分割与边缘提取,具有相当大的难度和计算量,且一旦待检测目标局部发生变化,很可能导致操作的失败。早期主要有Rosenfeld和Freeman等人的方法,后期有CSS等方法。
基于图像灰度的方法通过计算点的曲率及梯度来检测角点,避免了第一类方法存在的缺陷,此类方法主要有Moravec算子、Forstner算子、Harris算子、SUSAN算子等。
这篇文章主要介绍的Harris角点检测的算法原理,比较著名的角点检测方法还有jianbo Shi和Carlo Tomasi提出的Shi-Tomasi算法,这个算法开始主要是为了解决跟踪问题,用来衡量两幅图像的相似度,我们也可以把它看为Harris算法的改进。OpenCV中已经对它进行了实现,接口函数名为GoodFeaturesToTrack()。另外还有一个著名的角点检测算子即SUSAN算子,SUSAN是Smallest Univalue Segment Assimilating Nucleus(最小核值相似区)的缩写。SUSAN使用一个圆形模板和一个圆的中心点,通过圆中心点像素与模板圆内其他像素值的比较,统计出与圆中心像素近似的像元数量,当这样的像元数量小于某一个阈值时,就被认为是要检测的角点。我觉得可以把SUSAN算子看为Harris算法的一个简化。这个算法原理非常简单,算法效率也高,所以在OpenCV中,它的接口函数名称为:FAST() 。
2 Harris角点基本原理
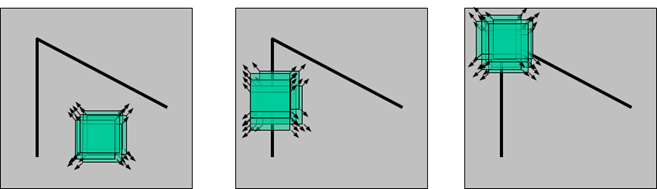
人眼对角点的识别通常是在一个局部的小区域或小窗口完成的。如果在各个方向上移动这个特征的小窗口,窗口内区域的灰度发生了较大的变化,那么就认为在窗口内遇到了角点。如果这个特定的窗口在图像各个方向上移动时,窗口内图像的灰度没有发生变化,那么窗口内就不存在角点;如果窗口在某一个方向移动时,窗口内图像的灰度发生了较大的变化,而在另一些方向上没有发生变化,那么,窗口内的图像可能就是一条直线的线段。
对于图像I(x,y)I(x,y),当在点(x,y)(x,y)处平移(Δx,Δy)(Δx,Δy)后的自相似性,可以通过自相关函数给出:
c(x,y;Δx,Δy)=∑(u,v)∈W(x,y)w(u,v)(I(u,v)–I(u+Δx,v+Δy))2c(x,y;Δx,Δy)=∑(u,v)∈W(x,y)w(u,v)(I(u,v)–I(u+Δx,v+Δy))2
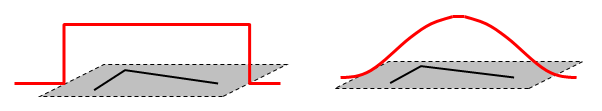
其中,W(x,y)W(x,y)是以点(x,y)(x,y)为中心的窗口,w(u,v)w(u,v)为加权函数,它既可是常数,也可以是高斯加权函数。

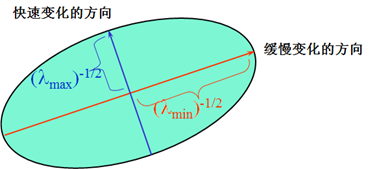
椭圆函数特征值与图像中的角点、直线(边缘)和平面之间的关系如下图所示。共可分为三种情况:
图像中的直线。一个特征值大,另一个特征值小,λ1≫λ2λ1≫λ2或λ2≫λ1λ2≫λ1。自相关函数值在某一方向上大,在其他方向上小。
图像中的平面。两个特征值都小,且近似相等;自相关函数数值在各个方向上都小。
图像中的角点。两个特征值都大,且近似相等,自相关函数在所有方向都增大。


二、部分源代码
%only for RGB image homography

clc;
clear all;
close all
f = 'hall';
ext = 'jpg';
img1 = imread([f '1.' ext]);
img2 = imread([f '2.' ext]);

if size(img1,3)==1%to find whether input is RGB image
fprintf('error,only for RGB images\n');
end

img1Dup=rgb2gray(img1);%duplicate img1
img1Dup=double(img1Dup);

img2Dup=rgb2gray(img2);%duplicate img2
img2Dup=double(img2Dup);

% use Harris in both images to find corner.

[locs1] = Harris(img1Dup);
[locs2] = Harris(img2Dup);


%using NCC to find coorespondence between two images
[matchLoc1 matchLoc2] =  findCorr(img1Dup,img2Dup,locs1, locs2);

% use RANSAC to find homography matrix
[H inlierIdx] = estHomography(img1Dup,img2Dup,matchLoc2',matchLoc1');
 H  %#ok
[imgout]=warpTheImage(H,img1,img2);
% Harris detector
% The code calculates
% the Harris Feature Points(FP)
%
% When u execute the code, the test image file opened
% and u have to select by the mouse the region where u
% want to find the Harris points,
% then the code will print out and display the feature
% points in the selected region.
% You can select the number of FPs by changing the variables
% max_N & min_N
% A. Ganoun

function [locs] = Harris(frame)
% I=rgb2gray(frame);
% I =double(I);
I=frame;
%****************************
% imshow(frame);
%
% waitforbuttonpress;
% point1 = get(gca,'CurrentPoint');  %button down detected
% rectregion = rbbox;  %%%return figure units
% point2 = get(gca,'CurrentPoint');%%%%button up detected
% point1 = point1(1,1:2); %%% extract col/row min and maxs
% point2 = point2(1,1:2);
% lowerleft = min(point1, point2);
% upperright = max(point1, point2);
% ymin = round(lowerleft(1)); %%% arrondissement aux nombrs les plus proches
% ymax = round(upperright(1));
% xmin = round(lowerleft(2));
% xmax = round(upperright(2));
%
%
% %***********************************
% Aj=6;
% cmin=xmin-Aj; cmax=xmax+Aj; rmin=ymin-Aj; rmax=ymax+Aj;
 min_N=350;max_N=450;


%%%%%%%%%%%%%%Intrest Points %%%%%%%%%%%%%%%%%%%%%%%%%%%%%%%%%%%%%%%%%%%%%%%%%
sigma=1.4; Thrshold=20; r=4;
dx = [-1 0 1; -1 0 1; -1 0 1]; % The Mask
    dy = dx';
    %%%%%%
    Ix = conv2(I, dx, 'same');
    Iy = conv2(I, dy, 'same');
    g = fspecial('gaussian',5*sigma, sigma); %%%%%% Gaussien Filter

    %%%%%
    Ix2 = conv2(Ix.^2, g, 'same');
    Iy2 = conv2(Iy.^2, g, 'same');
    Ixy = conv2(Ix.*Iy, g,'same');
    %%%%%%%%%%%%%%
    k = 0.04;
    R11 = (Ix2.*Iy2 - Ixy.^2) - k*(Ix2 + Iy2).^2;
    R11=(1000/max(max(R11)))*R11;  %make the largest one to be 1000

    R=R11;

    sze = 2*r+1;
    MX = ordfilt2(R,sze^2,ones(sze));% non-Maximun supression
    R11 = (R==MX)&(R>Thrshold);
    count=sum(sum(R11(5:size(R11,1)-5,5:size(R11,2)-5)));


    loop=0;  %use adaptive threshold here
    while (((count<min_N)||(count>max_N))&&(loop<30))
        if count>max_N
            Thrshold=Thrshold*1.5;
        elseif count < min_N
            Thrshold=Thrshold*0.5;
        end

        R11 = (R==MX)&(R>Thrshold);
        count=sum(sum(R11(5:size(R11,1)-5,5:size(R11,2)-5)));
        loop=loop+1;
    end


	R=R*0;
    R(5:size(R11,1)-5,5:size(R11,2)-5)=R11(5:size(R11,1)-5,5:size(R11,2)-5);% ignore the corners on the boundary
	[r1,c1] = find(R);
    PIP=[r1,c1];%% IP
    locs=PIP;

- 1
- 2
- 3
- 4
- 5
- 6
- 7
- 8
- 9
- 10
- 11
- 12
- 13
- 14
- 15
- 16
- 17
- 18
- 19
- 20
- 21
- 22
- 23
- 24
- 25
- 26
- 27
- 28
- 29
- 30
- 31
- 32
- 33
- 34
- 35
- 36
- 37
- 38
- 39
- 40
- 41
- 42
- 43
- 44
- 45
- 46
- 47
- 48
- 49
- 50
- 51
- 52
- 53
- 54
- 55
- 56
- 57
- 58
- 59
- 60
- 61
- 62
- 63
- 64
- 65
- 66
- 67
- 68
- 69
- 70
- 71
- 72
- 73
- 74
- 75
- 76
- 77
- 78
- 79
- 80
- 81
- 82
- 83
- 84
- 85
- 86
- 87
- 88
- 89
- 90
- 91
- 92
- 93
- 94
- 95
- 96
- 97
- 98
- 99
- 100
- 101
- 102
- 103
- 104
- 105
- 106
- 107
- 108
- 109
- 110
- 111
- 112
- 113
- 114
- 115
- 116
- 117
- 118
三、运行结果

四、matlab版本及参考文献
1 matlab版本
2014a
2 参考文献
[1] 蔡利梅.MATLAB图像处理——理论、算法与实例分析[M].清华大学出版社,2020.
[2]杨丹,赵海滨,龙哲.MATLAB图像处理实例详解[M].清华大学出版社,2013.
[3]周品.MATLAB图像处理与图形用户界面设计[M].清华大学出版社,2013.
[4]刘成龙.精通MATLAB图像处理[M].清华大学出版社,2015.
文章来源: qq912100926.blog.csdn.net,作者:海神之光,版权归原作者所有,如需转载,请联系作者。
原文链接:qq912100926.blog.csdn.net/article/details/114783008

- 点赞
- 收藏
- 关注作者
评论(0)