【疾病识别】基于matlab GUI SVM农作物叶子虫害识别与分类【含Matlab源码 1322期】

【摘要】
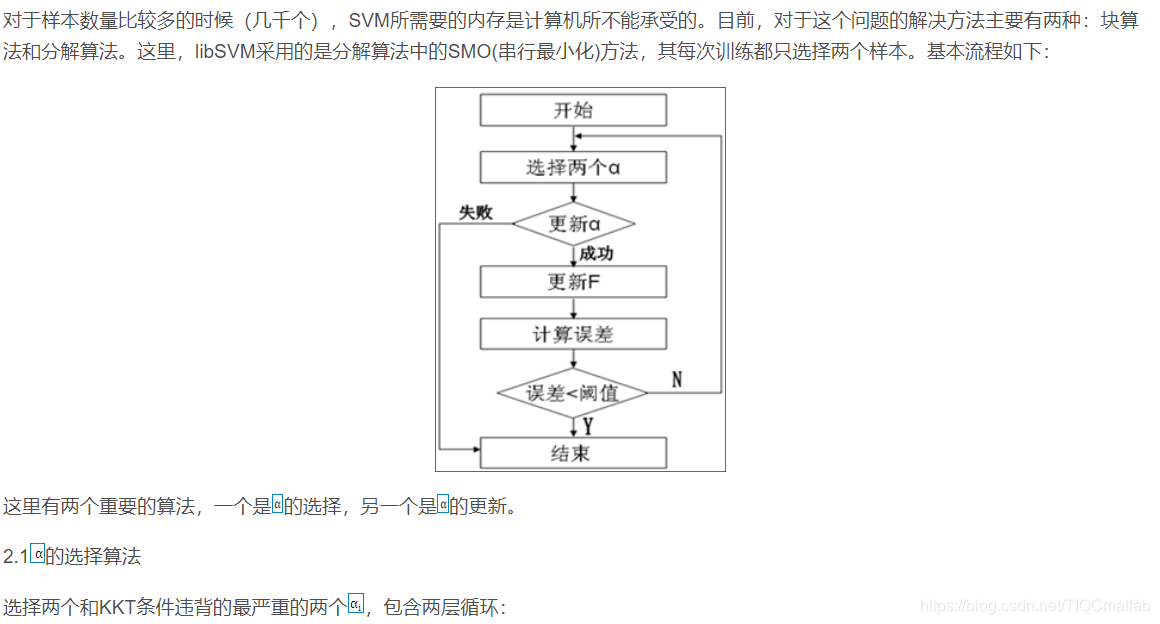
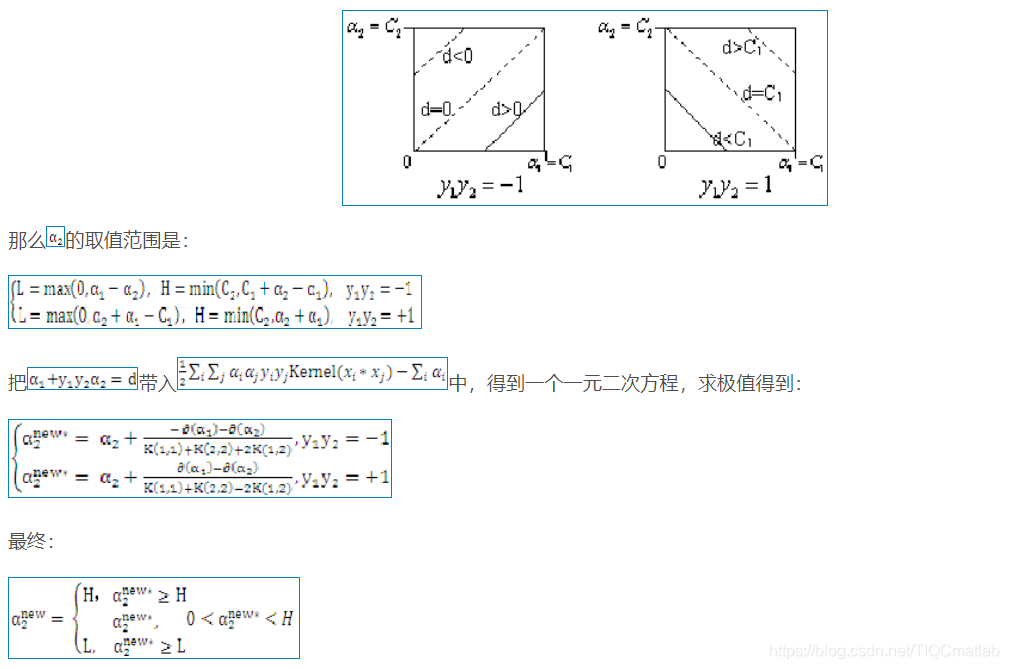
一、SVM简介
支持向量机(Support Vector Machine)是Cortes和Vapnik于1995年首先提出的,它在解决小样本、非线性及高维模式识别中表现出许多特有的优势,并能够推广应用到...
一、SVM简介
支持向量机(Support Vector Machine)是Cortes和Vapnik于1995年首先提出的,它在解决小样本、非线性及高维模式识别中表现出许多特有的优势,并能够推广应用到函数拟合等其他机器学习问题中。
1 数学部分
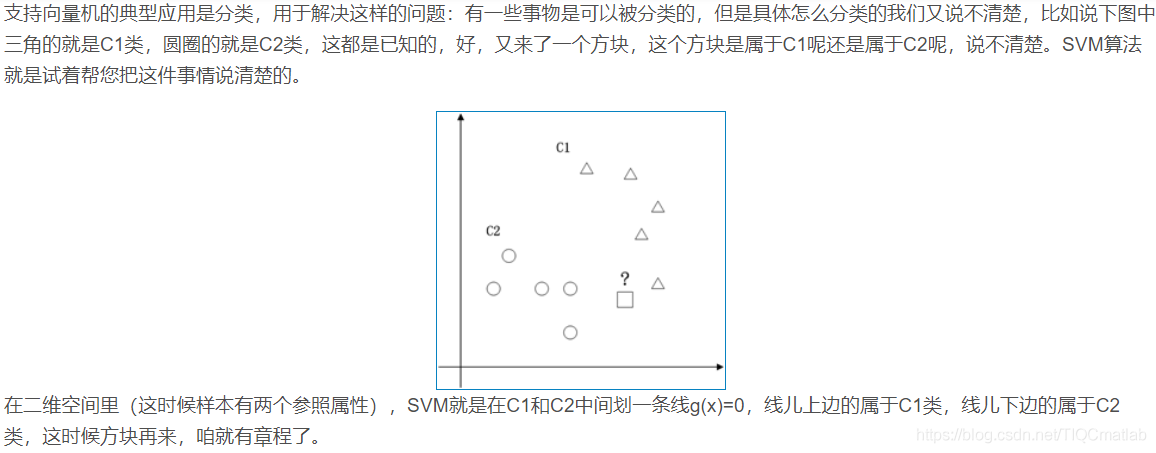
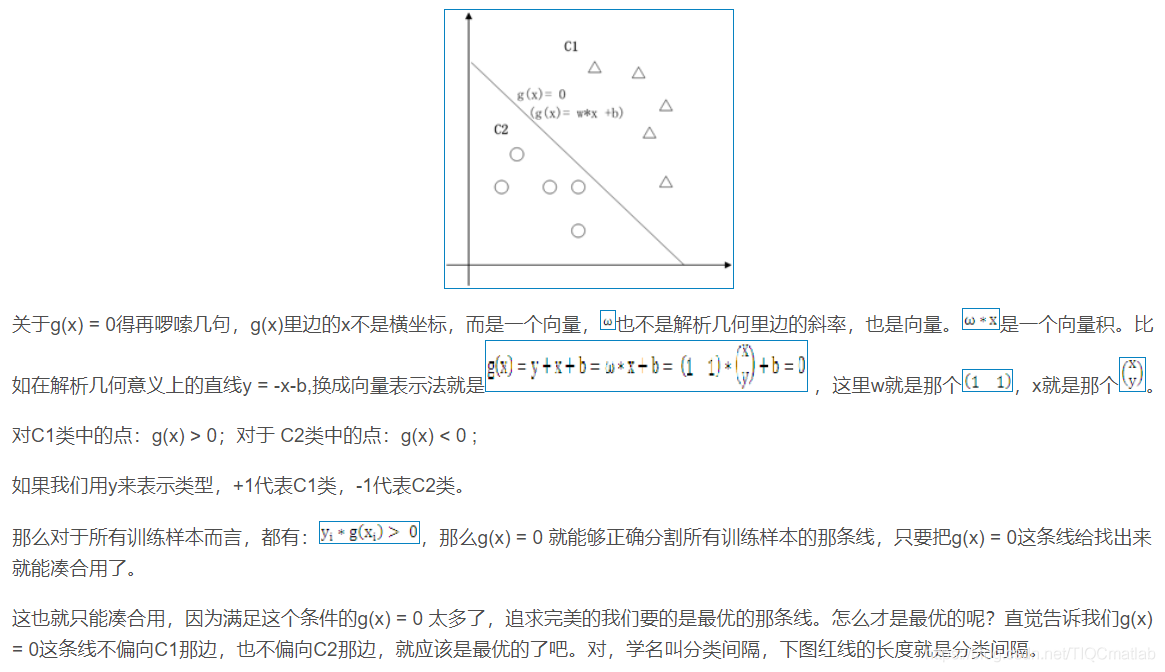
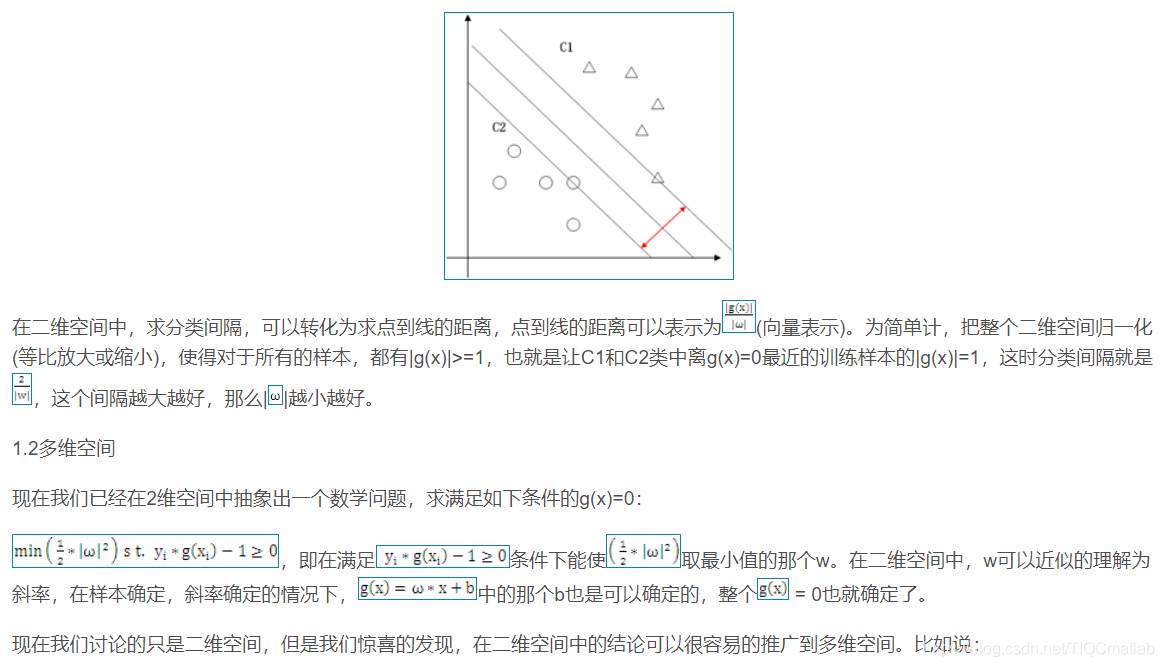
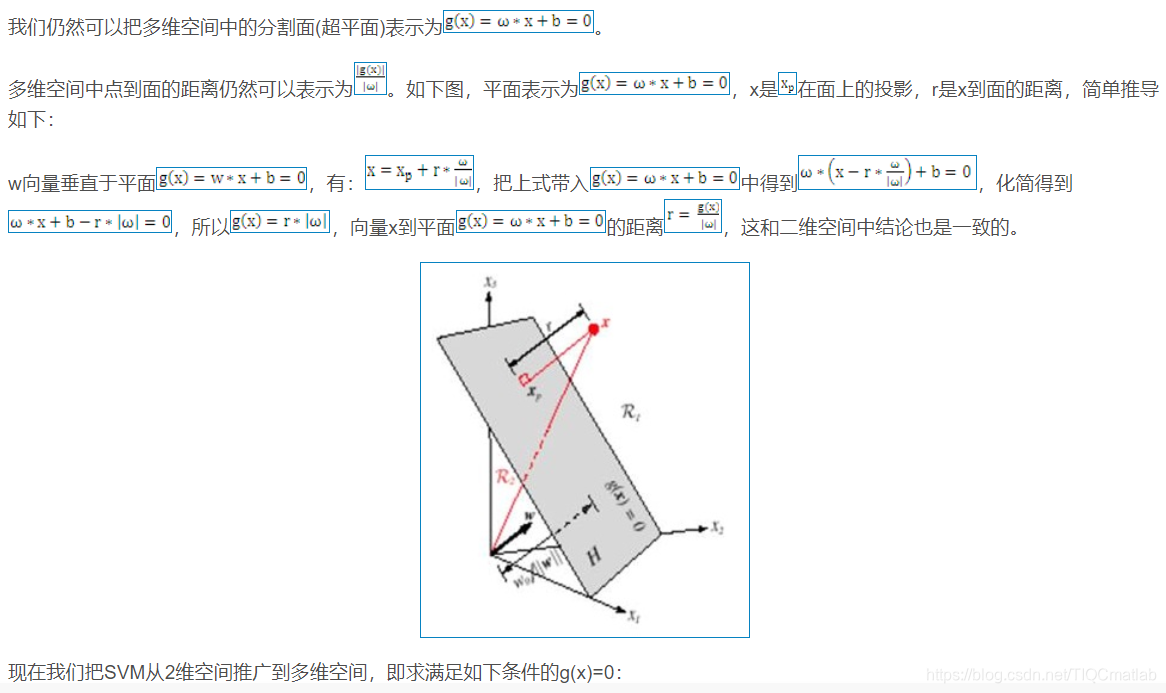
1.1 二维空间
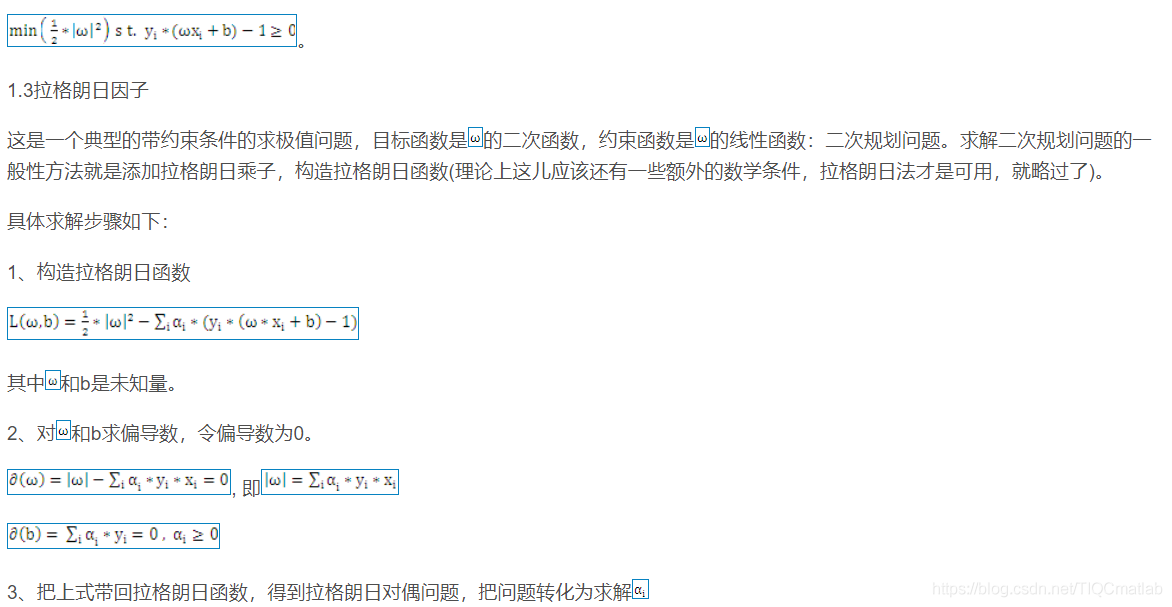
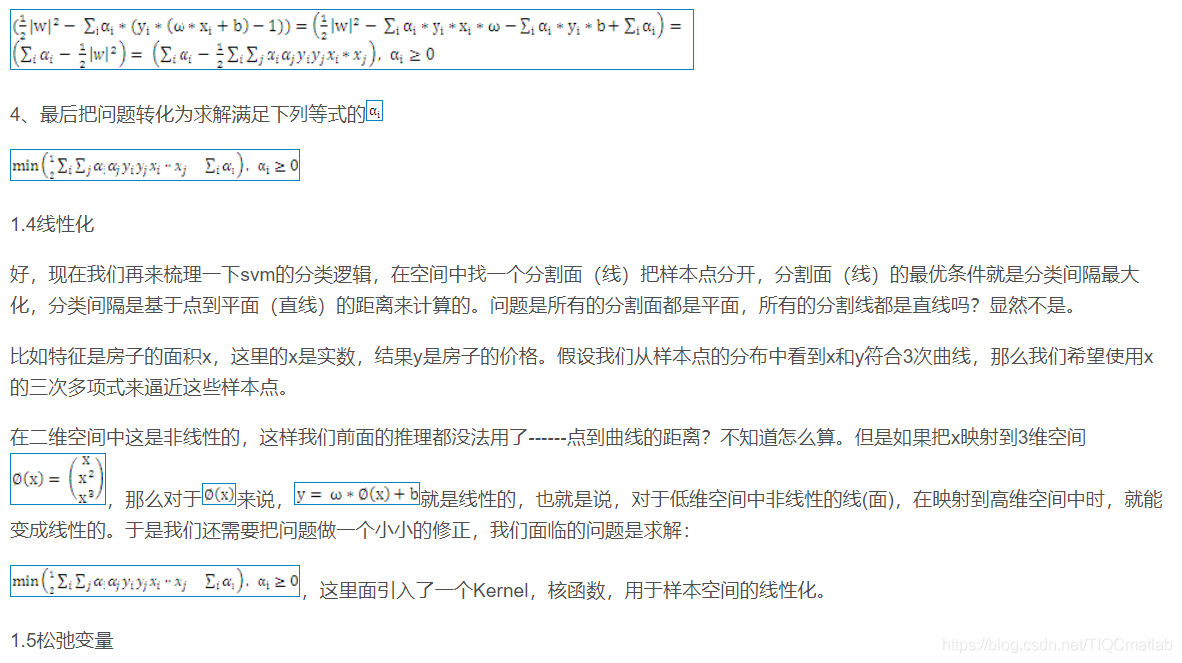
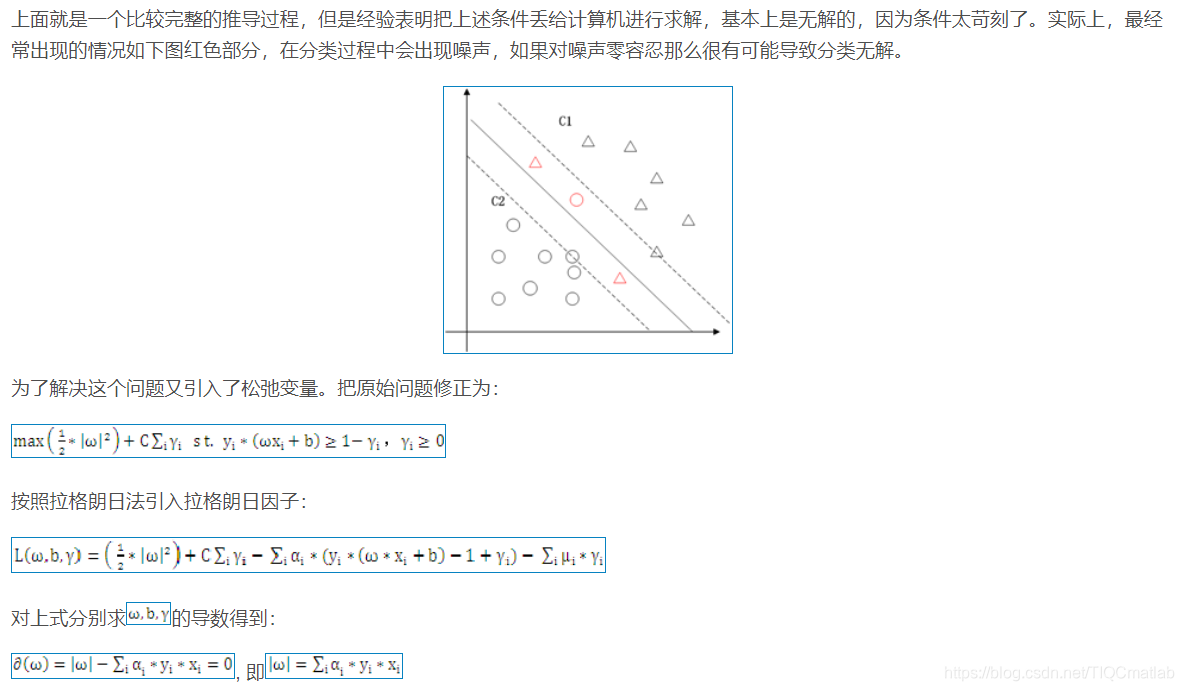

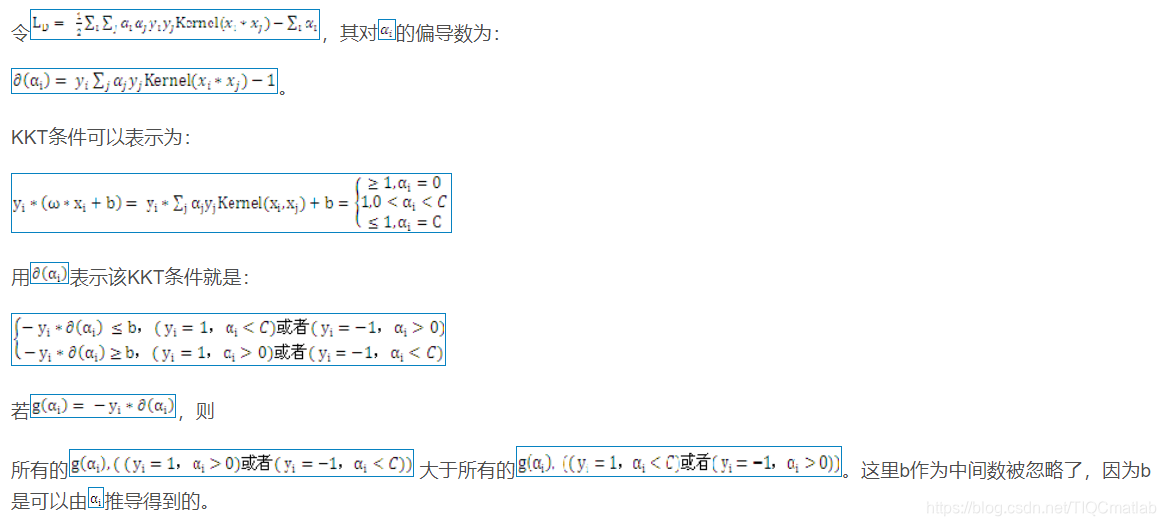
2 算法部分

二、部分源代码
function varargout = DetectDisease_GUI(varargin)
% DETECTDISEASE_GUI MATLAB code for DetectDisease_GUI.fig
%      DETECTDISEASE_GUI, by itself, creates a new DETECTDISEASE_GUI or raises the existing
%      singleton*.
%
%      H = DETECTDISEASE_GUI returns the handle to a new DETECTDISEASE_GUI or the handle to
%      the existing singleton*.
%
%      DETECTDISEASE_GUI('CALLBACK',hObject,eventData,handles,...) calls the local
%      function named CALLBACK in DETECTDISEASE_GUI.M with the given input arguments.
%
%      DETECTDISEASE_GUI('Property','Value',...) creates a new DETECTDISEASE_GUI or raises the
%      existing singleton*.  Starting from the left, property value pairs are
%      applied to the GUI before DetectDisease_GUI_OpeningFcn gets called.  An
%      unrecognized property name or invalid value makes property application
%      stop.  All inputs are passed to DetectDisease_GUI_OpeningFcn via varargin.
%
%      *See GUI Options on GUIDE's Tools menu.  Choose "GUI allows only one
%      instance to run (singleton)".
%
% See also: GUIDE, GUIDATA, GUIHANDLES

% Edit the above text to modify the response to help DetectDisease_GUI

% Last Modified by GUIDE v2.5 26-Aug-2021 17:06:52

% Begin initialization code - DO NOT EDIT
gui_Singleton = 1;
gui_State = struct('gui_Name',       mfilename, ...
                   'gui_Singleton',  gui_Singleton, ...
                   'gui_OpeningFcn', @DetectDisease_GUI_OpeningFcn, ...
                   'gui_OutputFcn',  @DetectDisease_GUI_OutputFcn, ...
                   'gui_LayoutFcn',  [] , ...
                   'gui_Callback',   []);
if nargin && ischar(varargin{1})
    gui_State.gui_Callback = str2func(varargin{1});
end

if nargout
    [varargout{1:nargout}] = gui_mainfcn(gui_State, varargin{:});
else
    gui_mainfcn(gui_State, varargin{:});
end
% End initialization code - DO NOT EDIT


% --- Executes just before DetectDisease_GUI is made visible.
function DetectDisease_GUI_OpeningFcn(hObject, eventdata, handles, varargin)
% This function has no output args, see OutputFcn.
% hObject    handle to figure
% eventdata  reserved - to be defined in a future version of MATLAB
% handles    structure with handles and user data (see GUIDATA)
% varargin   command line arguments to DetectDisease_GUI (see VARARGIN)

% Choose default command line output for DetectDisease_GUI
handles.output = hObject;
ss = ones(300,400);
axes(handles.axes1);
imshow(ss);
axes(handles.axes2);
imshow(ss);
axes(handles.axes3);
imshow(ss);
% Update handles structure
guidata(hObject, handles);

% UIWAIT makes DetectDisease_GUI wait for user response (see UIRESUME)
% uiwait(handles.figure1);


% --- Outputs from this function are returned to the command line.
function varargout = DetectDisease_GUI_OutputFcn(hObject, eventdata, handles)
% varargout  cell array for returning output args (see VARARGOUT);
% hObject    handle to figure
% eventdata  reserved - to be defined in a future version of MATLAB
% handles    structure with handles and user data (see GUIDATA)

% Get default command line output from handles structure
%varargout{1} = handles.output;


% --- Executes on button press in pushbutton1.
function pushbutton1_Callback(hObject, eventdata, handles)
% hObject    handle to pushbutton1 (see GCBO)
% eventdata  reserved - to be defined in a future version of MATLAB
% handles    structure with handles and user data (see GUIDATA)
%clear all
%close all
clc
[filename, pathname] = uigetfile({'*.*';'*.bmp';'*.jpg';'*.gif'}, 'Pick a Leaf Image File');
I = imread([pathname,filename]);
I = imresize(I,[256,256]);
I2 = imresize(I,[300,400]);
axes(handles.axes1);
imshow(I2);title('Query Image');
ss = ones(300,400);
axes(handles.axes2);
imshow(ss);
axes(handles.axes3);
imshow(ss);
handles.ImgData1 = I;
guidata(hObject,handles);

% --- Executes on button press in pushbutton3.
function pushbutton3_Callback(hObject, eventdata, handles)
% hObject    handle to pushbutton3 (see GCBO)
% eventdata  reserved - to be defined in a future version of MATLAB
% handles    structure with handles and user data (see GUIDATA)
I3 = handles.ImgData1;
I4 = imadjust(I3,stretchlim(I3));
I5 = imresize(I4,[300,400]);
axes(handles.axes2);
imshow(I5);title(' Contrast Enhanced ');
handles.ImgData2 = I4;
guidata(hObject,handles);


% --- Executes on button press in pushbutton4.
function pushbutton4_Callback(hObject, eventdata, handles)
% hObject    handle to pushbutton4 (see GCBO)
% eventdata  reserved - to be defined in a future version of MATLAB
% handles    structure with handles and user data (see GUIDATA)
I6 = handles.ImgData2;
I = I6;
%% Extract Features

% Function call to evaluate features
%[feat_disease seg_img] =  EvaluateFeatures(I)

% Color Image Segmentation
% Use of K Means clustering for segmentation
% Convert Image from RGB Color Space to L*a*b* Color Space
% The L*a*b* space consists of a luminosity layer 'L*', chromaticity-layer 'a*' and 'b*'.
% All of the color information is in the 'a*' and 'b*' layers.
cform = makecform('srgb2lab');
% Apply the colorform
lab_he = applycform(I,cform);

% Classify the colors in a*b* colorspace using K means clustering.
% Since the image has 3 colors create 3 clusters.
% Measure the distance using Euclidean Distance Metric.
ab = double(lab_he(:,:,2:3));
nrows = size(ab,1);
ncols = size(ab,2);
ab = reshape(ab,nrows*ncols,2);
nColors = 3;
[cluster_idx cluster_center] = kmeans(ab,nColors,'distance','sqEuclidean', ...
                                      'Replicates',3);
%[cluster_idx cluster_center] = kmeans(ab,nColors,'distance','sqEuclidean','Replicates',3);
% Label every pixel in tha image using results from K means
pixel_labels = reshape(cluster_idx,nrows,ncols);
%figure,imshow(pixel_labels,[]), title('Image Labeled by Cluster Index');

% Create a blank cell array to store the results of clustering
segmented_images = cell(1,3);
% Create RGB label using pixel_labels
rgb_label = repmat(pixel_labels,[1,1,3]);

for k = 1:nColors
    colors = I;
    colors(rgb_label ~= k) = 0;
    segmented_images{k} = colors;
end


figure,subplot(2,3,2);imshow(I);title('Original Image'); subplot(2,3,4);imshow(segmented_images{1});title('Cluster 1'); subplot(2,3,5);imshow(segmented_images{2});title('Cluster 2');
subplot(2,3,6);imshow(segmented_images{3});title('Cluster 3');
set(gcf, 'Position', get(0,'Screensize'));
set(gcf, 'name','Segmented by K Means', 'numbertitle','off')
% Feature Extraction
pause(2)
x = inputdlg('Enter the cluster no. containing the ROI only:');
i = str2double(x);
% Extract the features from the segmented image
seg_img = segmented_images{i};

% Convert to grayscale if image is RGB
if ndims(seg_img) == 3
   img = rgb2gray(seg_img);
end
%figure, imshow(img); title('Gray Scale Image');

% Evaluate the disease affected area
black = im2bw(seg_img,graythresh(seg_img));
%figure, imshow(black);title('Black & White Image');
m = size(seg_img,1);
n = size(seg_img,2);

zero_image = zeros(m,n);
%G = imoverlay(zero_image,seg_img,[1 0 0]);

cc = bwconncomp(seg_img,6);
diseasedata = regionprops(cc,'basic');
A1 = diseasedata.Area;
sprintf('Area of the disease affected region is : %g%',A1);

I_black = im2bw(I,graythresh(I));
kk = bwconncomp(I,6);
leafdata = regionprops(kk,'basic');
A2 = leafdata.Area;
sprintf(' Total leaf area is : %g%',A2);

%Affected_Area = 1-(A1/A2);
Affected_Area = (A1/A2);
if Affected_Area < 0.1
    Affected_Area = Affected_Area+0.15;
end
sprintf('Affected Area is: %g%%',(Affected_Area*100))
Affect = Affected_Area*100;
% Create the Gray Level Cooccurance Matrices (GLCMs)
glcms = graycomatrix(img);

% Derive Statistics from GLCM
stats = graycoprops(glcms,'Contrast Correlation Energy Homogeneity');
Contrast = stats.Contrast;
Correlation = stats.Correlation;
Energy = stats.Energy;
Homogeneity = stats.Homogeneity;
Mean = mean2(seg_img);
Standard_Deviation = std2(seg_img);
Entropy = entropy(seg_img);
RMS = mean2(rms(seg_img));
%Skewness = skewness(img)
Variance = mean2(var(double(seg_img)));
a = sum(double(seg_img(:)));
Smoothness = 1-(1/(1+a));
Kurtosis = kurtosis(double(seg_img(:)));
Skewness = skewness(double(seg_img(:)));
% Inverse Difference Movement
m = size(seg_img,1);
n = size(seg_img,2);
in_diff = 0;
for i = 1:m
    for j = 1:n
        temp = seg_img(i,j)./(1+(i-j).^2);
        in_diff = in_diff+temp;
    end
end
IDM = double(in_diff);

feat_disease = [Contrast,Correlation,Energy,Homogeneity, Mean, Standard_Deviation, Entropy, RMS, Variance, Smoothness, Kurtosis, Skewness, IDM];
I7 = imresize(seg_img,[300,400]);
axes(handles.axes3);
imshow(I7);title('Segmented ROI');
%set(handles.edit3,'string',Affect);
set(handles.edit5,'string',Mean);
set(handles.edit6,'string',Standard_Deviation);
set(handles.edit7,'string',Entropy);
set(handles.edit8,'string',RMS);
set(handles.edit9,'string',Variance);
set(handles.edit10,'string',Smoothness);
set(handles.edit11,'string',Kurtosis);
set(handles.edit12,'string',Skewness);
set(handles.edit13,'string',IDM);
set(handles.edit14,'string',Contrast);
set(handles.edit15,'string',Correlation);
set(handles.edit16,'string',Energy);
set(handles.edit17,'string',Homogeneity);
handles.ImgData3 = feat_disease;
handles.ImgData4 = Affect;
% Update GUI
guidata(hObject,handles);

function edit2_Callback(hObject, eventdata, handles)
% hObject    handle to edit2 (see GCBO)
% eventdata  reserved - to be defined in a future version of MATLAB
% handles    structure with handles and user data (see GUIDATA)

% Hints: get(hObject,'String') returns contents of edit2 as text
%        str2double(get(hObject,'String')) returns contents of edit2 as a double


% --- Executes during object creation, after setting all properties.
function edit2_CreateFcn(hObject, eventdata, handles)
% hObject    handle to edit2 (see GCBO)
% eventdata  reserved - to be defined in a future version of MATLAB
% handles    empty - handles not created until after all CreateFcns called

% Hint: edit controls usually have a white background on Windows.
%       See ISPC and COMPUTER.
if ispc && isequal(get(hObject,'BackgroundColor'), get(0,'defaultUicontrolBackgroundColor'))
    set(hObject,'BackgroundColor','white');
end
- 1
- 2
- 3
- 4
- 5
- 6
- 7
- 8
- 9
- 10
- 11
- 12
- 13
- 14
- 15
- 16
- 17
- 18
- 19
- 20
- 21
- 22
- 23
- 24
- 25
- 26
- 27
- 28
- 29
- 30
- 31
- 32
- 33
- 34
- 35
- 36
- 37
- 38
- 39
- 40
- 41
- 42
- 43
- 44
- 45
- 46
- 47
- 48
- 49
- 50
- 51
- 52
- 53
- 54
- 55
- 56
- 57
- 58
- 59
- 60
- 61
- 62
- 63
- 64
- 65
- 66
- 67
- 68
- 69
- 70
- 71
- 72
- 73
- 74
- 75
- 76
- 77
- 78
- 79
- 80
- 81
- 82
- 83
- 84
- 85
- 86
- 87
- 88
- 89
- 90
- 91
- 92
- 93
- 94
- 95
- 96
- 97
- 98
- 99
- 100
- 101
- 102
- 103
- 104
- 105
- 106
- 107
- 108
- 109
- 110
- 111
- 112
- 113
- 114
- 115
- 116
- 117
- 118
- 119
- 120
- 121
- 122
- 123
- 124
- 125
- 126
- 127
- 128
- 129
- 130
- 131
- 132
- 133
- 134
- 135
- 136
- 137
- 138
- 139
- 140
- 141
- 142
- 143
- 144
- 145
- 146
- 147
- 148
- 149
- 150
- 151
- 152
- 153
- 154
- 155
- 156
- 157
- 158
- 159
- 160
- 161
- 162
- 163
- 164
- 165
- 166
- 167
- 168
- 169
- 170
- 171
- 172
- 173
- 174
- 175
- 176
- 177
- 178
- 179
- 180
- 181
- 182
- 183
- 184
- 185
- 186
- 187
- 188
- 189
- 190
- 191
- 192
- 193
- 194
- 195
- 196
- 197
- 198
- 199
- 200
- 201
- 202
- 203
- 204
- 205
- 206
- 207
- 208
- 209
- 210
- 211
- 212
- 213
- 214
- 215
- 216
- 217
- 218
- 219
- 220
- 221
- 222
- 223
- 224
- 225
- 226
- 227
- 228
- 229
- 230
- 231
- 232
- 233
- 234
- 235
- 236
- 237
- 238
- 239
- 240
- 241
- 242
- 243
- 244
- 245
- 246
- 247
- 248
- 249
- 250
- 251
- 252
- 253
- 254
- 255
- 256
- 257
- 258
- 259
- 260
- 261
- 262
- 263
- 264
- 265
- 266
- 267
- 268
- 269
- 270
- 271
- 272
- 273
- 274
- 275
- 276
- 277
- 278
- 279
- 280
- 281
- 282
- 283
- 284
- 285
- 286
- 287
三、运行结果


四、matlab版本及参考文献
1 matlab版本
2014a
2 参考文献
[1] 蔡利梅.MATLAB图像处理——理论、算法与实例分析[M].清华大学出版社,2020.
[2]杨丹,赵海滨,龙哲.MATLAB图像处理实例详解[M].清华大学出版社,2013.
[3]周品.MATLAB图像处理与图形用户界面设计[M].清华大学出版社,2013.
[4]刘成龙.精通MATLAB图像处理[M].清华大学出版社,2015.
文章来源: qq912100926.blog.csdn.net,作者:海神之光,版权归原作者所有,如需转载,请联系作者。
原文链接:qq912100926.blog.csdn.net/article/details/120444453

【版权声明】本文为华为云社区用户转载文章,如果您发现本社区中有涉嫌抄袭的内容,欢迎发送邮件进行举报,并提供相关证据,一经查实,本社区将立刻删除涉嫌侵权内容,举报邮箱:
cloudbbs@huaweicloud.com
- 点赞
- 收藏
- 关注作者
评论(0)