【人工智能】机器学习之用Python运用特征脸(eigenface)和sklearn.svm.SVC进行人脸识别。

【摘要】 向量机首先创建可以分离的样本数据集(假定二分类),然后使用sklearn所提供的线性支持向量机(LinearSVC)方法对其进行分类,求取一个支持向量集并绘图import numpy as npimport matplotlib.pyplot as pltfrom sklearn.svm import LinearSVCfrom sklearn.datasets import make_b...
向量机
首先创建可以分离的样本数据集(假定二分类),然后使用sklearn所提供的线性支持向量机(LinearSVC)方法对其进行分类,求取一个支持向量集并绘图
import numpy as np
import matplotlib.pyplot as plt
from sklearn.svm import LinearSVC
from sklearn.datasets import make_blobs

# 创建随机分布的,可以分离的400个样本点
X, y = make_blobs(n_samples=400, centers=2, random_state=32)
# 创建LinearSVC对象
clf = LinearSVC(C=1000)
clf.fit(X, y)
plt.scatter(X[:, 0], X[:, 1], c=y, s=30, cmap=plt.cm.Paired)
# 画出决策函数
ax = plt.gca()
xlim = ax.get_xlim()
ylim = ax.get_ylim()

# 网格化评价模型
xx = np.linspace(xlim[0], xlim[1], 30)
yy = np.linspace(ylim[0], ylim[1], 30)
YY, XX = np.meshgrid(yy, xx)
xy = np.vstack([XX.ravel(), YY.ravel()]).T
Z = clf.decision_function(xy).reshape(XX.shape)
# 画分类边界
ax.contour(XX, YY, Z, colors='k', levels=[-1, 0, 1], alpha=0.5,
           linestyles=['--', '-', '--'])
plt.title("Maximum margin using LinearSVC")
plt.show()

运用特征脸(eigenface)和sklearn.svm.SVC进行人脸识别。
首先需要下载一个经过预处理的数据集,从数据集中找出最有代表性的前5人的预期结果
第一步,import导入实验所用到的包
import matplotlib.pyplot as plt
from sklearn.model_selection import train_test_split
from sklearn.model_selection import GridSearchCV
from sklearn.datasets import fetch_lfw_people
from sklearn.metrics import classification_report
from sklearn.metrics import confusion_matrix
from sklearn.decomposition import PCA
from sklearn.svm import SVC
第二步,下载人脸数据
lfw_people = fetch_lfw_people(min_faces_per_person=70, resize=0.4)
但是会因为网络问题未下载完,报错。所以应提前下载
“Labeled Faces in the Wild”
http://vis-www.cs.umass.edu/lfw/lfw-funneled.tgz
放在以下文件夹下

第三步,特征提取
X_train, X_test, y_train, y_test = train_test_split(
    X, y, test_size=0.25, random_state=42)


n_components = 150

pca = PCA(n_components=n_components, svd_solver='randomized',
          whiten=True).fit(X_train)

eigenfaces = pca.components_.reshape((n_components, h, w))

X_train_pca = pca.transform(X_train)
X_test_pca = pca.transform(X_test)
第四步,建立SVM分类模型
param_grid = {'C': [1e3, 5e3, 1e4, 5e4, 1e5],
'gamma': [0.0001, 0.0005, 0.001, 0.005, 0.01, 0.1], }
clf = GridSearchCV(SVC(kernel='rbf', class_weight='balanced'), param_grid)
clf = clf.fit(X_train_pca, y_train)
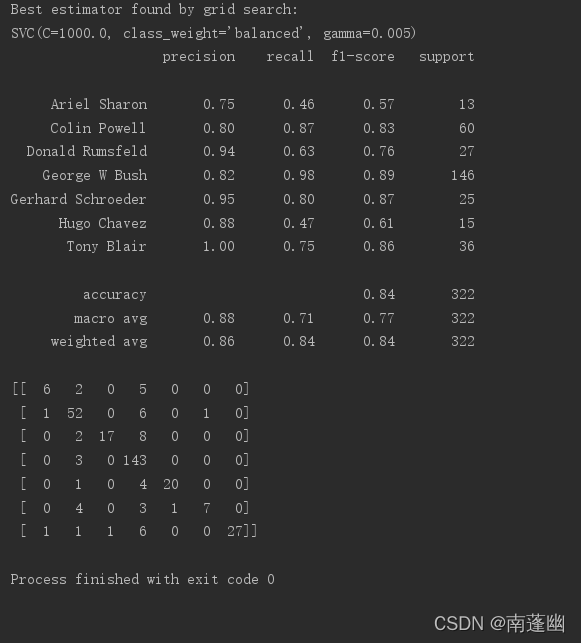
print("Best estimator found by grid search:")
print(clf.best_estimator_)
第五步, 模型评估
y_pred = clf.predict(X_test_pca)

print(classification_report(y_test, y_pred, target_names=target_names))
print(confusion_matrix(y_test, y_pred, labels=range(n_classes)))
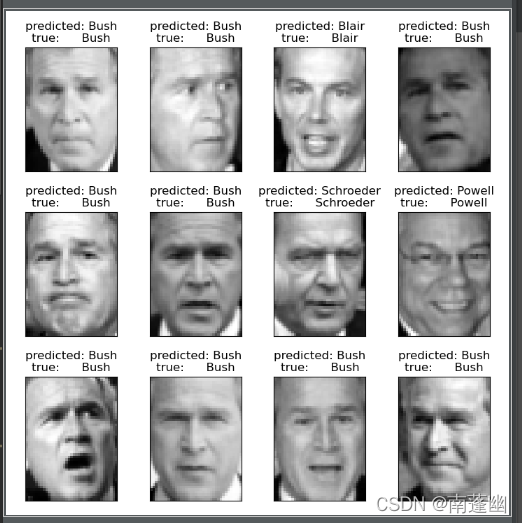
第六步,预测结果可视化
# 预测结果可视化
def plot_gallery(images, titles, h, w, n_row=3, n_col=4):
"""Helper function to plot a gallery of portraits"""
plt.figure(figsize=(1.8 * n_col, 2.4 * n_row))
plt.subplots_adjust(bottom=0, left=.01, right=.99, top=.90, hspace=.35)
for i in range(n_row * n_col):
plt.subplot(n_row, n_col, i + 1)
plt.imshow(images[i].reshape((h, w)), cmap=plt.cm.gray)
plt.title(titles[i], size=12)
plt.xticks(())
plt.yticks(())
# plot the result of the prediction on a portion of the test set
def title(y_pred, y_test, target_names, i):
pred_name = target_names[y_pred[i]].rsplit(' ', 1)[-1]
true_name = target_names[y_test[i]].rsplit(' ', 1)[-1]
return 'predicted: %s\ntrue: %s' % (pred_name, true_name)
prediction_titles = [title(y_pred, y_test, target_names, i)
for i in range(y_pred.shape[0])]
plot_gallery(X_test, prediction_titles, h, w)
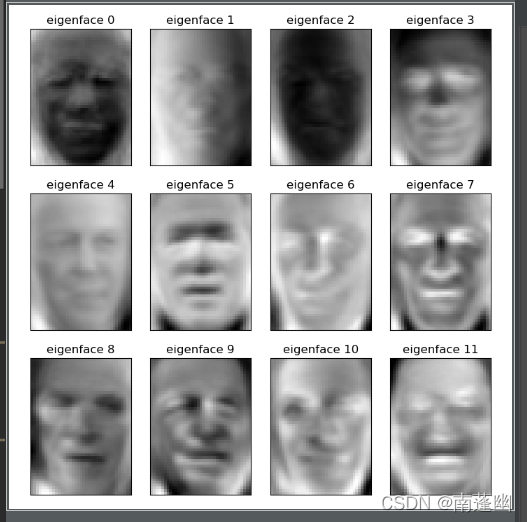
# plot the gallery of the most significative eigenfaces
eigenface_titles = ["eigenface %d" % i for i in range(eigenfaces.shape[0])]
plot_gallery(eigenfaces, eigenface_titles, h, w)
plt.show()
完整代码:
# import导入实验所用到的包
import matplotlib.pyplot as plt
from sklearn.model_selection import train_test_split
from sklearn.model_selection import GridSearchCV
from sklearn.datasets import fetch_lfw_people
from sklearn.metrics import classification_report
from sklearn.metrics import confusion_matrix
from sklearn.decomposition import PCA
from sklearn.svm import SVC
# 下载人脸数据
lfw_people = fetch_lfw_people(min_faces_per_person=70, resize=0.4)

# introspect the images arrays to find the shapes (for plotting)
n_samples, h, w = lfw_people.images.shape

# for machine learning we use the 2 data directly (as relative pixel
# positions info is ignored by this model)
X = lfw_people.data
n_features = X.shape[1]

# the label to predict is the id of the person
y = lfw_people.target
target_names = lfw_people.target_names
n_classes = target_names.shape[0]

# Split into a training set and a test set using a stratified k fold
# split into a training and testing set
# 特征提取
X_train, X_test, y_train, y_test = train_test_split(
    X, y, test_size=0.25, random_state=42)

# Compute a PCA (eigenfaces) on the face dataset (treated as unlabeled
# dataset): unsupervised feature extraction / dimensionality reduction
n_components = 150

pca = PCA(n_components=n_components, svd_solver='randomized',
          whiten=True).fit(X_train)

eigenfaces = pca.components_.reshape((n_components, h, w))

X_train_pca = pca.transform(X_train)
X_test_pca = pca.transform(X_test)

# Train a SVM classification model
# 建立SVM分类模型
param_grid = {'C': [1e3, 5e3, 1e4, 5e4, 1e5],
              'gamma': [0.0001, 0.0005, 0.001, 0.005, 0.01, 0.1], }
clf = GridSearchCV(SVC(kernel='rbf', class_weight='balanced'), param_grid)
clf = clf.fit(X_train_pca, y_train)
print("Best estimator found by grid search:")
print(clf.best_estimator_)

# Quantitative evaluation of the model quality on the test set
# 模型评估
y_pred = clf.predict(X_test_pca)

print(classification_report(y_test, y_pred, target_names=target_names))
print(confusion_matrix(y_test, y_pred, labels=range(n_classes)))

# Qualitative evaluation of the predictions using matplotlib
# 预测结果可视化
def plot_gallery(images, titles, h, w, n_row=3, n_col=4):
    """Helper function to plot a gallery of portraits"""
    plt.figure(figsize=(1.8 * n_col, 2.4 * n_row))
    plt.subplots_adjust(bottom=0, left=.01, right=.99, top=.90, hspace=.35)
    for i in range(n_row * n_col):
        plt.subplot(n_row, n_col, i + 1)
        plt.imshow(images[i].reshape((h, w)), cmap=plt.cm.gray)
        plt.title(titles[i], size=12)
        plt.xticks(())
        plt.yticks(())

# plot the result of the prediction on a portion of the test set
def title(y_pred, y_test, target_names, i):
    pred_name = target_names[y_pred[i]].rsplit(' ', 1)[-1]
    true_name = target_names[y_test[i]].rsplit(' ', 1)[-1]
    return 'predicted: %s\ntrue:      %s' % (pred_name, true_name)


prediction_titles = [title(y_pred, y_test, target_names, i)
                     for i in range(y_pred.shape[0])]
plot_gallery(X_test, prediction_titles, h, w)


# plot the gallery of the most significative eigenfaces
eigenface_titles = ["eigenface %d" % i for i in range(eigenfaces.shape[0])]
plot_gallery(eigenfaces, eigenface_titles, h, w)
plt.show()
运行结果:

【声明】本内容来自华为云开发者社区博主,不代表华为云及华为云开发者社区的观点和立场。转载时必须标注文章的来源(华为云社区)、文章链接、文章作者等基本信息,否则作者和本社区有权追究责任。如果您发现本社区中有涉嫌抄袭的内容,欢迎发送邮件进行举报,并提供相关证据,一经查实,本社区将立刻删除涉嫌侵权内容,举报邮箱:
cloudbbs@huaweicloud.com
- 点赞
- 收藏
- 关注作者
评论(0)