Google earth engine(GEE)——平均气温计算并且显示直方图

美国三个州的平均气温计算并且显示直方图
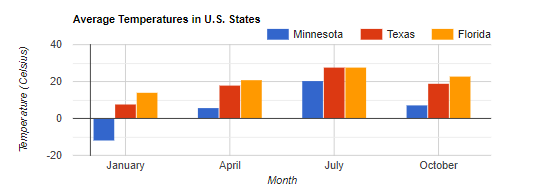
完整的图形是这样的
这是我改了代码之后显示了一年十二个月的一个数据,坐标标签直接改成数字了
这里面有一个数据集OREGONSTATE/PRISM/Norm81m
用数据的时候可以引用这个文章
[Daly, C., J.I. Smith, and K.V. Olson. 2015. Mapping atmospheric moisture climatologies across the conterminous United States. PloS ONE 10(10):e0141140. doi:10.1371/journal.pone.0141140.

ee.Filter.notNull(properties)
如果所有命名属性不为空,则返回一个过滤器。
Returns a filter that passes if all the named properties are not null.
Arguments:
properties (List)过滤的值是一个列表,
Returns: Filter
这次主要用到的函数
ui.Chart.feature.byProperty(features, xProperties, seriesProperty)
Generates a Chart from a set of features. Plots property values of one or more features.
- X-axis = Property name, labeled by xProperties (default: all properties).
- Y-axis = Property value (must be numeric).
- Series = Features, labeled by seriesProperty (default: 'system:index').矢量属性值
All properties except seriesProperty are included on the x-axis by default.
默认情况下,除 seriesProperty 之外的所有属性都包含在 x 轴上。
Returns a chart.
Arguments:
features (Feature|FeatureCollection|List<Feature>):
The features to include in the chart.
xProperties (List<String>|Object|String, optional):
One of (1) a property to be plotted on the x-axis; (2) a list of properties to be plotted on the x-axis; or (3) a (property, label) dictionary specifying labels for properties to be used as values on the x-axis. If omitted, all properties will be plotted on the x-axis, labeled with their names.
seriesProperty (String, optional):
The name of the property used to label each feature in the legend. Defaults to 'system:index'.
Returns: ui.Chart
通过这个案例就是给出的三个州气温,明尼苏达州,德克萨斯州和佛罗里达州,1月,四月,7月和10月,如果想多个月份,只管在months加入元素即可
-
//导入研究区
-
var states = ee.FeatureCollection('TIGER/2018/States');
-
-
// 导入温度法线并将月份特征转换为波段。
-
var normClim = ee.ImageCollection('OREGONSTATE/PRISM/Norm81m')
-
.select(['tmean'])
-
.toBands();
-
-
// 计算每个月每个州的平均值
-
states = normClim.reduceRegions({
-
collection: states,
-
reducer: ee.Reducer.mean(),
-
scale: 5e4})
-
.filter(ee.Filter.notNull(['01_tmean']));
-
-
// 计算每个州1月和7月的温度均值然后给与这个州添加温度差值属性
-
states = states.map(function(state) {
-
var julyTemp = ee.Number(state.get('06_tmean'));
-
var janTemp = ee.Number(state.get('01_tmean'));
-
return state.set('seasonal_delta', julyTemp.subtract(janTemp));
-
});
-
-
// 选择极端的州的天气,通过再次通过merge选取
-
var extremeStates =
-
states.limit(1, '01_tmean') // Coldest.
-
.merge(states.limit(1, '07_tmean', false)) // Hottest.
-
.merge(states.limit(1, 'seasonal_delta')); // Least variation.
-
-
// 分别定义属性值在图表中,对应的月份和对应的温度所匹配
-
// Define properties to chart.
-
var months = {
-
'01_tmean': 1,
-
'02_tmean': 2,
-
'03_tmean': 3,
-
'04_tmean': 4,
-
'05_tmean': 5,
-
'06_tmean': 6,
-
'07_tmean': 7,
-
'08_tmean': 8,
-
'09_tmean': 9,
-
'10_tmean': 10,
-
'11_tmean': 11,
-
'12_tmean': 12
-
};
-
-
// Prepare the chart.
-
var extremeTempsChart =
-
ui.Chart.feature.byProperty(extremeStates, months, 'NAME')
-
.setChartType('LineChart')
-
.setOptions({
-
title: 'Average Temperatures in U.S. States',
-
hAxis: {
-
title: 'Month',
-
ticks: [{v: months['01_tmean'], f: 'January'},
-
{v: months['02_tmean'], f: '2'},
-
{v: months['03_tmean'], f: '3'},
-
{v: months['04_tmean'], f: 'April'},
-
{v: months['05_tmean'], f: '5'},
-
{v: months['06_tmean'], f: '6'},
-
{v: months['07_tmean'], f: 'July'},
-
{v: months['08_tmean'], f: '8'},
-
{v: months['09_tmean'], f: '9'},
-
{v: months['10_tmean'], f: 'October'},
-
{v: months['11_tmean'], f: '11'},
-
{v: months['12_tmean'], f: '12'},]
-
},
-
vAxis: {
-
title: 'Temperature (Celsius)'
-
},
-
lineWidth: 1,
-
pointSize: 3
-
});
-
-
print(extremeTempsChart);
文章来源: blog.csdn.net,作者:此星光明2021年博客之星云计算Top3,版权归原作者所有,如需转载,请联系作者。
原文链接:blog.csdn.net/qq_31988139/article/details/118976744

- 点赞
- 收藏
- 关注作者
评论(0)