matplotlib绘制雷达图之基本配置——万能模板案例

【摘要】
目录
介绍
应用场景
案例一(成绩雷达图重叠)
案例二(成绩雷达图左右图)
极坐标
每文一语
介绍
雷达图是以从同一点开始的轴上表示的三个或更多个定量变量的二维图表的形式显示多变量数据的图形方法。轴的相对位置和角度通常是无信息的。 雷达图也称为网络图,蜘蛛图,星图,蜘蛛网图,不规则多边形,极坐标图或Kivi...
目录
介绍
雷达图是以从同一点开始的轴上表示的三个或更多个定量变量的二维图表的形式显示多变量数据的图形方法。轴的相对位置和角度通常是无信息的。 雷达图也称为网络图,蜘蛛图,星图,蜘蛛网图,不规则多边形,极坐标图或Kiviat图。它相当于平行坐标图,轴径向排列。
应用场景
用于成绩的透视,比如查看你是否偏科,知晓你的兴趣偏向于哪一方面

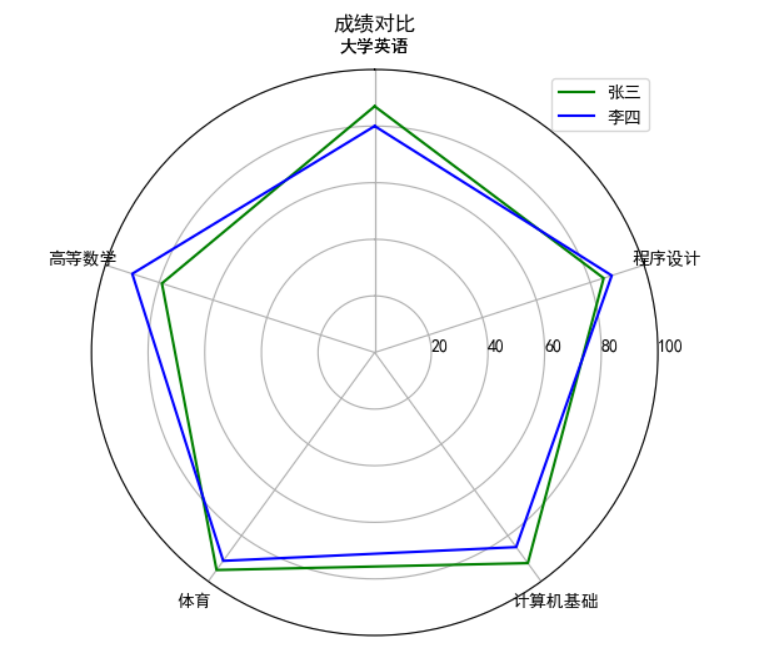
案例一(成绩雷达图重叠)
-
# coding=utf-8
-
import numpy as np
-
import matplotlib.pyplot as plt
-
plt.rcParams['font.sans-serif']=['SimHei'] #显示中文
-
plt.rcParams['axes.unicode_minus']=False #正常显示负号
-
-
results = [
-
{"大学英语": 87, "高等数学": 79, "体育": 95, "计算机基础": 92, "程序设计": 85},
-
{"大学英语": 80, "高等数学": 90, "体育": 91, "计算机基础": 85, "程序设计": 88}
-
]
-
data_length = len(results[0])
-
# 将极坐标根据数据长度进行等分
-
angles = np.linspace(0, 2*np.pi, data_length, endpoint=False)
-
labels = [key for key in results[0].keys()]
-
score = [[v for v in result.values()] for result in results]
-
# 使雷达图数据封闭
-
score_a = np.concatenate((score[0], [score[0][0]]))
-
score_b = np.concatenate((score[1], [score[1][0]]))
-
angles = np.concatenate((angles, [angles[0]]))
-
labels = np.concatenate((labels, [labels[0]]))
-
# 设置图形的大小
-
fig = plt.figure(figsize=(8, 6), dpi=100)
-
# 新建一个子图
-
ax = plt.subplot(111, polar=True)
-
# 绘制雷达图
-
ax.plot(angles, score_a, color='g')
-
ax.plot(angles, score_b, color='b')
-
# 设置雷达图中每一项的标签显示
-
ax.set_thetagrids(angles*180/np.pi, labels)
-
# 设置雷达图的0度起始位置
-
ax.set_theta_zero_location('N') # E W S N SW SE NW NE
-
# 设置雷达图的坐标刻度范围
-
ax.set_rlim(0, 100)
-
# 设置雷达图的坐标值显示角度,相对于 y 起始角度的偏移量
-
ax.set_rlabel_position(270)
-
ax.set_title("成绩对比")
-
plt.legend(["张三", "李四"], loc='best')
-
plt.show()
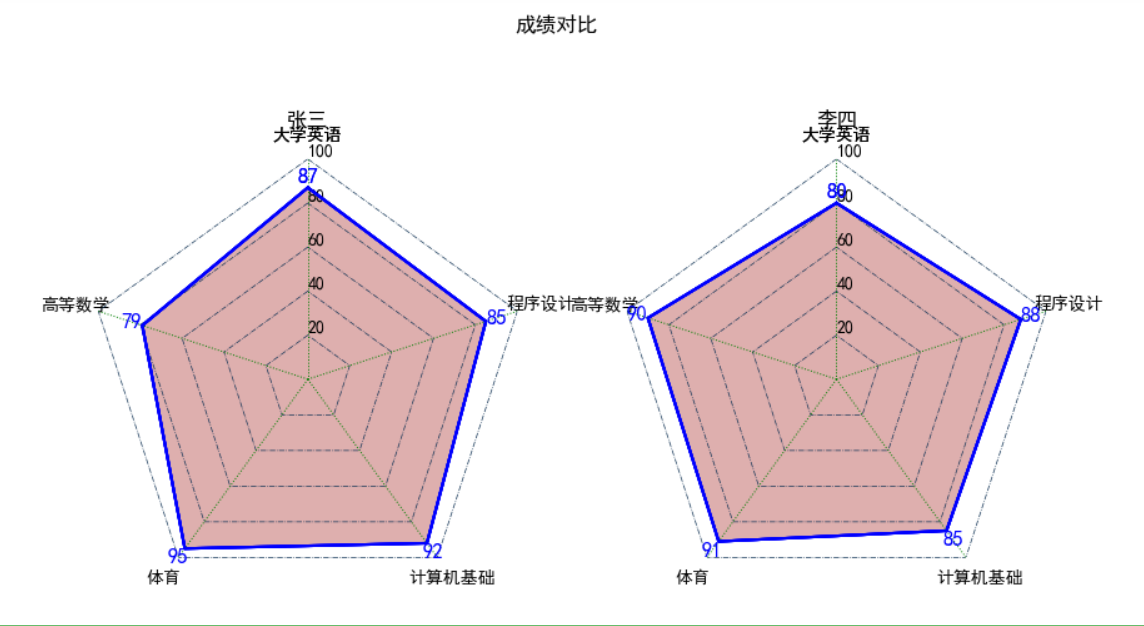
案例二(成绩雷达图左右图)
-
import numpy as np
-
import matplotlib.pyplot as plt
-
plt.rcParams['font.sans-serif']=['SimHei'] #显示中文
-
plt.rcParams['axes.unicode_minus']=False #正常显示负号
-
-
results = [{"大学英语": 87, "高等数学": 79, "体育": 95, "计算机基础": 92, "程序设计": 85},
-
{"大学英语": 80, "高等数学": 90, "体育": 91, "计算机基础": 85, "程序设计": 88}]
-
data_length = len(results[0])
-
angles = np.linspace(0, 2*np.pi, data_length, endpoint=False)
-
labels = [key for key in results[0].keys()]
-
score = [[v for v in result.values()] for result in results]
-
score_a = np.concatenate((score[0], [score[0][0]])) # 将每个数组的第一个元素添加到末尾,首尾相连
-
score_b = np.concatenate((score[1], [score[1][0]])) # 将每个数组的第一个元素添加到末尾,首尾相连
-
angles = np.concatenate((angles, [angles[0]]))
-
labels = np.concatenate((labels, [labels[0]]))
-
fig = plt.figure(figsize=(10, 6), dpi=100)
-
fig.suptitle("成绩对比")
-
ax1 = plt.subplot(121, polar=True)
-
ax2 = plt.subplot(122, polar=True)
-
ax, data, name = [ax1, ax2], [score_a, score_b], ["张三", "李四"]
-
for i in range(2): # 0:左图 张三,1:右图 李四
-
for j in np.arange(0, 100+20, 20):
-
ax[i].plot(angles, 6*[j], '-.', lw=0.5, color='#123456') # 画五边形框,lw=linewidth
-
for j in range(5):
-
ax[i].plot([angles[j], angles[j]], [0, 100], ':', lw=0.7, color='green') # 画5条半径线,每个角度连接圆心0和顶点100
-
ax[i].plot(angles, data[i], color='b') # 在极坐标下画成绩折线图
-
ax[i].fill(angles, data[i],color='#B34543',alpha=0.1)
-
ax[i].spines['polar'].set_visible(False) # 隐藏最外圈的圆
-
# 隐藏圆形网格线
-
ax[i].grid(False)
-
for a, b in zip(angles, data[i]):
-
ax[i].text(a, b+5, '%.00f' % b, ha='center', va='center', fontsize=12, color='b')
-
ax[i].set_thetagrids(angles*180/np.pi, labels)
-
ax[i].set_theta_zero_location('N')
-
ax[i].set_rlim(0, 100)
-
ax[i].set_rlabel_position(0)
-
ax[i].set_title(name[i])
-
plt.show()
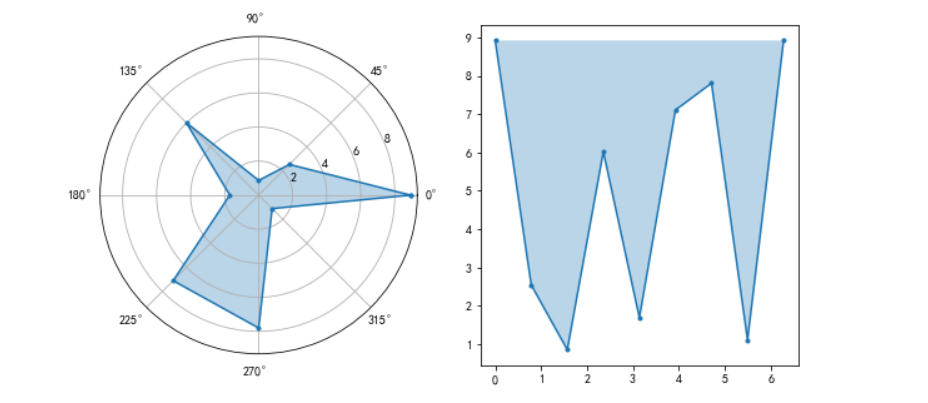
极坐标
-
import matplotlib.pyplot as plt
-
import numpy as np
-
plt.figure(figsize=(10,5)) # 设置画布
-
-
ax1 = plt.subplot(121, projection='polar') # 左图: projection='polar' 表示极坐标系
-
ax2 = plt.subplot(122) # 右图: 默认是直角坐标系
-
-
x = np.linspace(0,2*np.pi,9) # 0 - 2Π 平均划分成9个点 [0,1/4,1/2,3/4,1,5/4/,3/2,7/4,2] 0pi = 2pi
-
y = np.random.random(9)*10 # 随机9个值
-
y[-1] = y[0] # 首位相连
-
-
ax1.plot(x,y,marker='.') # 画左图(ax1) 极坐标 (x表示角度,y表示半径)
-
ax2.plot(x,y,marker='.') # 画右图(ax2)直角坐标 (x表示横轴,y表示纵轴)
-
-
ax1.fill(x,y,alpha=0.3)
-
ax2.fill(x,y,alpha=0.3)
-
-
plt.show()
每文一语
春天来了,夏天还会远吗?
文章来源: wxw-123.blog.csdn.net,作者:王小王-123,版权归原作者所有,如需转载,请联系作者。
原文链接:wxw-123.blog.csdn.net/article/details/124064127

【版权声明】本文为华为云社区用户转载文章,如果您发现本社区中有涉嫌抄袭的内容,欢迎发送邮件进行举报,并提供相关证据,一经查实,本社区将立刻删除涉嫌侵权内容,举报邮箱:
cloudbbs@huaweicloud.com
- 点赞
- 收藏
- 关注作者
评论(0)