Python深度解析matplotlib各种基础图
如果说 pandas 是 python 中一个处理数据的好手,那么 matplotlib 则是把这个数据展现在人们眼球面前的使者,本篇我们来学习一下 matplotlib 的用法和 pyplot 的方式作图,他画图便捷,唯一不足的是我觉得它没有那么高大上。
- Matplotlib 是 python 最著名的会图库,它提供了一整套和 MATLAB
类似的绘图函数集,十分适合编写短小的脚本程序以进行快速绘图。 - Matplotlib 通过 pyplot 模块提供一套和 MATLAB 类似的绘图的 API,将众多绘图对象所构成的复杂的结构隐藏的这套
API 内部。 - 我们可以调用 pyplot 模块所提供的函数就可以实现快速绘图以及设置图标的各种细节,pyplot
模块虽然用法简单,但不适合在较大的应用程序中使用,通常是使用面向对象的方式来画图,本节我们先以 pyplot 的方式绘图。
常用的对象:
Figure 、 可以理解为画板。
Axes 、 理解为画板的上画纸,一个画板上可以放一个以上的画纸。
Labels 、 标签,xlabel,ylabel 分别设置 X,Y 轴的标题文字。
Lim 、 xlim,ylim 分别设置 X,Y 轴的显示范围。
Legend 、 显示图示,即图中表示每条曲线的标签和样式的矩形区域。
常用图形
Plot 散列图
from matplotlib import pyplot as plt #绘图库
import numpy as np  #科学计算
x=np.linspace(1,10,100) #等差数列
y=np.sin(x)
z=np.cos(x)
plt.figure(figsize=(10,4))
plt.plot(x,y,label="$sin(x)",color='r',linewidth=2)
plt.plot(x,z,label="$cos(x)",color='g',linewidth=2)
plt.xlabel('X')
plt.ylabel('Y')
plt.title("plt test")
plt.legend()
plt.show()
- 1
- 2
- 3
- 4
- 5
- 6
- 7
- 8
- 9
- 10
- 11
- 12
- 13
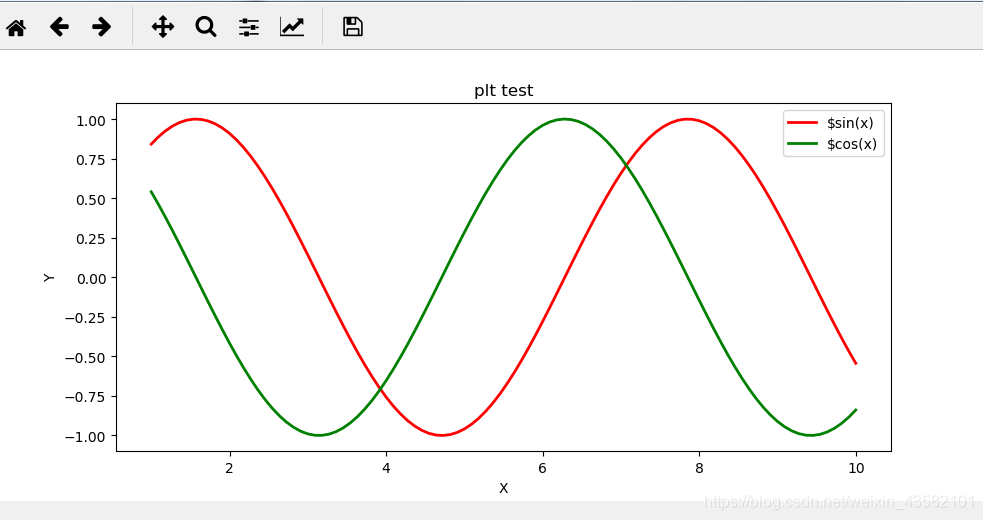
由于画图里的对象太多,属性更多,为了清晰思路,建议使用面向对象的方式来画图。下图为效果:

Scatter 散点图
from matplotlib import pyplot as plt
import numpy as np
x = np.random.randint(1,10,20)
y = np.random.randint(1,10,20)
plt.figure(figsize=(10,4))
plt.scatter(x,y,s=x*100,label="$xy",marker=(5,1))
plt.xlabel('X')
plt.xlabel('Y')
plt.title("plt test")
plt.legend()
plt.show()
- 1
- 2
- 3
- 4
- 5
- 6
- 7
- 8
- 9
- 10
- 11
S 代表散点的面积大小,marker 的第一个参数代表散点的边数,第二个参数代表三
点的样式,0 代表多边形,1 代表星形,2 代表放射形,3 表示忽略边形也就是圆
形。

Pie 饼图
from matplotlib import pyplot as plt
import numpy as np
x=[4,5,6]
plt.figure()
plt.pie(x,labels=list('abc'),colors=list('gbr'))
plt.xlabel('X')
plt.ylabel('Y')
plt.title('plt test')
plt.legend()
plt.show()
- 1
- 2
- 3
- 4
- 5
- 6
- 7
- 8
- 9
- 10

Labels 代表每一块的标签,colors 是每一块的颜色。可以调整 figsize 调整大小。
可以改变是圆还是椭圆,如果是正方形的 figsize 就是正圆,否则就是椭圆。
Bar 条形图
from matplotlib import pyplot as plt
import numpy as np
x=[1,2,3,4]
y=[6,5,7,4]
y1=[2,3,4,5]
plt.figure(figsize=(10,6))
plt.bar(x,height=y,color='b',width=0.35,label='man')
plt.bar(np.array(x)+0.35,height=y1,color='g',width=0.35,label='woman')
plt.xlabel('X')
plt.ylabel('Y')
plt.title('plt test')
plt.legend()
plt.show()
- 1
- 2
- 3
- 4
- 5
- 6
- 7
- 8
- 9
- 10
- 11
- 12
- 13

Bar 可以绘制柱状图,width 设置的是条状的宽度,在这里需要留意下,list 不能
直接和数字相加,需要用 np.array 转化为数组。看看效果。
条状图
使用barh可以画条状图。
from matplotlib import pyplot as plt
import numpy as np
x=[1,2,3,4]
y=[6,5,7,4]
y1=[2,3,4,5]
plt.figure(figsize=(10,6))
plt.barh(np.array(x)-0.5,width=y,color='b',label='man')
plt.barh(np.array(x)+0.5,width=y1,color='r',label='woman')
plt.xlabel('X')
plt.ylabel('Y')
plt.title('plt test')
plt.legend()
plt.show()
- 1
- 2
- 3
- 4
- 5
- 6
- 7
- 8
- 9
- 10
- 11
- 12
- 13

Contour 环形图
from matplotlib import pyplot as plt
import numpy as np
x,y = np.ogrid[-1:1:5j,-1:1:5j]
f = x**2+y**2
plt.contour(f,colors=list('gbr'))
plt.xlabel('X')
plt.xlabel('Y')
plt.title('plt test')
plt.legend()
plt.show()
- 1
- 2
- 3
- 4
- 5
- 6
- 7
- 8
- 9
- 10
环形图一般用来画等高线,工作用到不多。不太理解。实现效果如下

文章来源: blog.csdn.net,作者:考古学家lx,版权归原作者所有,如需转载,请联系作者。
原文链接:blog.csdn.net/weixin_43582101/article/details/88344933
- 点赞
- 收藏
- 关注作者


评论(0)