LBA-ECO ND-01 巴西朗多尼亚河流和流域特征:1998-1999

【摘要】 LBA-ECO ND-01 Streamwater and Watershed Characteristics, Rondonia, Brazil: 1998-1999简介该数据集提供了(1)来自朗多尼亚州众多地点的溪流水质采样和分析结果,以及(2)来自遥感和巴西数据源的相应流域特征。1998 年 8 月旱季期间,对森林和非森林地区的 60 条溪流进行了一次采样,1999 年 1 月至 2...
LBA-ECO ND-01 Streamwater and Watershed Characteristics, Rondonia, Brazil: 1998-1999
简介
该数据集提供了(1)来自朗多尼亚州众多地点的溪流水质采样和分析结果,以及(2)来自遥感和巴西数据源的相应流域特征。
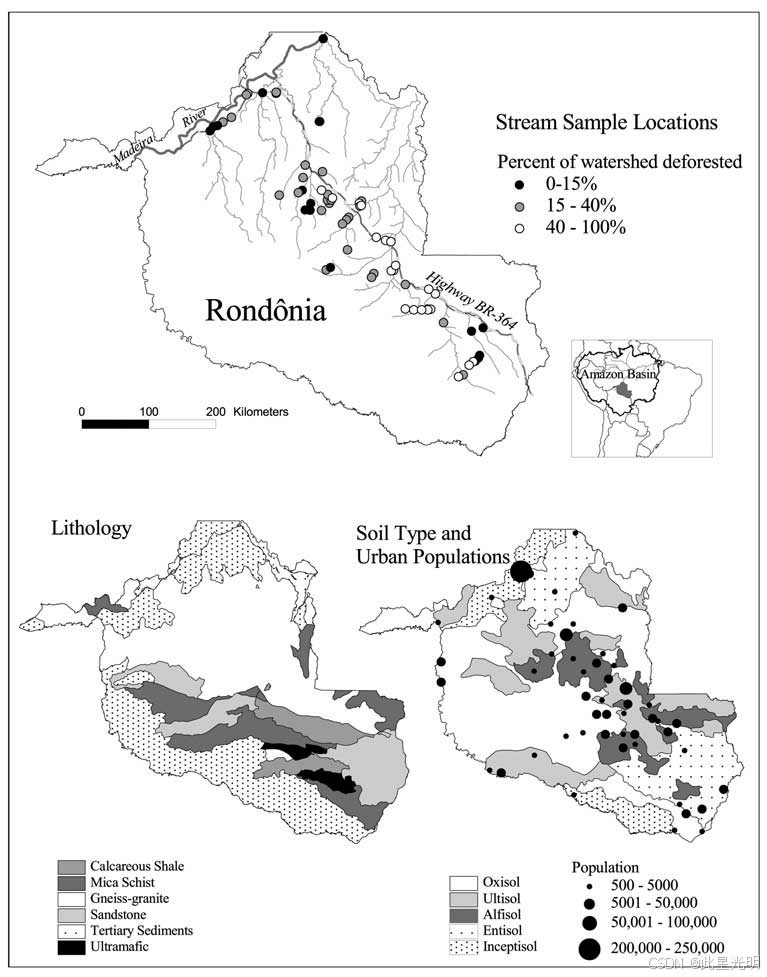
1998 年 8 月旱季期间,对森林和非森林地区的 60 条溪流进行了一次采样,1999 年 1 月至 2 月雨季期间,对 49 条相同的溪流进行了再次采样。分析内容包括钠 (Na)、钙 (Ca)、镁 (Mg)、钾 (K)、二氧化硅 (Si)、氯化物 (Cl)、硫酸盐、pH 值和酸中和能力。
流域特征包括土壤阳离子含量、pH 值、流域岩性、面积、森林砍伐百分比和城市流域人口密度,这些特征均来自数字化土壤图和土壤剖面数据、数字化地形图、Landsat 专题制图仪 (TM) 图像的土地利用镶嵌图以及巴西人口普查数据。
本研究旨在确定流域土壤可交换阳离子含量、岩石类型、森林砍伐和城市人口密度对正在经历区域土地利用转型的湿润热带地区旱季和雨季河流中盐基阳离子、溶解性硅、氯化物和硫酸盐浓度的相对影响。该数据集包含三个以逗号分隔的数据文件。
摘要
| Column | Heading | Units/format | Description |
|---|---|---|---|
| 1 | Watershed_ID | Watershed identification code. F indicates forested watersheds. There were 60 sampling sites; each stream sampled had only 1 sampling site | |
| 2 | Sample_date | YYYYMMDD | Sampling date |
| 3 | Latitude | decimal degrees | Latitude of sampling location in decimal degrees: negative values indicate S |
| 4 | Longitude | decimal degrees | Longitude of sampling location in decimal degrees: negative values indicate W |
| 5 | NNa | umol/L | Streamwater sodium concentration in micromoles per liter (umol/L) |
| 6 | Ca | umol/L | Streamwater calcium concentration in micromoles per liter (umol/L) |
| 7 | Mg | umol/L | Streamwater magnesium concentration in micromoles per liter (umol/L) |
| 8 | K | umol/L | Streamwater potassium concentration in micromoles per liter (umol/L) |
| 9 | Si | umol/L | Streamwater silica concentration in micromoles per liter (umol/L) |
| 10 | Cl | umol/L | Streamwater chloride concentration in micromoles per liter (umol/L) |
| 11 | SO4 | umol/L | Streamwater sulfate concentration in micromoles per liter (umol/L) |
| 12 | ANC | ueq/L | Streamwater acid neutralizing capacity measured via titration and reported in microequivalents per liter (ueq/L) |
| 13 | pH | Streamwater pH | |
| Missing data are represented by -9999 | |||
代码
!pip install leafmap
!pip install pandas
!pip install folium
!pip install matplotlib
!pip install mapclassify

import pandas as pd
import leafmap

url = "https://github.com/opengeos/NASA-Earth-Data"
df = pd.read_csv(url, sep="\t")
df

leafmap.nasa_data_login()


results, gdf = leafmap.nasa_data_search(
    short_name="ND01_Stream_Chemistry_1119",
    cloud_hosted=True,
    bounding_box=(-64.43, -12.63, -60.7, -8.0),
    temporal=("1998-08-02", "1999-01-28"),
    count=-1,  # use -1 to return all datasets
    return_gdf=True,
)


gdf.explore()

#leafmap.nasa_data_download(results[:5], out_dir="data")
【声明】本内容来自华为云开发者社区博主,不代表华为云及华为云开发者社区的观点和立场。转载时必须标注文章的来源(华为云社区)、文章链接、文章作者等基本信息,否则作者和本社区有权追究责任。如果您发现本社区中有涉嫌抄袭的内容,欢迎发送邮件进行举报,并提供相关证据,一经查实,本社区将立刻删除涉嫌侵权内容,举报邮箱:
cloudbbs@huaweicloud.com
- 点赞
- 收藏
- 关注作者
评论(0)