【数据可视化应用】绘制峰峦图(附R语言代码)

【摘要】
1.数据结构
这里使用base包中的diamonds数据集做例子。
# librarylibrary(ggridges) # Ridgeline Plots in 'ggplot2', CRAN v0.5.2library(ggplot2) # Create Elegant Data Visualisations Using the...
1.数据结构
这里使用base包中的diamonds数据集做例子。
-
# library
-
library(ggridges) # Ridgeline Plots in 'ggplot2', CRAN v0.5.2
-
library(ggplot2) # Create Elegant Data Visualisations Using the Grammar of Graphics, CRAN v3.3.2
-
head(diamonds)

2.绘图教程
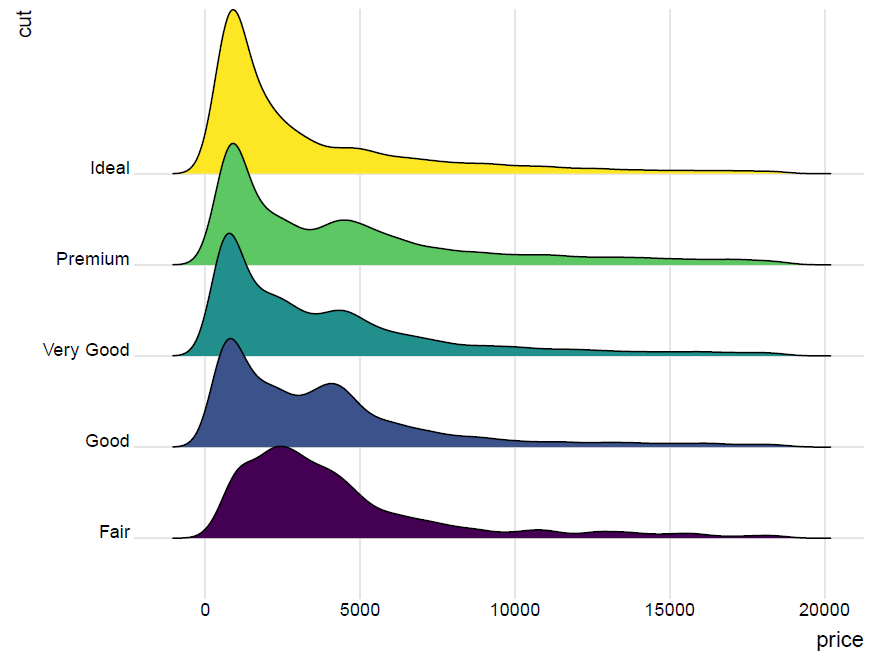
2.1基础版本
使用price作为x轴, cut为y轴,fill参数也是设定为cut。geom_density_ridges()内部全部使用默认参数,并使用了gridges包中theme_ridges()主题。
-
ggplot(diamonds, aes(x = price, y = cut, fill = cut)) +
-
geom_density_ridges() +
-
theme_ridges() +
-
theme(legend.position = "none")
-
2
文章来源: wenyusuran.blog.csdn.net,作者:文宇肃然,版权归原作者所有,如需转载,请联系作者。
原文链接:wenyusuran.blog.csdn.net/article/details/122540374

【版权声明】本文为华为云社区用户转载文章,如果您发现本社区中有涉嫌抄袭的内容,欢迎发送邮件进行举报,并提供相关证据,一经查实,本社区将立刻删除涉嫌侵权内容,举报邮箱:
cloudbbs@huaweicloud.com
- 点赞
- 收藏
- 关注作者
评论(0)