OpenCV-几何形状颜色识别

【摘要】
文章目录
题目思路代码结果参考资料
题目
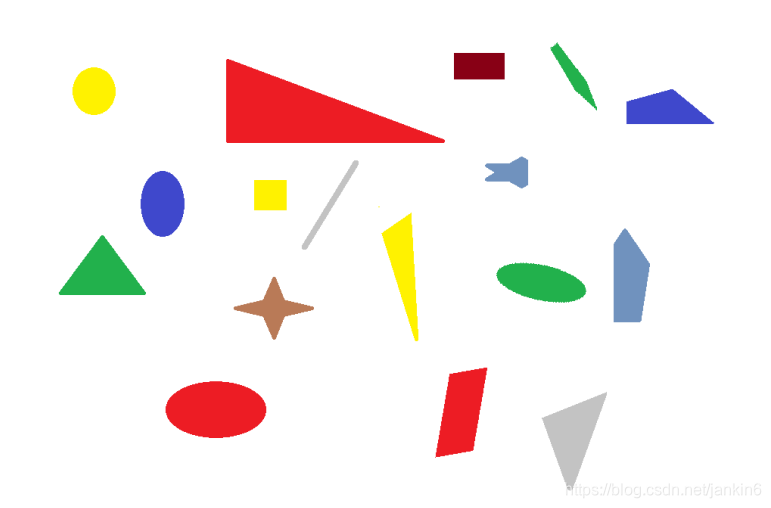
请编写程序将图像Image中的三角形找到,并且以接近于图像中心的三角形作为根节点,距离其最近的三角形作为其左节点,次近的作为其右节点,建立一...
题目
请编写程序将图像Image中的三角形找到,并且以接近于图像中心的三角形作为根节点,距离其最近的三角形作为其左节点,次近的作为其右节点,建立一个二叉树来表示和存储图中的三角形,其中二叉树中每个节点包括:三角形的位置、其父节点的位置(若为个节点,坐标为(-1,-1))、三角形的颜色、三角形的面积。
请输出二叉树
思路
-
先先识别三角形,就先转成二值图像, 然后使用轮廓发现findContours相关函数,提取与绘制轮廓,最后用approxPolyDP对其进行轮廓逼近,
-
然后对三角形找到中心点 ,需要用moments计算一阶几何距得到指定轮廓的中心位置
-
然后的到的三角形中心位置坐标可以用来得出三角形的坐标和颜色
-
“以接近于图像中心的三角形作为根节点,距离其最近的三角形作为其左节点,次近的作为其右节点”在构成二叉树的时候(我印象中学习机器学习的时候貌似记得有个KNN算法,实现有点麻烦),这里我是直接用两点之间开方计算距离。
-
后面二叉树的,先按照距离进行排序,然后插入节点
-
打印节点
代码
# -*- coding: utf-8 -*-
#引入必要工具
import cv2 as cv
import numpy as np
import math
#计算距离
def caculateDistance(a, b):
return math.sqrt(math.pow(a[0] - b[0], 2) + math.pow(a[1] - b[1], 2))
class Node:
def __init__(self, pos, area, color):
# 节点内容:面积,颜色,坐标,左子树,右子树,父节点
self.area = area
self.color = color
self.pos = pos
self.left = None
self.right = None
self.Parent = None
#添加左子树
def addLeft(self, l):
self.left = l
# 添加右子树
def addRight(self, r):
self.right = r
# 添加父节点
def GetParent(self):
return self.Parent
#定义树
class Tree:
def __init__(self):
self.root = None
def addroot(self, root):
self.root = root
class ShapeAnalysis:
def __init__(self):
self.shapes = {'triangle': 0, 'rectangle': 0, 'polygons': 0, 'circles': 0}
self.i = 0
def analysis(self, frame, tree):
h, w, ch = frame.shape
result = np.zeros((h, w, ch), dtype=np.uint8)
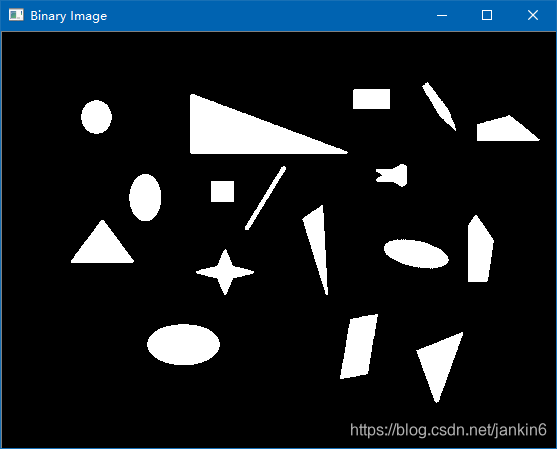
# 二值化图像
print("start to detect lines...\n")
gray = cv.cvtColor(frame, cv.COLOR_BGR2GRAY)
ret, binary = cv.threshold(gray, 230, 255, cv.THRESH_BINARY_INV)
triangles = {}
cv.imshow("Binary Image", binary)
out_binary, contours, hierarchy = cv.findContours(binary, cv.RETR_EXTERNAL, cv.CHAIN_APPROX_SIMPLE)
for cnt in range(len(contours)):
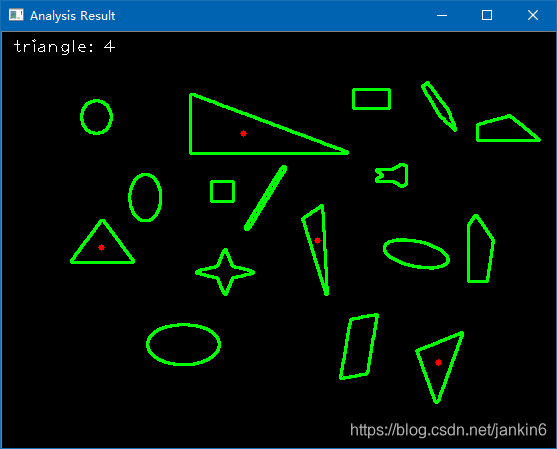
# 提取与绘制轮廓
cv.drawContours(result, contours, cnt, (0, 255, 0), 2)
# 轮廓逼近
epsilon = 0.012 * cv.arcLength(contours[cnt], True)
approx = cv.approxPolyDP(contours[cnt], epsilon, True)
# 分析几何形状
corners = len(approx)
shape_type = []
if corners == 3:
count = self.shapes['triangle']
count = count + 1
self.shapes['triangle'] = count
shape_type = "三角形"
# 求中心位置
mm = cv.moments(contours[cnt])
cx = int(mm['m10'] / mm['m00'])
cy = int(mm['m01'] / mm['m00'])
if shape_type == "三角形":
cv.circle(result, (cx, cy), 3, (0, 0, 255), -1)
# 计算颜色
color = frame[cy][cx]
color_str = "(" + str(color[0]) + ", " + str(color[1]) + ", " + str(color[2]) + ")"
# 计算面积
area = cv.contourArea(contours[cnt])
# 判断三角形
if shape_type == "三角形":
n = Node([cx, cy], area, color)
triangles[self.i] = n
self.i = self.i + 1
print("-------------------------------------")
print("第%d个三角形:"%self.i)
print(" 坐标 %s 面积: %.3f 颜色: %s " % ((cx, cy), area, color_str))
print("-------------------------------------")
cv.imshow("Analysis Result", self.draw_text_info(result))
center = [frame.shape[0] / 2, frame.shape[1] / 2]
print("图片中心位置:%s"%center)
print("-------------------------------------")
dis = {}
# 以接近于图像中心的三角形作为根节点,
# 距离其最近的三角形作为其左节点,次近的作为其右节点
for j in range(4):
dis[j] = caculateDistance(center, triangles[j].pos)
for j in range(4):
for k in range(4):
if (dis[j] < dis[k]):
temp = dis[k]
dis[k] = dis[j]
dis[j] = temp
temp1 = triangles[k]
triangles[k] = triangles[j]
triangles[j] = temp1
for j in range(len(triangles)):
print(dis[j])
print(triangles[j].pos)
tree.addroot(triangles[0])
x = Node([-1, -1], 0, [-1, -1, -1])
triangles[0].Parent = x
triangles[0].addLeft(triangles[1])
triangles[1].Parent = triangles[0]
triangles[0].addRight(triangles[2])
triangles[2].Parent = triangles[0]
triangles[1].addLeft(triangles[3])
triangles[3].Parent = triangles[1]
# 3和2号没有子树,1号没有右子树
y = Node([0, 0], 0, [-1, -1, -1])
triangles[3].addLeft(y)
triangles[3].addRight(y)
triangles[2].addLeft(y)
triangles[2].addRight(y)
triangles[1].addRight(y)
for k in range(4):
print("-------------------------------------")
print("第%d节点 面积%.3f 颜色%s 父节点%s 自己节点%s 左子树%s 右子树%s "% (k,(triangles[k].area),(triangles[k].color),(triangles[k].Parent.pos),(triangles[k].pos),(triangles[k].left.pos),(triangles[k].right.pos)))
return self.shapes
def draw_text_info(self, image):
c1 = self.shapes['triangle']
cv.putText(image, "triangle: " + str(c1), (10, 20), cv.FONT_HERSHEY_PLAIN, 1.2, (255, 255, 255), 1)
return image
if __name__ == "__main__":
src = cv.imread("D:/picture/11.png")
tree = Tree()
ld = ShapeAnalysis()
ld.analysis(src, tree)
cv.waitKey(-1)
- 1
- 2
- 3
- 4
- 5
- 6
- 7
- 8
- 9
- 10
- 11
- 12
- 13
- 14
- 15
- 16
- 17
- 18
- 19
- 20
- 21
- 22
- 23
- 24
- 25
- 26
- 27
- 28
- 29
- 30
- 31
- 32
- 33
- 34
- 35
- 36
- 37
- 38
- 39
- 40
- 41
- 42
- 43
- 44
- 45
- 46
- 47
- 48
- 49
- 50
- 51
- 52
- 53
- 54
- 55
- 56
- 57
- 58
- 59
- 60
- 61
- 62
- 63
- 64
- 65
- 66
- 67
- 68
- 69
- 70
- 71
- 72
- 73
- 74
- 75
- 76
- 77
- 78
- 79
- 80
- 81
- 82
- 83
- 84
- 85
- 86
- 87
- 88
- 89
- 90
- 91
- 92
- 93
- 94
- 95
- 96
- 97
- 98
- 99
- 100
- 101
- 102
- 103
- 104
- 105
- 106
- 107
- 108
- 109
- 110
- 111
- 112
- 113
- 114
- 115
- 116
- 117
- 118
- 119
- 120
- 121
- 122
- 123
- 124
- 125
- 126
- 127
- 128
- 129
- 130
- 131
- 132
- 133
- 134
- 135
- 136
- 137
- 138
- 139
- 140
- 141
- 142
- 143
- 144
- 145
- 146
- 147
- 148
- 149
- 150
- 151
- 152
- 153
- 154
- 155
- 156
- 157
- 158
- 159
结果
图像处理
控制台输出结果
Python 3.6.4 |Anaconda, Inc.| (default, Jan 16 2018, 10:22:32) [MSC v.1900 64 bit (AMD64)] on win32
runfile('C:/Users/Jackinsun/Desktop/untitled0.py', wdir='C:/Users/Jackinsun/Desktop')
start to detect lines...
-------------------------------------
第1个三角形:
 坐标 (436, 330) 面积: 1447.500 颜色: (195, 195, 195)
-------------------------------------
第2个三角形:
 坐标 (99, 215) 面积: 1393.500 颜色: (76, 177, 34)
-------------------------------------
第3个三角形:
 坐标 (315, 208) 面积: 965.500 颜色: (0, 243, 255)
-------------------------------------
第4个三角形:
 坐标 (241, 101) 面积: 4813.500 颜色: (36, 28, 237)
-------------------------------------
图片中心位置:[208.0, 277.0]
-------------------------------------
125.39936203984452
[99, 215]
127.3184982632139
[315, 208]
179.06702655709677
[241, 101]
234.07904647789388
[436, 330]
-------------------------------------
第0节点   面积1393.500   颜色[ 76 177  34]   父节点[-1, -1]  自己节点[99, 215]  左子树[315, 208]  右子树[241, 101]
-------------------------------------
第1节点   面积965.500   颜色[  0 243 255]   父节点[99, 215]  自己节点[315, 208]  左子树[436, 330]  右子树[0, 0]
-------------------------------------
第2节点   面积4813.500   颜色[ 36  28 237]   父节点[99, 215]  自己节点[241, 101]  左子树[0, 0]  右子树[0, 0]
-------------------------------------
第3节点   面积1447.500   颜色[195 195 195]   父节点[315, 208]  自己节点[436, 330]  左子树[0, 0]  右子树[0, 0]
- 1
- 2
- 3
- 4
- 5
- 6
- 7
- 8
- 9
- 10
- 11
- 12
- 13
- 14
- 15
- 16
- 17
- 18
- 19
- 20
- 21
- 22
- 23
- 24
- 25
- 26
- 27
- 28
- 29
- 30
- 31
- 32
- 33
- 34
- 35
参考资料
Python OpenCV Color Detection Example
Simple shape detection – Opencv with Python 3
OpenCV Python Tutorial For Beginners 25 - Detect Simple Geometric Shapes using OpenCV in Python
文章来源: hiszm.blog.csdn.net,作者:孙中明,版权归原作者所有,如需转载,请联系作者。
原文链接:hiszm.blog.csdn.net/article/details/105670114

【版权声明】本文为华为云社区用户转载文章,如果您发现本社区中有涉嫌抄袭的内容,欢迎发送邮件进行举报,并提供相关证据,一经查实,本社区将立刻删除涉嫌侵权内容,举报邮箱:
cloudbbs@huaweicloud.com
- 点赞
- 收藏
- 关注作者
评论(0)