Boston房价PaddlePaddle测试程序

【摘要】
➤01 测试背景
这个例子来自于 《飞浆PaddlePaddle深度学习实战》 第45页的一个例子。使用线性回归来对 波士顿房价数据集合 中的房价进行拟合。
本文记录的参照 《飞浆...
➤01 测试背景
这个例子来自于 《飞浆PaddlePaddle深度学习实战》 第45页的一个例子。使用线性回归来对 波士顿房价数据集合 中的房价进行拟合。
本文记录的参照 《飞浆PaddlePaddle深度学习实战》 中的例子过程。
➤02 数据集合
1.获取数据集合
参照波士顿房价数据集合网页中给定的获取波士顿房价数据的举例,将获取的信息存储在本地的python数据文件中。
from sklearn.datasets       import load_boston
X,y = load_boston(return_X_y=True)
tspsave('boston', X=X,y=y)
这是由于每次从网络上调用 load_boston比较占用时间。所以将相关数据存储在本地可以节省每次程序运行的时间。
- X.shape = (506, 13)
- y.shape= (506)
2.数据集合展示
(1) 数据集合含义
根据 Boston house prices dataset 中介绍,X中存储着每个房子的相关的属性:
- CRIM per capita crime rate by town
- ZN proportion of residential land zoned for lots over 25,000 sq.ft.
- INDUS proportion of non-retail business acres per town
- CHAS Charles River dummy variable (= 1 if tract bounds river; 0 otherwise)
- NOX nitric oxides concentration (parts per 10 million)
- RM average number of rooms per dwelling
- AGE proportion of owner-occupied units built prior to 1940
- DIS weighted distances to five Boston employment centres
- RAD index of accessibility to radial highways
- TAX full-value property-tax rate per $10,000
- PTRATIO pupil-teacher ratio by town
- B 1000(Bk - 0.63)^2 where Bk is the proportion of blacks by town
- LSTAT % lower status of the population
- MEDV Median value of owner-occupied homes in $1000’s
y是房子的房价
2.房价与低收入人群比例之间的关系
从下图中可以看到房价与该地区低收入人群比例之间是一个反向相关关系。低收入人群的比例越高,房价越低。

▲ 房价与低收入人群比例之间的关系
➤03 数据集合预处理
1.数据max,min,mean
X, y = tspload('boston', 'X', 'y')

#------------------------------------------------------------
Xmax = X.max(axis=0)
Xmin = X.min(axis=0)
Xmean = X.sum(axis=0)/X.shape[0]
ymax = y.max
ymin = y.min
ymean = y.sum()/y.shape[0]

printf(Xmax, Xmin, Xmean, ymax, ymin, ymean)
2.数据归一化
将数据进行归一化,并按照80%划分为train_data, test_data
def load_data():
    X, y = tspload('boston', 'X', 'y')
    XY = hstack((X, y.reshape(-1, 1)))
    printf(XY.shape)

    XYmax = XY.max(axis=0)
    XYmin = XY.min(axis=0)
    XYmean = XY.sum(axis=0)/XY.shape[0]

    for i in range(XY.shape[1]):
        XY[:, i] = (XY[:, i] - XYmean[i]) / (XYmax[i] - XYmin[i])

    ratio = 0.8
    offset =int(X.shape[0] * ratio)
    train_data = XY[:offset]
    test_data  = XY[offset:]

    return train_data, test_data

train_data, test_data = load_data()
➤04 线性回归训练
#!/usr/local/bin/python
# -*- coding: gbk -*-
#============================================================
# TEST1.PY                     -- by Dr. ZhuoQing 2020-11-22
#
# Note:
#============================================================

from headm import *

import paddle
import paddle.fluid as fluid
import paddle.fluid.dygraph as dygraph
from paddle.fluid.dygraph import Linear

#------------------------------------------------------------
def load_data():
    X, y = tspload('boston', 'X', 'y')
    XY = hstack((X, y.reshape(-1, 1)))
    printf(XY.shape)

    XYmax = XY.max(axis=0)
    XYmin = XY.min(axis=0)
    XYmean = XY.sum(axis=0)/XY.shape[0]

    for i in range(XY.shape[1]):
        XY[:, i] = (XY[:, i] - XYmean[i]) / (XYmax[i] - XYmin[i])

    ratio = 0.8
    offset =int(X.shape[0] * ratio)
    train_data = XY[:offset]
    test_data  = XY[offset:]

    return train_data, test_data

train_data, test_data = load_data()

#------------------------------------------------------------
class Regressor(fluid.dygraph.Layer):
    def __init__(self, name_scope):
        super(Regressor, self).__init__(name_scope)

        self.fc = Linear(input_dim = 13, output_dim=1, act =None)

    def forward(self, inputs):
        x = self.fc(inputs)
        return x

#------------------------------------------------------------
with fluid.dygraph.guard():
    model = Regressor("Regressor")
    model.train()
    training_data, test_data = load_data()

    printf(training_data[10:20])

    opt = fluid.optimizer.SGD(learning_rate=0.01, parameter_list=model.parameters())

with dygraph.guard(fluid.CPUPlace()):
    EPOCH_NUM = 100
    BATCH_SIZE = 10

    for epoch_id in range(EPOCH_NUM):
        random.shuffle(training_data)
        mini_batches = [training_data[k:k+BATCH_SIZE] for k in range(0, len(train_data), BATCH_SIZE)]
        for iter_id, mini_batch in enumerate(mini_batches):
            x = mini_batch[:, :-1].astype('float32')
            y = mini_batch[:, -1:].astype('float32')

#            printf(x.shape, y.shape)

            house_features = dygraph.to_variable(x)
            prices = dygraph.to_variable(y)

            predicts = model(house_features)
            loss = fluid.layers.square_error_cost(predicts, label=prices)
            avg_loss = fluid.layers.mean(loss)

            if iter_id%20 == 0:
                printf("epoch:{}, iter:{}, loss is:{}".format(epoch_id, iter_id, avg_loss.numpy()))

            avg_loss.backward()
            opt.minimize(avg_loss)
            model.clear_gradients()

    fluid.save_dygraph(model.state_dict(), "LR_model")

with fluid.dygraph.guard():
    fluid.save_dygraph(model.state_dict(), 'LR_model')
    printf("Save the model into LR_model.")

#------------------------------------------------------------
#        END OF FILE : TEST1.PY
#============================================================
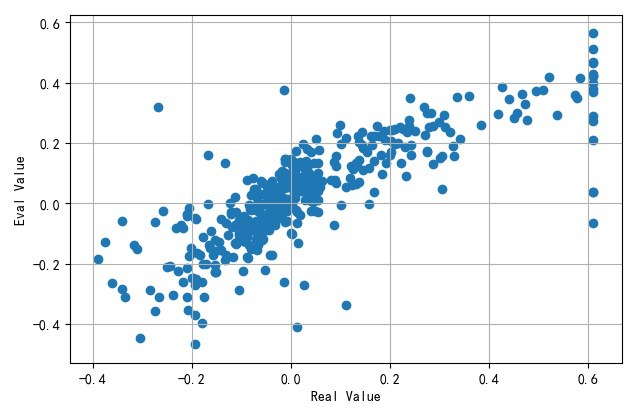
▲ 模型输出与实际取值
#!/usr/local/bin/python
# -*- coding: gbk -*-
#============================================================
# TEST2.PY                     -- by Dr. ZhuoQing 2020-11-22
#
# Note:
#============================================================

from headm import *
import paddle
import paddle.fluid as fluid
import paddle.fluid.dygraph as dygraph
from paddle.fluid.dygraph import Linear

#------------------------------------------------------------
def load_data():
    X, y = tspload('boston', 'X', 'y')
    XY = hstack((X, y.reshape(-1, 1)))
#    printf(XY.shape)

    XYmax = XY.max(axis=0)
    XYmin = XY.min(axis=0)
    XYmean = XY.sum(axis=0)/XY.shape[0]

    for i in range(XY.shape[1]):
        XY[:, i] = (XY[:, i] - XYmean[i]) / (XYmax[i] - XYmin[i])

    ratio = 0.8
    offset =int(X.shape[0] * ratio)
    train_data = XY[:offset]
    test_data  = XY[offset:]

    return train_data, test_data

train_data, test_data = load_data()
train_data = train_data.astype('float32')
test_data = test_data.astype('float32')

#------------------------------------------------------------
class Regressor(fluid.dygraph.Layer):
    def __init__(self, name_scope):
        super(Regressor, self).__init__(name_scope)

        self.fc = Linear(input_dim = 13, output_dim=1, act =None)

    def forward(self, inputs):
        x = self.fc(inputs)
        return x

#------------------------------------------------------------
with fluid.dygraph.guard():
    model = Regressor("Regressor")
    model.eval()

with dygraph.guard():
    model_dict, _ = fluid.load_dygraph(r"d:\temp\temp0001\LR_model")
    model.load_dict(model_dict)

    eval_data = dygraph.to_variable(train_data[:,:-1])
    result = model(eval_data).numpy()

    plt.scatter(train_data[:,-1:], result)
    plt.xlabel("Real Value")
    plt.ylabel("Eval Value")
    plt.grid(True)
    plt.tight_layout()
    plt.show()

#------------------------------------------------------------
#        END OF FILE : TEST2.PY
#============================================================
➤※ 线性回归程序
▲ 训练收敛过程
#!/usr/local/bin/python
# -*- coding: gbk -*-
#============================================================
# TEST11.PY                    -- by Dr. ZhuoQing 2020-11-22
#
# Note:
#============================================================

from headm import *
import paddle
import paddle.fluid as fluid
import paddle.fluid.dygraph as dygraph
from paddle.fluid.dygraph import Linear

#------------------------------------------------------------
x_data = linspace(0, 1, 100)
y_data = x_data * 2 + random.rand(len(x_data)) * 0.2
plt.plot(x_data, y_data)
plt.xlabel("x")
plt.ylabel("y")
plt.grid(True)
plt.tight_layout()
#plt.show()

train_data = hstack((x_data.reshape(-1, 1),  y_data.reshape(-1, 1)))

pltgif = PlotGIF()

#------------------------------------------------------------
class Regressor(fluid.dygraph.Layer):
    def __init__(self, name_scope):
        super(Regressor, self).__init__(name_scope)
        self.fc = Linear(input_dim = 1, output_dim = 1, act =None)

    def forward(self, inputs):
        x = self.fc(inputs)
        return x

with fluid.dygraph.guard():
    model = Regressor('Regressor')
    model.train()  #.eval()
    opt = fluid.optimizer.SGD(learning_rate=0.05, parameter_list=model.parameters())

with dygraph.guard(fluid.CPUPlace()):
    EPOCH_NUM = 50
    BATCH_SIZE = 10

    for epoch_id in range(EPOCH_NUM):
        random.shuffle(train_data)

        mini_batches = [train_data[k:k+BATCH_SIZE] for k in range(0, len(train_data), BATCH_SIZE)]

        for iter_id, mini_batch in enumerate(mini_batches):
            x = mini_batch[:, :-1].astype('float32')
            y = mini_batch[:, -1:].astype('float32')

            input_data = dygraph.to_variable(x)
            target_data = dygraph.to_variable(y)
            predicts = model(input_data)
            loss = fluid.layers.square_error_cost(predicts, label=target_data)
            avg_loss = fluid.layers.mean(loss)

            avg_loss.backward()
            opt.minimize(avg_loss)
            model.clear_gradients()

        printf('epcoh:{}, loss is:{}'.format(epoch_id, avg_loss.numpy()))

        predicts = model(dygraph.to_variable(x_data.reshape(-1,1).astype('float32')))
        plt.clf()
        plt.plot(x_data, y_data)
        plt.plot(x_data, predicts.numpy())
        plt.xlabel("x")
        plt.ylabel("y")
        plt.grid(True)
        plt.tight_layout()
        plt.draw()
        plt.pause(.01)
        pltgif.append(plt)

    fluid.save_dygraph(model.state_dict(), 'LR_model')

pltgif.save(r'd:\temp\1.gif')
plt.show()

#------------------------------------------------------------
#        END OF FILE : TEST11.PY
#============================================================
文章来源: zhuoqing.blog.csdn.net,作者:卓晴,版权归原作者所有,如需转载,请联系作者。
原文链接:zhuoqing.blog.csdn.net/article/details/109965670

【版权声明】本文为华为云社区用户转载文章,如果您发现本社区中有涉嫌抄袭的内容,欢迎发送邮件进行举报,并提供相关证据,一经查实,本社区将立刻删除涉嫌侵权内容,举报邮箱:
cloudbbs@huaweicloud.com
- 点赞
- 收藏
- 关注作者
评论(0)