【OpenCV】 ⚠️实战⚠️ 银行卡卡号读取 ☢️建议手收藏☢️

【摘要】
【OpenCV】 ⚠️实战⚠️ 银行卡卡号读取
概述预处理代码模板预处理银行卡预处理
计算轮廓代码模板轮廓银行卡轮廓
其他程序主函数代码数字分割最终结果
概述
今天带大家使用我...
概述
今天带大家使用我们之前学会的知识来实现银行卡卡号读取. 代码分为四个部分: 主函程序, 预处理, 计算轮廓, 其他程序.

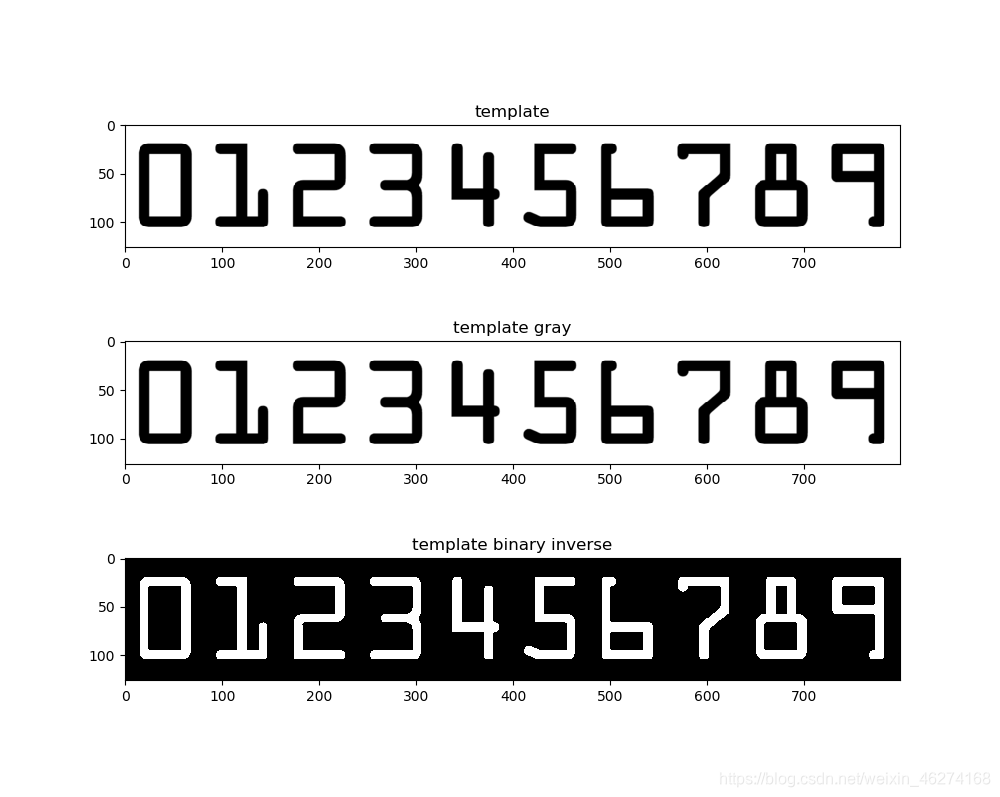
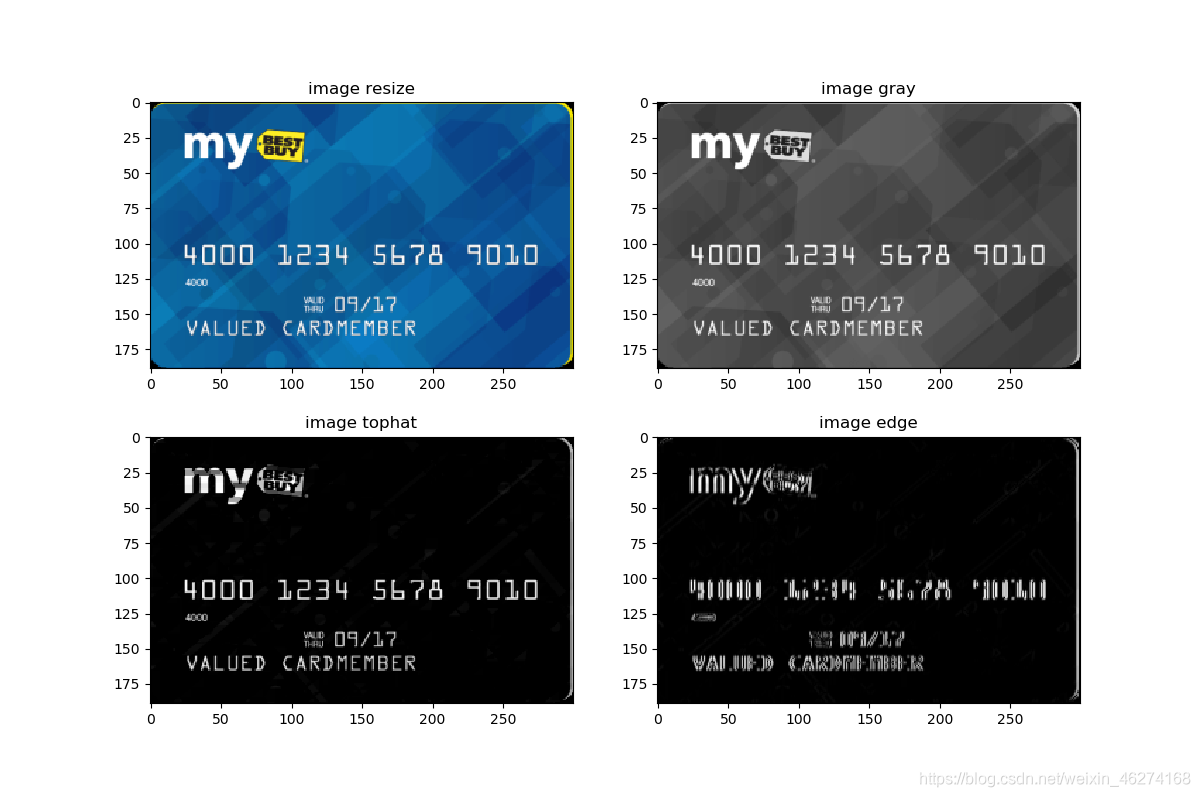
预处理
通过灰度转换, 二值化, 膨胀, 腐蚀, 边缘检测等方法, 去除图片噪声, 突出我们想要得到的结果.

代码
import numpy as np
import cv2
from matplotlib import pyplot as plt
from my_functions import resize
def read_template(image_path, visualize=False):
"""
读取模板
:param image_path: 图片路径
:param visualize: 可视化, 默认为False
:return: 返回模板, 二值化后的模板
"""
# 读取模板
template = cv2.imread(image_path)
# 转换成灰度图
template_gray = cv2.cvtColor(template, cv2.COLOR_BGR2GRAY)
# 二值化
ret, template_thresh = cv2.threshold(template_gray, 10, 255, cv2.THRESH_BINARY_INV)
# 如果展示为真
if visualize:
"""图片展示"""
# 绘制子图
f, ax = plt.subplots(3, 1, figsize=(10, 8))
ax[0].imshow(template)
ax[1].imshow(template_gray, "gray")
ax[2].imshow(template_thresh, "gray")
# 标题
ax[0].set_title("template")
ax[1].set_title("template gray")
ax[2].set_title("template binary inverse")
plt.show()
# 返回
return template, template_thresh
def read_image(image_path, visualize=False):
"""
读取银行卡图片
:param image_path: 图片路径
:param visualize: 可视化, 默认为False
:return: 返回裁剪后的图片, 灰度图, 处理后的图
"""
# 初始化卷积核
rectKernel = cv2.getStructuringElement(cv2.MORPH_RECT, (9, 3))
sqKernel = cv2.getStructuringElement(cv2.MORPH_RECT, (5, 5))
# 读取图片
image = cv2.imread(image_path)
# 更改尺寸
image_resize = resize(image, width=300)
# 转换成灰度图
image_gray = cv2.cvtColor(image_resize, cv2.COLOR_BGR2GRAY)
# 礼帽操作, 突出明亮区域
tophat = cv2.morphologyEx(image_gray, cv2.MORPH_TOPHAT, rectKernel)
# Sobel边缘检测
edge = cv2.Sobel(tophat, ddepth=cv2.CV_32F, dx=1, dy=0, ksize=-1)
edge = np.absolute(edge)
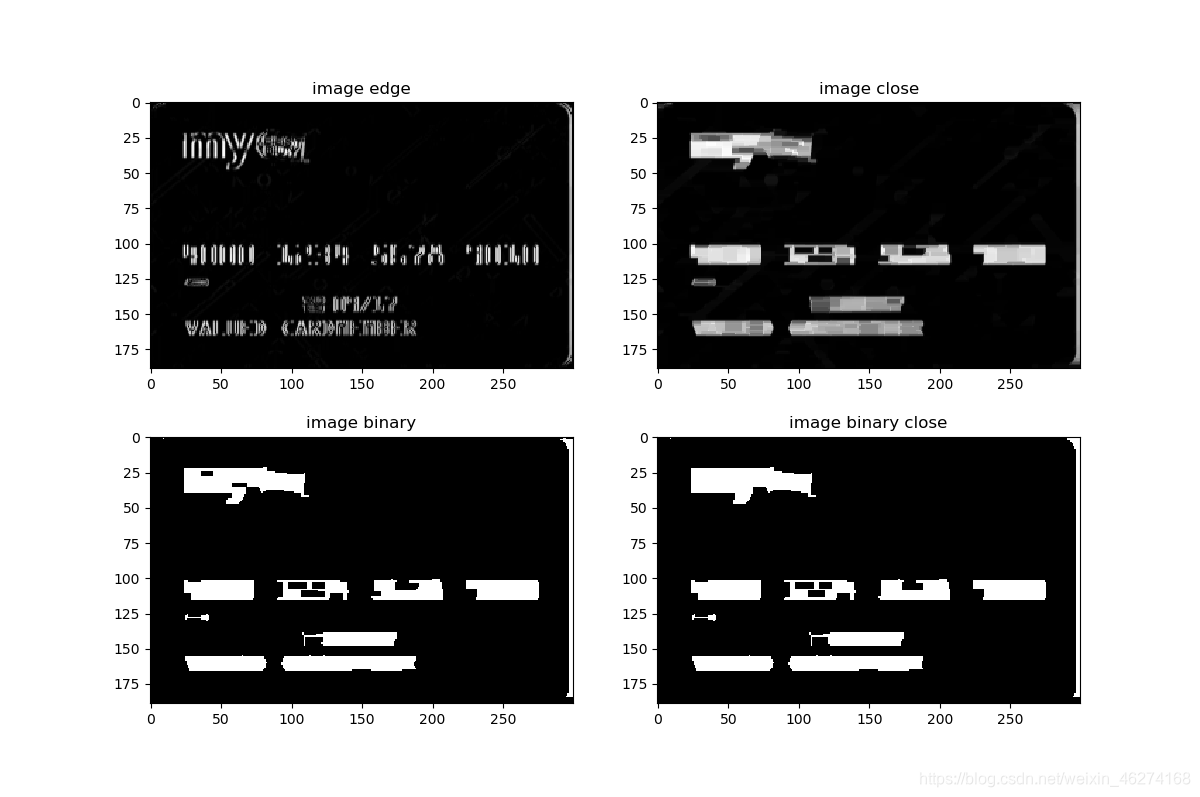
# 标准化
edge = 255 * cv2.normalize(edge, None, norm_type=cv2.NORM_MINMAX, dtype=cv2.CV_32F)
edge = edge.astype("uint8")
# 通过闭操作(先膨胀,再腐蚀)将数字连在一起
edge_close = cv2.morphologyEx(edge, cv2.MORPH_CLOSE, rectKernel)
# THRESH_OTSU会自动寻找合适的阈值,适合双峰,需把阈值参数设置为0
ret, thresh = cv2.threshold(edge_close, 0, 255, cv2.THRESH_BINARY | cv2.THRESH_OTSU)
# 再来一个闭操作
thresh_close = cv2.morphologyEx(thresh, cv2.MORPH_CLOSE, sqKernel) # 再来一个闭操作
# 如果展示为真
if visualize:
"""图片展示"""
# 绘制子图
f, ax = plt.subplots(2, 2, figsize=(12, 8))
ax[0, 0].imshow(cv2.cvtColor(image_resize, cv2.COLOR_BGR2RGB))
ax[0, 1].imshow(image_gray, "gray")
ax[1, 0].imshow(tophat, "gray")
ax[1, 1].imshow(edge, "gray")
# 标题
ax[0, 0].set_title("image resize")
ax[0, 1].set_title("image gray")
ax[1, 0].set_title("image tophat")
ax[1, 1].set_title("image edge")
plt.show()
# 绘制子图
f, ax = plt.subplots(2, 2, figsize=(12, 8))
ax[0, 0].imshow(edge, "gray")
ax[0, 1].imshow(edge_close, "gray")
ax[1, 0].imshow(thresh, "gray")
ax[1, 1].imshow(thresh_close, "gray")
# 标题
ax[0, 0].set_title("image edge")
ax[0, 1].set_title("image close")
ax[1, 0].set_title("image binary")
ax[1, 1].set_title("image binary close")
plt.show()
# 返回
return image_resize, image_gray, thresh
- 1
- 2
- 3
- 4
- 5
- 6
- 7
- 8
- 9
- 10
- 11
- 12
- 13
- 14
- 15
- 16
- 17
- 18
- 19
- 20
- 21
- 22
- 23
- 24
- 25
- 26
- 27
- 28
- 29
- 30
- 31
- 32
- 33
- 34
- 35
- 36
- 37
- 38
- 39
- 40
- 41
- 42
- 43
- 44
- 45
- 46
- 47
- 48
- 49
- 50
- 51
- 52
- 53
- 54
- 55
- 56
- 57
- 58
- 59
- 60
- 61
- 62
- 63
- 64
- 65
- 66
- 67
- 68
- 69
- 70
- 71
- 72
- 73
- 74
- 75
- 76
- 77
- 78
- 79
- 80
- 81
- 82
- 83
- 84
- 85
- 86
- 87
- 88
- 89
- 90
- 91
- 92
- 93
- 94
- 95
- 96
- 97
- 98
- 99
- 100
- 101
- 102
- 103
- 104
- 105
- 106
- 107
- 108
- 109
- 110
- 111
- 112
- 113
- 114
- 115
- 116
- 117
- 118
- 119
- 120
- 121
模板预处理
银行卡预处理
计算轮廓
代码
import cv2
from matplotlib import pyplot as plt, gridspec
from my_functions import sort_contours


def template_calculate_contours(template, template_binary, visualize=False):
    """
    计算模板轮廓
    :param template: 模板
    :param template_binary: 二值化的模板
    :return: 轮廓
    """

    # 获取轮廓
    contours, hierarchy = cv2.findContours(template_binary.copy(), cv2.RETR_EXTERNAL, cv2.CHAIN_APPROX_SIMPLE)

    # 轮廓排序, 从左到右, 从上到下
    contours = sort_contours(contours)

    digits = {}

    # 遍历每一个轮廓
    for (i, c) in enumerate(contours):
        # 计算矩阵
        (x, y, w, h) = cv2.boundingRect(c)

        # 获取roi
        roi = template_binary[y:y + h, x:x + w]
        roi = cv2.resize(roi, (57, 88))

        # 每一个数字对应每一个模板
        digits[i] = roi

    if visualize:
        """图片展示"""

        # 绘制子图
        plt.figure(figsize=(12, 6))
        gs = gridspec.GridSpec(2, 10)

        # 轴1
        plt.subplot(gs[0, :10])
        plt.imshow(template, "gray")
        plt.xticks([])
        plt.yticks([])
        plt.title("original")

        # 轴2
        for (number, image) in digits.items():
            plt.subplot(gs[1, number])
            plt.xticks([])
            plt.yticks([])
            plt.imshow(image, "gray")
            plt.title("number: {}".format(number))

        plt.show()

    print(digits)
    return digits


def image_calculate_contours(image, thresh, visualize=False):
    """
    计算轮廓
    :param image: 图片
    :param thresh: 处理后的图片
    :param visualize: 可视化, 默认为False
    :return: 轮廓
    """

    # 获取轮廓
    contours, hierarchy = cv2.findContours(thresh.copy(), cv2.RETR_EXTERNAL, cv2.CHAIN_APPROX_SIMPLE)

    # 绘制轮廓
    cur_img = image.copy()
    image_with_contour = cv2.drawContours(cur_img, contours, -1, (0, 0, 255), 3)

    # 位置
    locations = []

    # 遍历轮廓
    for (i, c) in enumerate(contours):

        # 计算矩形
        (x, y, w, h) = cv2.boundingRect(c)
        ar = w / float(h)

        # 选择合适的区域,根据实际任务来,这里的基本都是四个数字一组
        if ar > 2.5 and ar < 4.0:

            if (w > 40 and w < 55) and (h > 10 and h < 20):
                # 符合的留下来
                locations.append((x, y, w, h))

    # 将符合的轮廓从左到右排序
    locs = sorted(locations, key=lambda x: x[0])

    if visualize:
        """图片展示"""

        # 绘制子图
        f, ax = plt.subplots(2, 1, figsize=(12, 8))
        ax[0].imshow(cv2.cvtColor(image_with_contour, cv2.COLOR_BGR2RGB))
        for r in locs:
            (x, y, w, h) = r
            rectangle = cv2.rectangle(image, (x, y), (x + w, y + h), (0, 255, 0), 2)
            ax[1].imshow(cv2.cvtColor(rectangle, cv2.COLOR_BGR2RGB))

        # 标题
        ax[0].set_title("original")
        ax[1].set_title("detect")

        plt.show()

    return locs
- 1
- 2
- 3
- 4
- 5
- 6
- 7
- 8
- 9
- 10
- 11
- 12
- 13
- 14
- 15
- 16
- 17
- 18
- 19
- 20
- 21
- 22
- 23
- 24
- 25
- 26
- 27
- 28
- 29
- 30
- 31
- 32
- 33
- 34
- 35
- 36
- 37
- 38
- 39
- 40
- 41
- 42
- 43
- 44
- 45
- 46
- 47
- 48
- 49
- 50
- 51
- 52
- 53
- 54
- 55
- 56
- 57
- 58
- 59
- 60
- 61
- 62
- 63
- 64
- 65
- 66
- 67
- 68
- 69
- 70
- 71
- 72
- 73
- 74
- 75
- 76
- 77
- 78
- 79
- 80
- 81
- 82
- 83
- 84
- 85
- 86
- 87
- 88
- 89
- 90
- 91
- 92
- 93
- 94
- 95
- 96
- 97
- 98
- 99
- 100
- 101
- 102
- 103
- 104
- 105
- 106
- 107
- 108
- 109
- 110
- 111
- 112
- 113
- 114
- 115
模板轮廓

银行卡轮廓

其他程序
import cv2


def img_show(name, img):
    """图片展示"""

    cv2.imshow(name, img)
    cv2.waitKey(0)
    cv2.destroyAllWindows()


def sort_contours(contours):
    """
    轮廓排序 (从左到右)
    :param contours: 轮廓
    :return: 返回排序好的轮廓
    """

    boundingBoxes = [cv2.boundingRect(c) for c in contours]  # 用一个最小的矩形,把找到的形状包起来x,y,h,w
    (contours, boundingBoxes) = zip(*sorted(zip(contours, boundingBoxes), key=lambda b: b[1][0]))
    return contours


def resize(image, width=None, height=None, inter=cv2.INTER_AREA):
    """
    修改图片大小
    :param image: 原图
    :param width: 宽
    :param height: 高
    :param inter: 模式
    :return: 修改好的图片
    """

    dim = None
    (h, w) = image.shape[:2]
    if width is None and height is None:
        return image
    if width is None:
        r = height / float(h)
        dim = (int(w * r), height)
    else:
        r = width / float(w)
        dim = (width, int(h * r))
    resized = cv2.resize(image, dim, interpolation=inter)
    return resized
- 1
- 2
- 3
- 4
- 5
- 6
- 7
- 8
- 9
- 10
- 11
- 12
- 13
- 14
- 15
- 16
- 17
- 18
- 19
- 20
- 21
- 22
- 23
- 24
- 25
- 26
- 27
- 28
- 29
- 30
- 31
- 32
- 33
- 34
- 35
- 36
- 37
- 38
- 39
- 40
- 41
- 42
- 43
- 44
- 45
主函数
代码
import numpy as np
import argparse
import cv2
from matplotlib import pyplot as plt
from my_functions import sort_contours
from pre_process import read_template
from pre_process import read_image
from calculate_contours import template_calculate_contours
from calculate_contours import image_calculate_contours
def extract_number(image_gray, locations, digits, visualize=False):
"""
提取数字
:param image_gray: 灰度图
:param locations: 图片轮廓
:param digits: 模板轮廓
:param visualize: 可视化, 默认为False
:return: 读取完数字的图片
"""
# 输出
output = []
# 图片
total_img = []
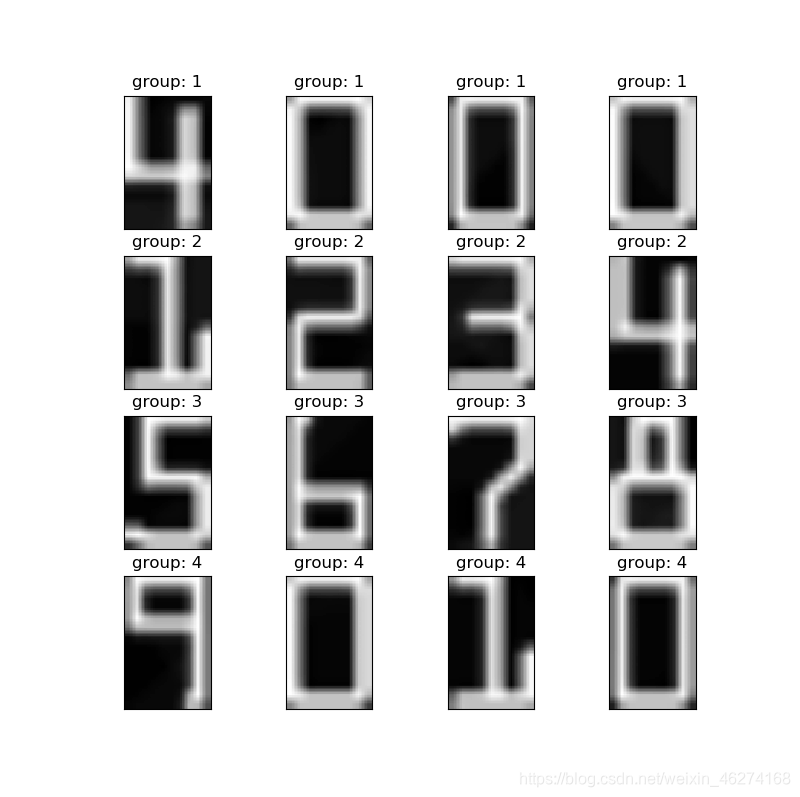
# 遍历每一个轮廓中的数字
for (i, (gX, gY, gW, gH)) in enumerate(locations):
# 组输出
groupOutput = []
group_img = []
# 根据坐标提取每一个组
group = image_gray[gY - 5:gY + gH + 5, gX - 5:gX + gW + 5]
# 预处理
group_binary = cv2.threshold(group, 0, 255, cv2.THRESH_BINARY | cv2.THRESH_OTSU)[1]
# 计算每一组的轮廓
digitCnts, hierarchy = cv2.findContours(group_binary.copy(), cv2.RETR_EXTERNAL, cv2.CHAIN_APPROX_SIMPLE)
digitCnts = sort_contours(digitCnts)
# 计算每一组中的每一个数值
for c in digitCnts:
# 找到当前数值的轮廓,resize成合适的的大小
(x, y, w, h) = cv2.boundingRect(c)
roi = group[y:y + h, x:x + w]
roi = cv2.resize(roi, (57, 88))
group_img.append(roi)
# 计算匹配得分
scores = []
# 在模板中计算每一个得分
for (digit, digitROI) in digits.items():
# 模板匹配
result = cv2.matchTemplate(roi, digitROI, cv2.TM_CCOEFF)
(_, score, _, _) = cv2.minMaxLoc(result)
scores.append(score)
# 得到最合适的数字
groupOutput.append(str(np.argmax(scores)))
# 画出来
cv2.rectangle(image, (gX - 5, gY - 5), (gX + gW + 5, gY + gH + 5), (0, 0, 255), 1)
cv2.putText(image, "".join(groupOutput), (gX, gY - 15), cv2.FONT_HERSHEY_SIMPLEX, 0.65, (0, 0, 255), 2)
# 得到结果
output.extend(groupOutput)
# 添加图片
total_img.append(group_img)
if visualize:
"""图片展示"""
# 绘制子图
f, ax = plt.subplots(4, 4, figsize=(8, 8))
for i, group_im in enumerate(total_img):
for j, im in enumerate(group_im):
ax[i, j].imshow(im, "gray")
ax[i, j].set_xticks([])
ax[i, j].set_yticks([])
ax[i, j].set_title("group: {}".format(i + 1))
plt.show()
# 展示最终图片
plt.figure(figsize=(10, 8))
plt.imshow(cv2.cvtColor(image, cv2.COLOR_BGR2RGB))
plt.title("Final Result")
plt.show()
return image
def parse_opt():
"""设置参数"""
parser = argparse.ArgumentParser()
parser.add_argument("--image_path", type=str, default="images/credit_card_01.png", help="输入图片路径")
parser.add_argument("--template_path", type=str, default="template/template.png", help="模板图片路径")
args = parser.parse_args()
return args
if __name__ == "__main__":
args = parse_opt()
# 读取模板
template, template_binary = read_template(args.template_path, True)
# 计算模板轮廓
digits = template_calculate_contours(template=template, template_binary=template_binary, visualize=True)
# 读取图片
image, image_gray, thresh = read_image(args.image_path, visualize=True)
# 计算图片轮廓
locations = image_calculate_contours(image, thresh, visualize=True)
# 提取数字
result = extract_number(image_gray=image_gray, locations=locations, digits=digits, visualize=True)
# 保存最终结果
cv2.imwrite("Final_result.png", result)
- 1
- 2
- 3
- 4
- 5
- 6
- 7
- 8
- 9
- 10
- 11
- 12
- 13
- 14
- 15
- 16
- 17
- 18
- 19
- 20
- 21
- 22
- 23
- 24
- 25
- 26
- 27
- 28
- 29
- 30
- 31
- 32
- 33
- 34
- 35
- 36
- 37
- 38
- 39
- 40
- 41
- 42
- 43
- 44
- 45
- 46
- 47
- 48
- 49
- 50
- 51
- 52
- 53
- 54
- 55
- 56
- 57
- 58
- 59
- 60
- 61
- 62
- 63
- 64
- 65
- 66
- 67
- 68
- 69
- 70
- 71
- 72
- 73
- 74
- 75
- 76
- 77
- 78
- 79
- 80
- 81
- 82
- 83
- 84
- 85
- 86
- 87
- 88
- 89
- 90
- 91
- 92
- 93
- 94
- 95
- 96
- 97
- 98
- 99
- 100
- 101
- 102
- 103
- 104
- 105
- 106
- 107
- 108
- 109
- 110
- 111
- 112
- 113
- 114
- 115
- 116
- 117
- 118
- 119
- 120
- 121
- 122
- 123
- 124
- 125
- 126
- 127
- 128
- 129
- 130
- 131
数字分割
最终结果


文章来源: iamarookie.blog.csdn.net,作者:我是小白呀,版权归原作者所有,如需转载,请联系作者。
原文链接:iamarookie.blog.csdn.net/article/details/119162595

【版权声明】本文为华为云社区用户转载文章,如果您发现本社区中有涉嫌抄袭的内容,欢迎发送邮件进行举报,并提供相关证据,一经查实,本社区将立刻删除涉嫌侵权内容,举报邮箱:
cloudbbs@huaweicloud.com
- 点赞
- 收藏
- 关注作者
评论(0)