Python Matplotlib绘图笔记【草稿 未完成】

1 pyplot.figure( )
语法
figure(num=None, figsize=None, dpi=None, facecolor=None, edgecolor=None, frameon=True)
参数
- num:图像编号或名称,数字为编号 ,字符串为名称
- figsize:指定figure的宽和高,单位为英寸;
- dpi参数指定绘图对象的分辨率,即每英寸多少个像素,默认值为80 (1英寸等于2.5cm,A4纸是 21*30cm的纸张 )
- facecolor:背景颜色
- edgecolor:边框颜色
- frameon:是否显示边框/表示是否绘制窗口的图框
测试
figsize
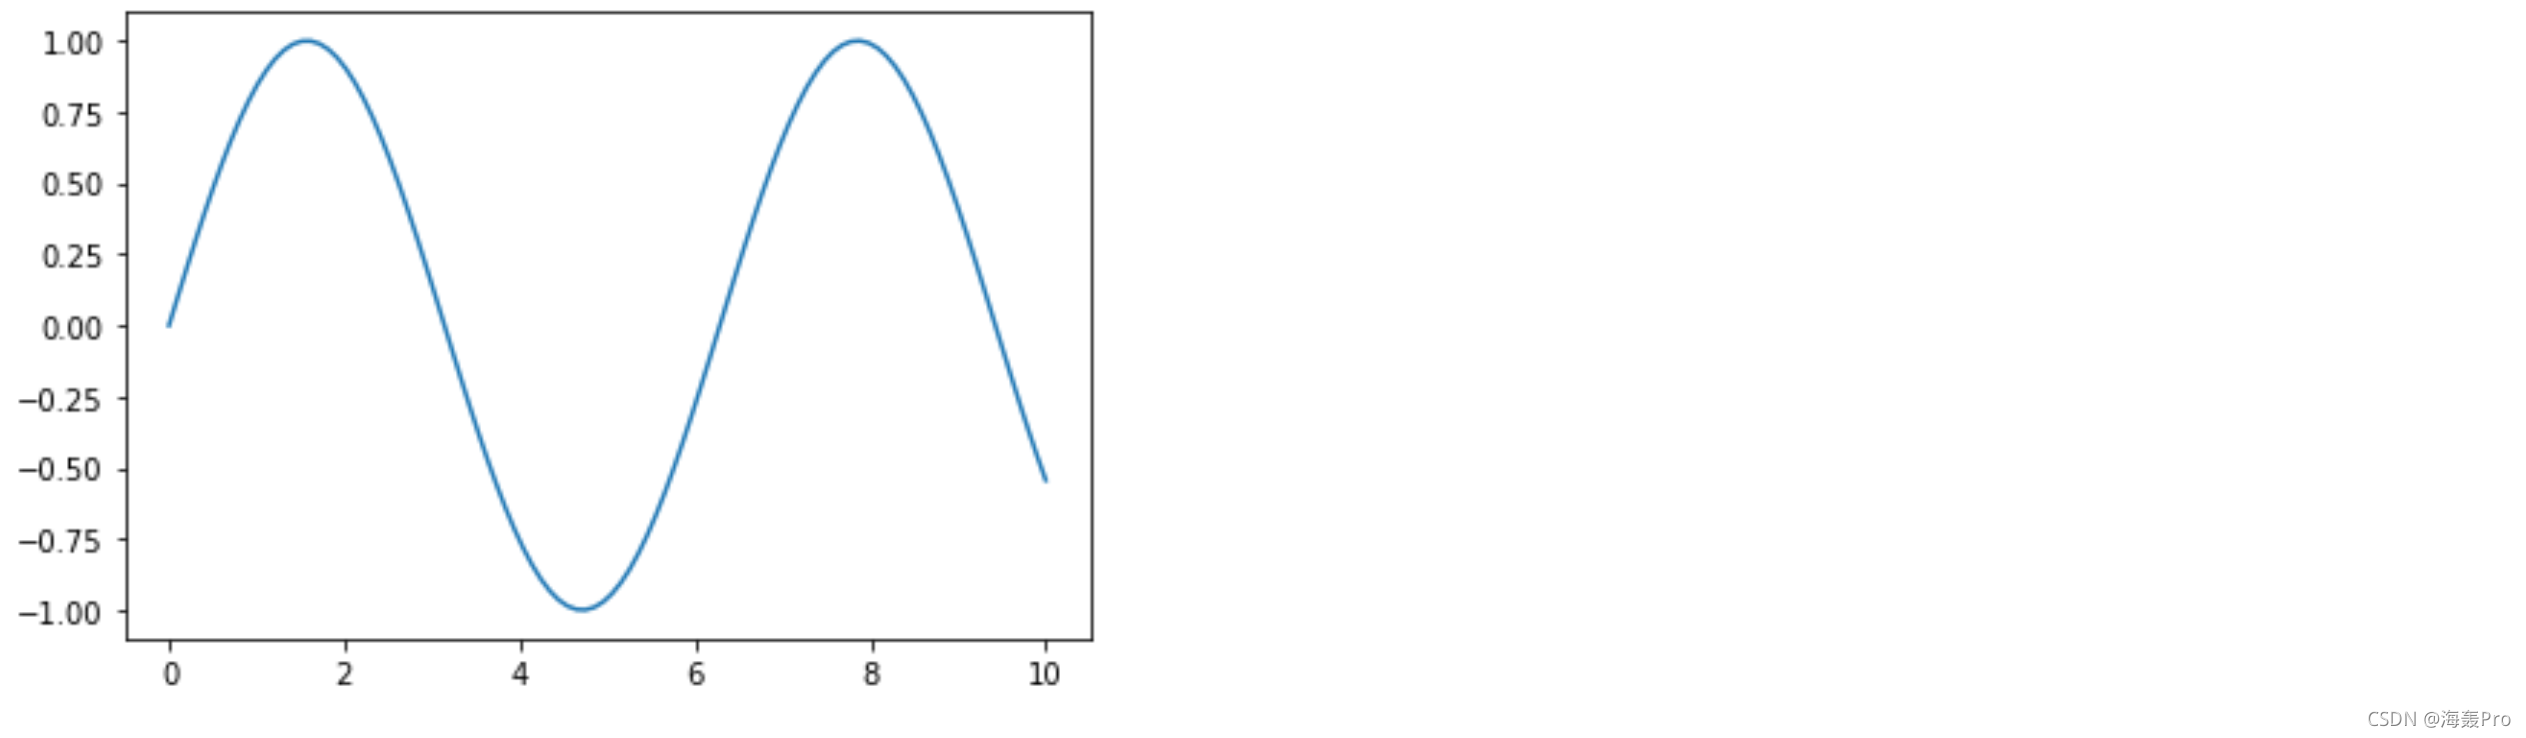
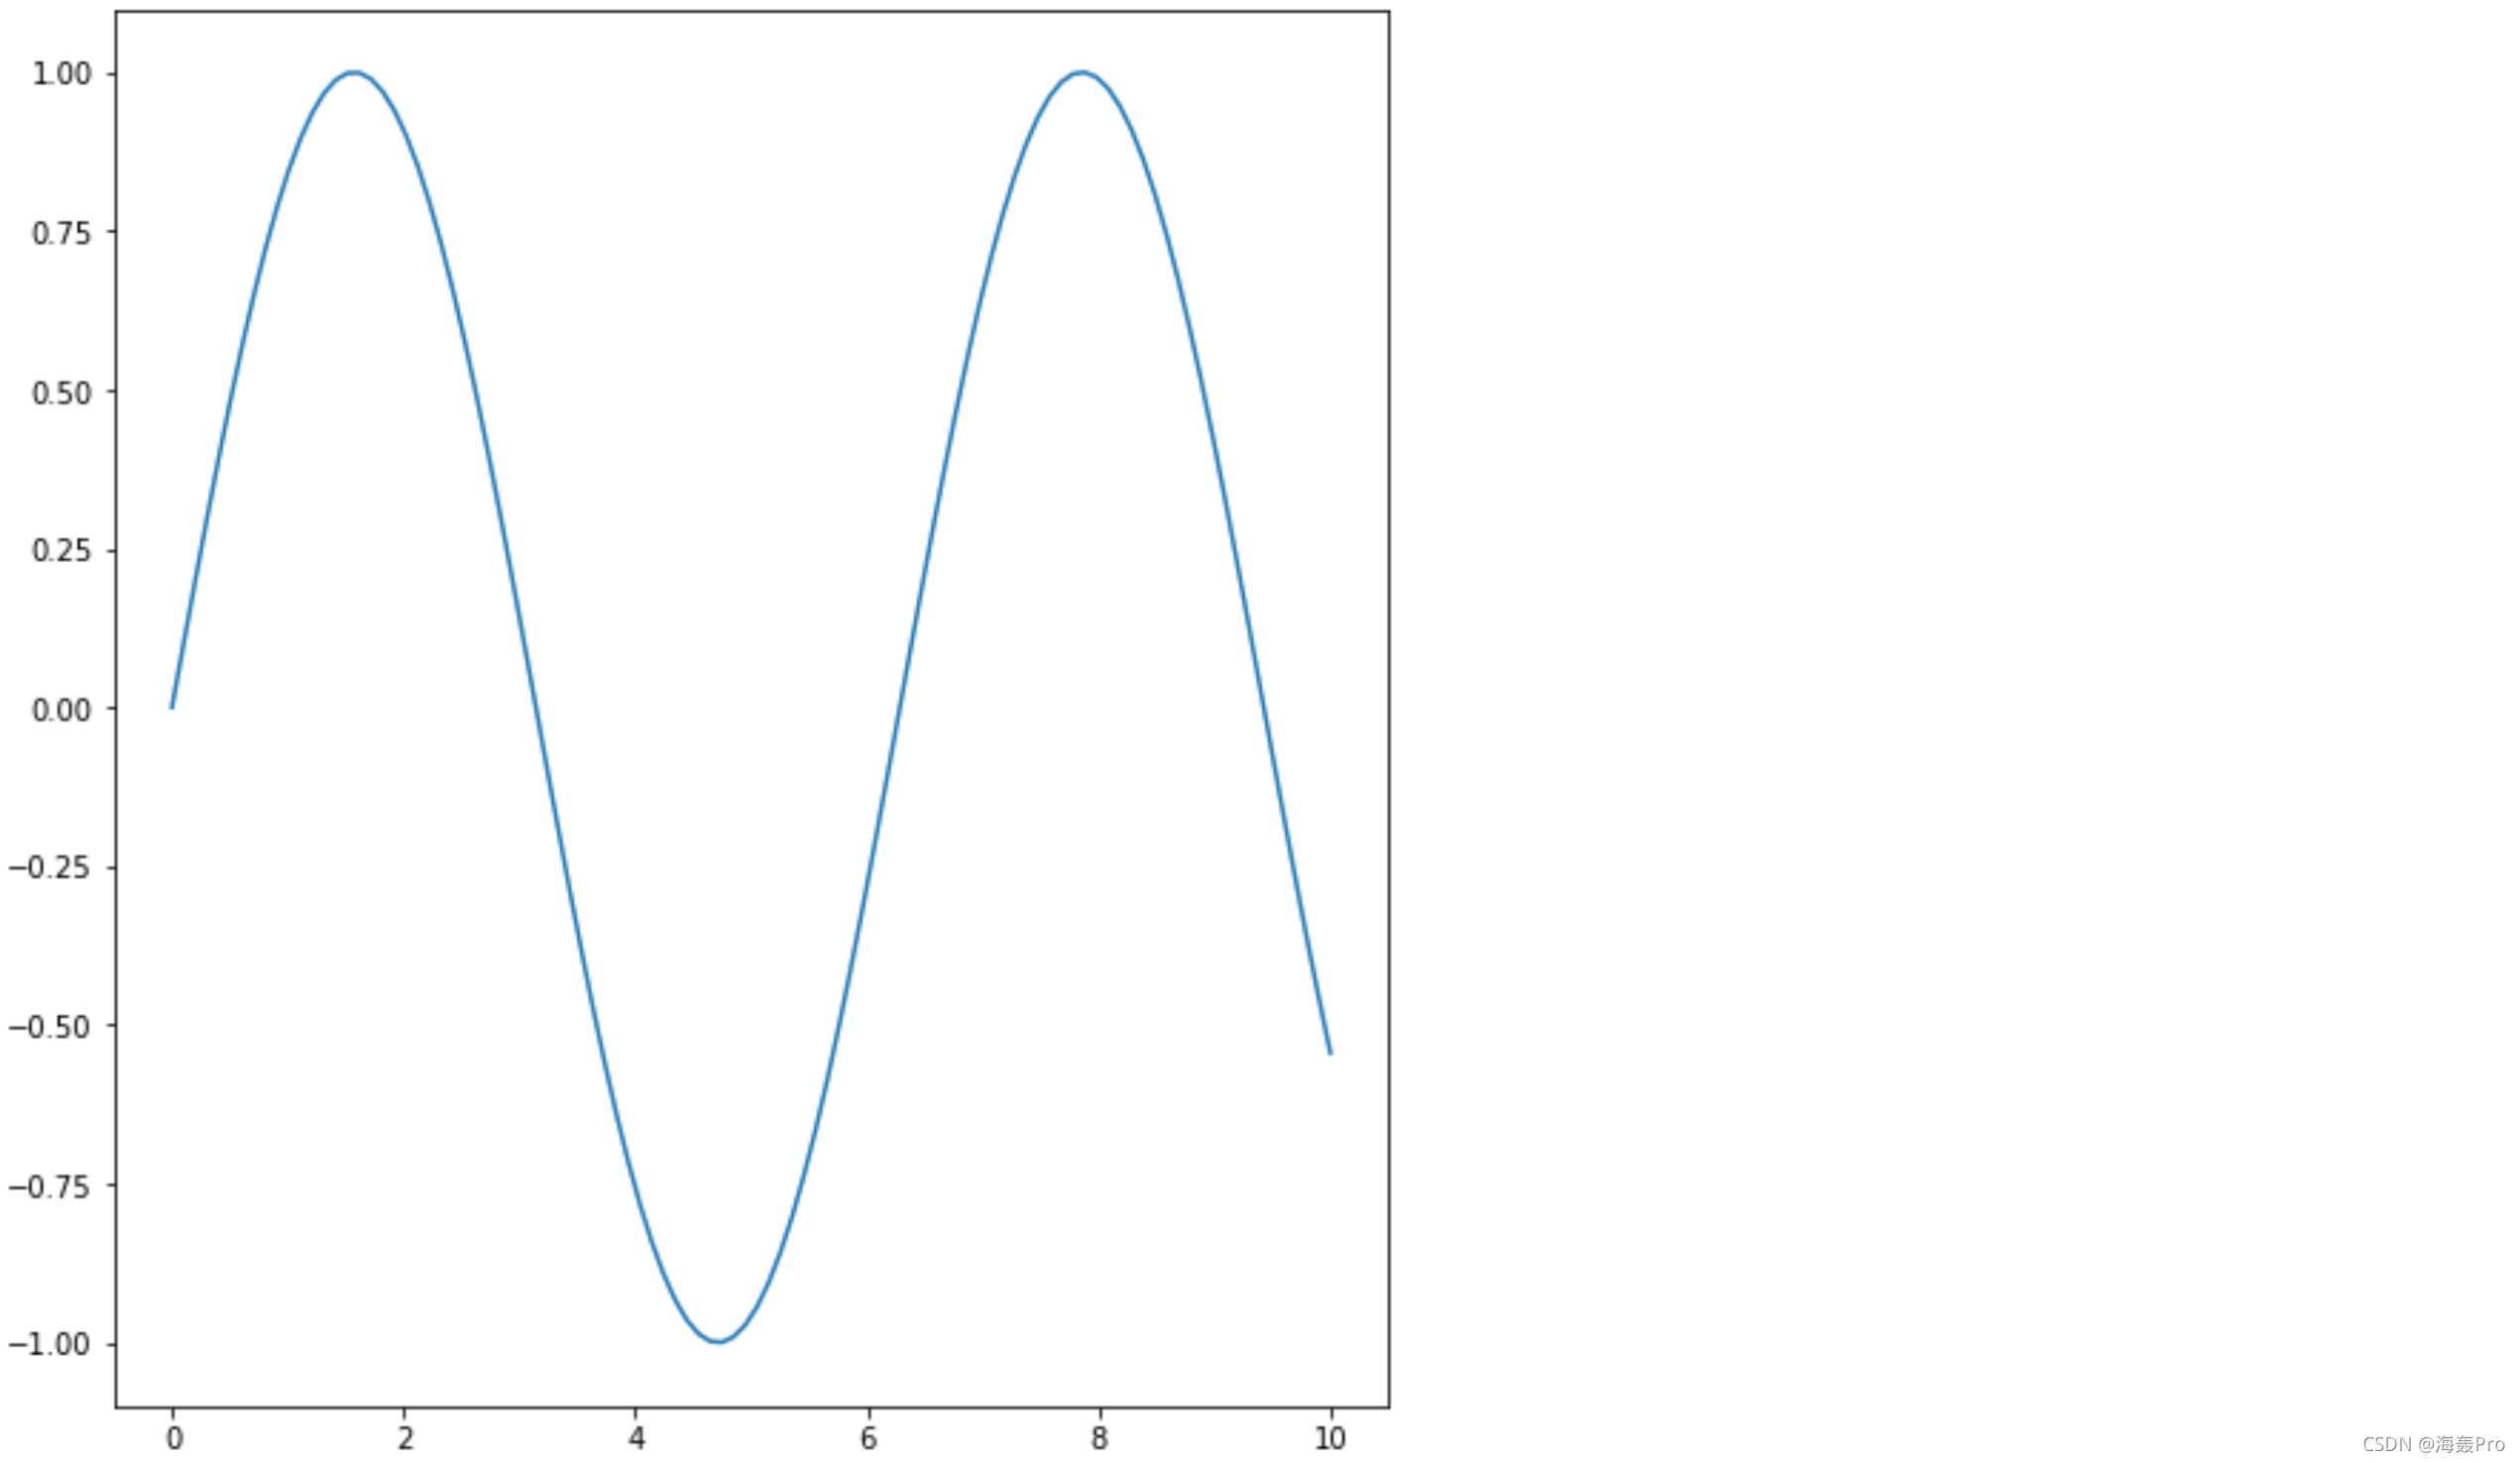
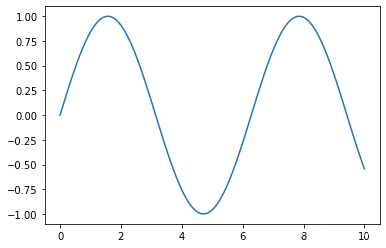
默认时
import numpy as np
import matplotlib.pyplot as plt

x = np.linspace(0,10,100)
y = np.sin(x)

plt.plot(x,y)
plt.show()
- 1
- 2
- 3
- 4
- 5
- 6
- 7
- 8
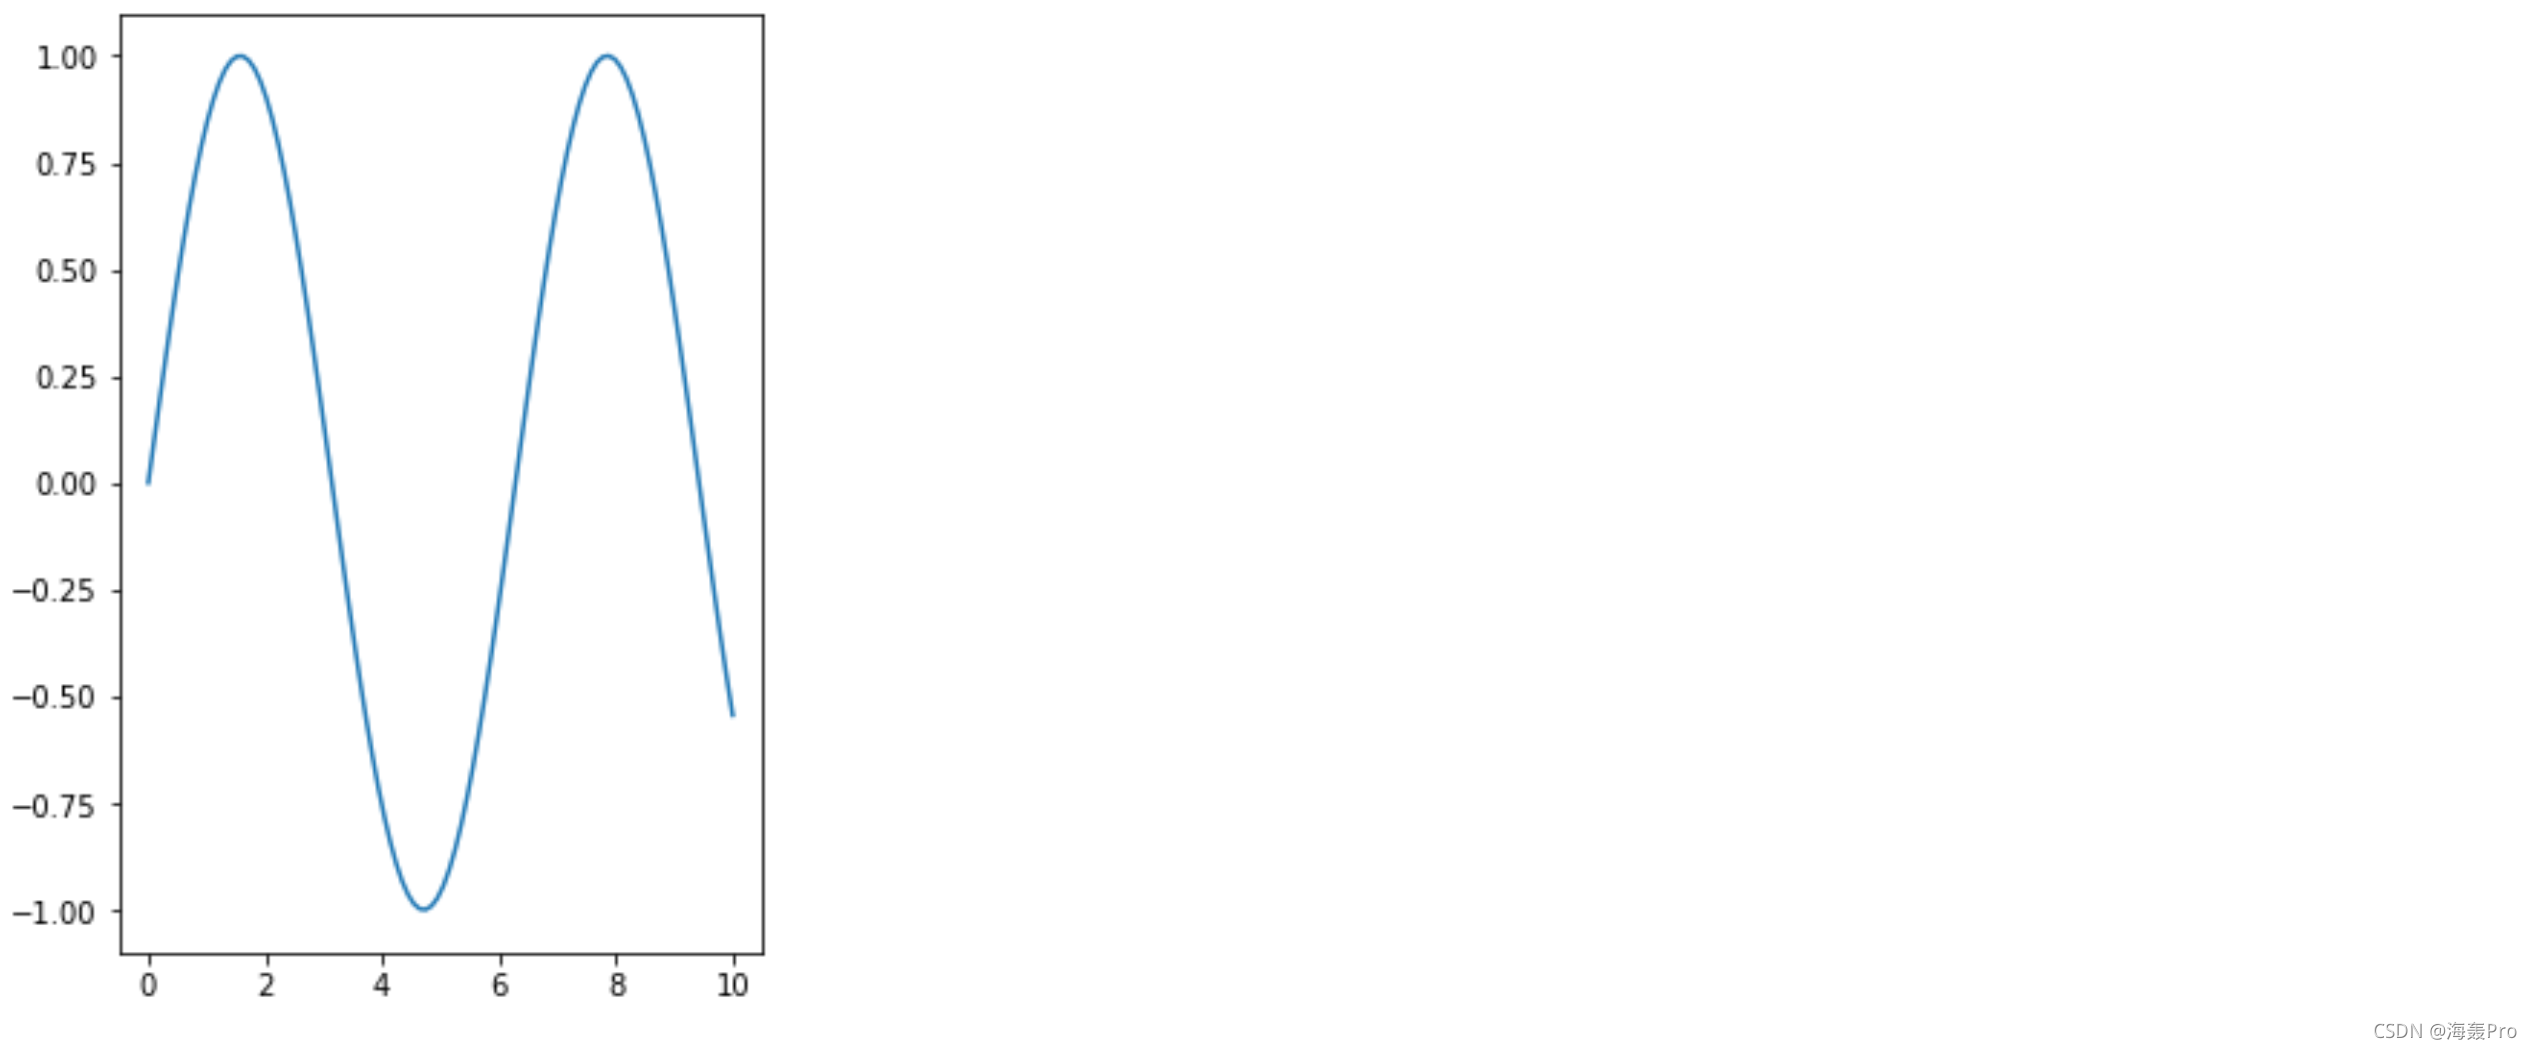
设置为figsize=(4,6)
import numpy as np
import matplotlib.pyplot as plt

x = np.linspace(0,10,100)
y = np.sin(x)

plt.figure(figsize=(4,6))
plt.plot(x,y)
plt.show()
- 1
- 2
- 3
- 4
- 5
- 6
- 7
- 8
- 9
设置为figsize=(8,6)
import numpy as np
import matplotlib.pyplot as plt

x = np.linspace(0,10,100)
y = np.sin(x)

plt.figure(figsize=(8,6))
plt.plot(x,y)
plt.show()
- 1
- 2
- 3
- 4
- 5
- 6
- 7
- 8
- 9
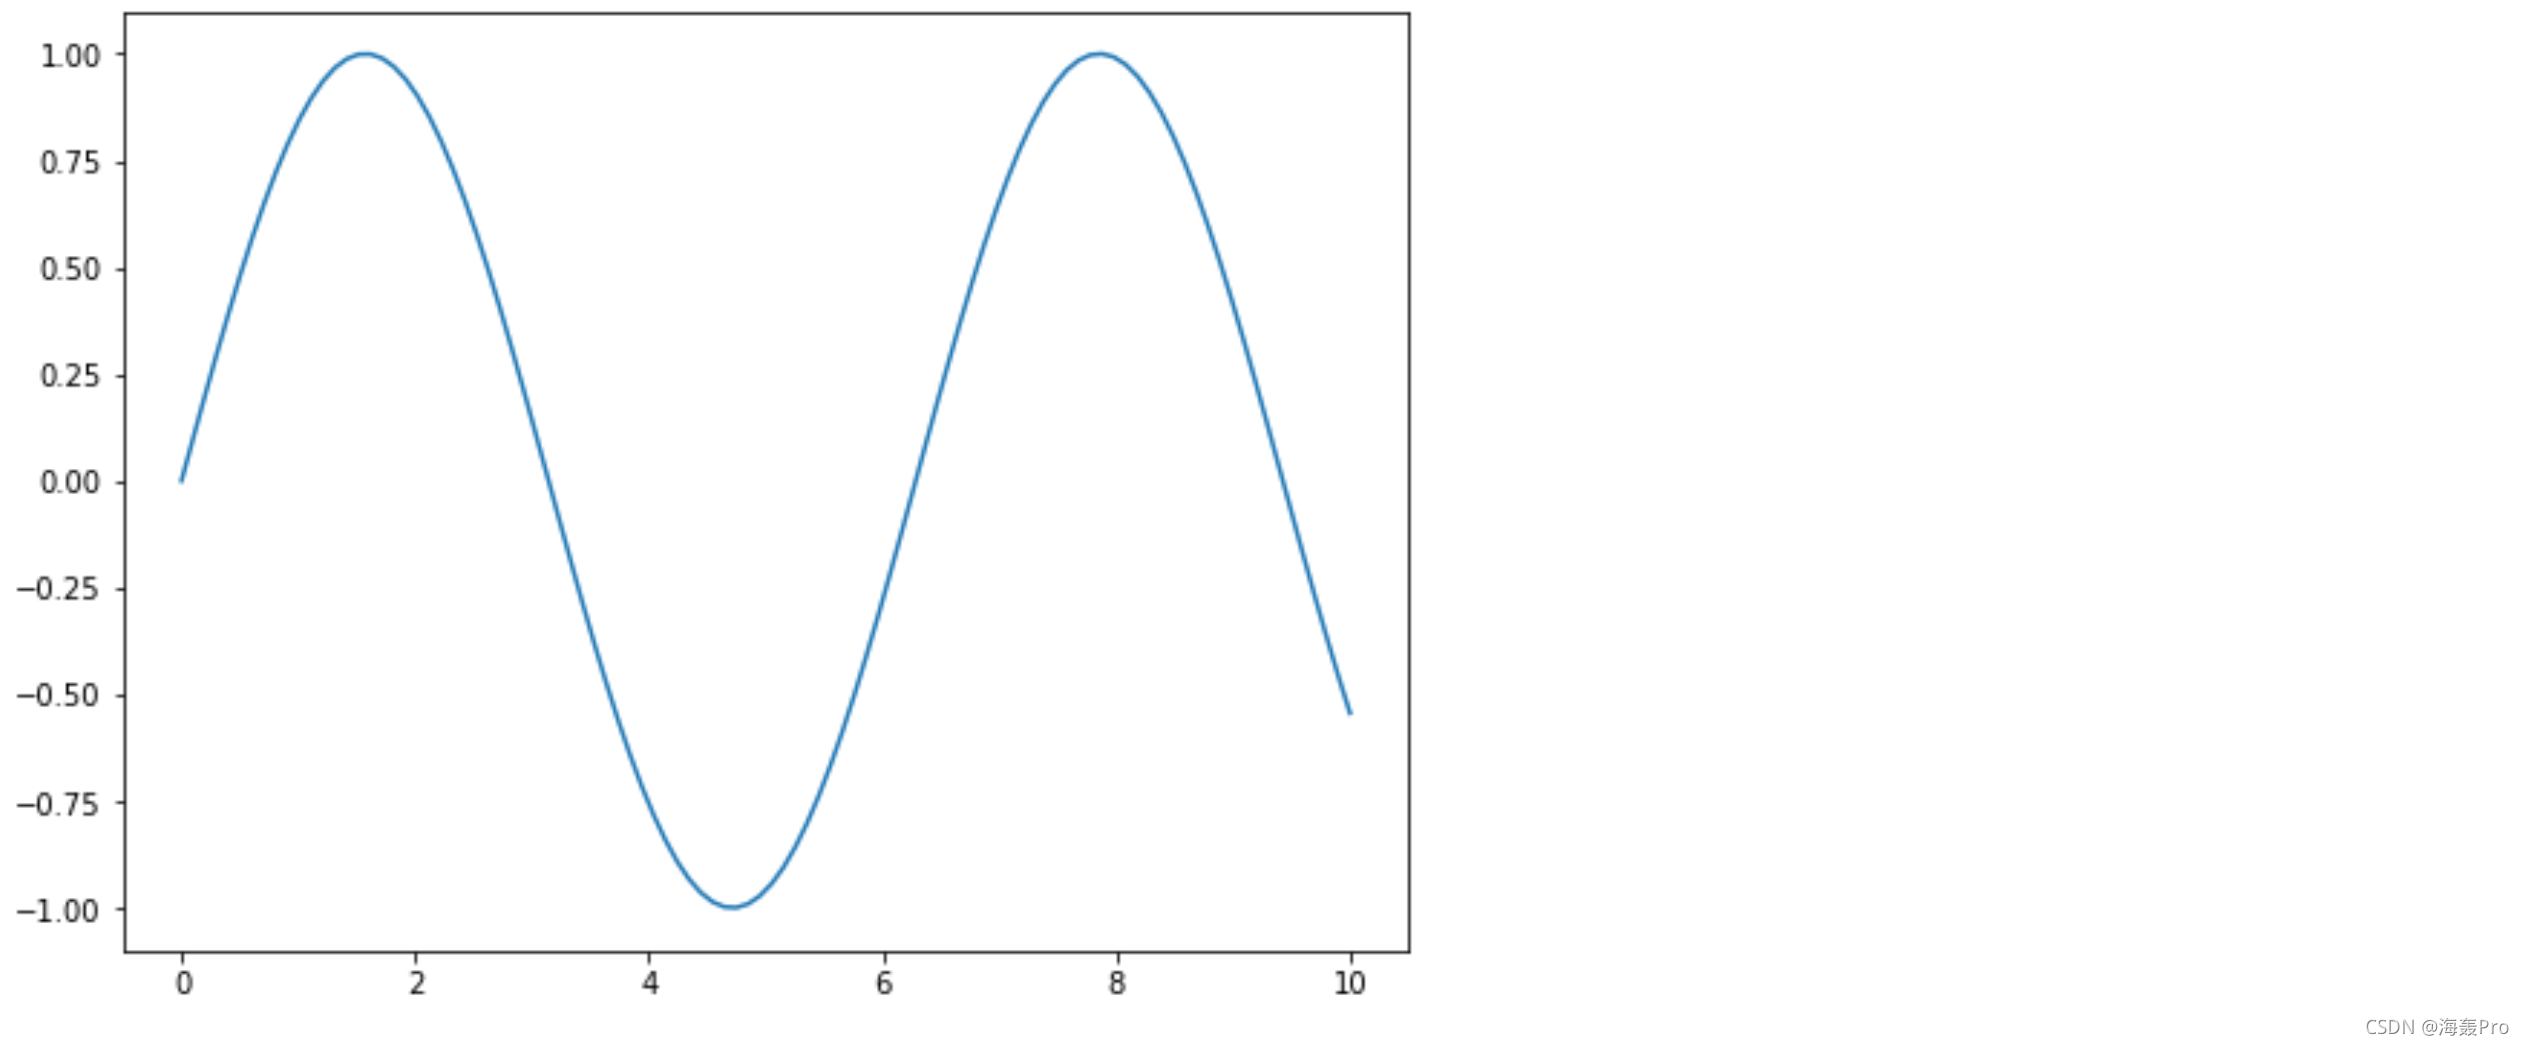
设置为figsize=(12,6)
import numpy as np
import matplotlib.pyplot as plt

x = np.linspace(0,10,100)
y = np.sin(x)

plt.figure(figsize=(12,6))
plt.plot(x,y)
plt.show()
- 1
- 2
- 3
- 4
- 5
- 6
- 7
- 8
- 9

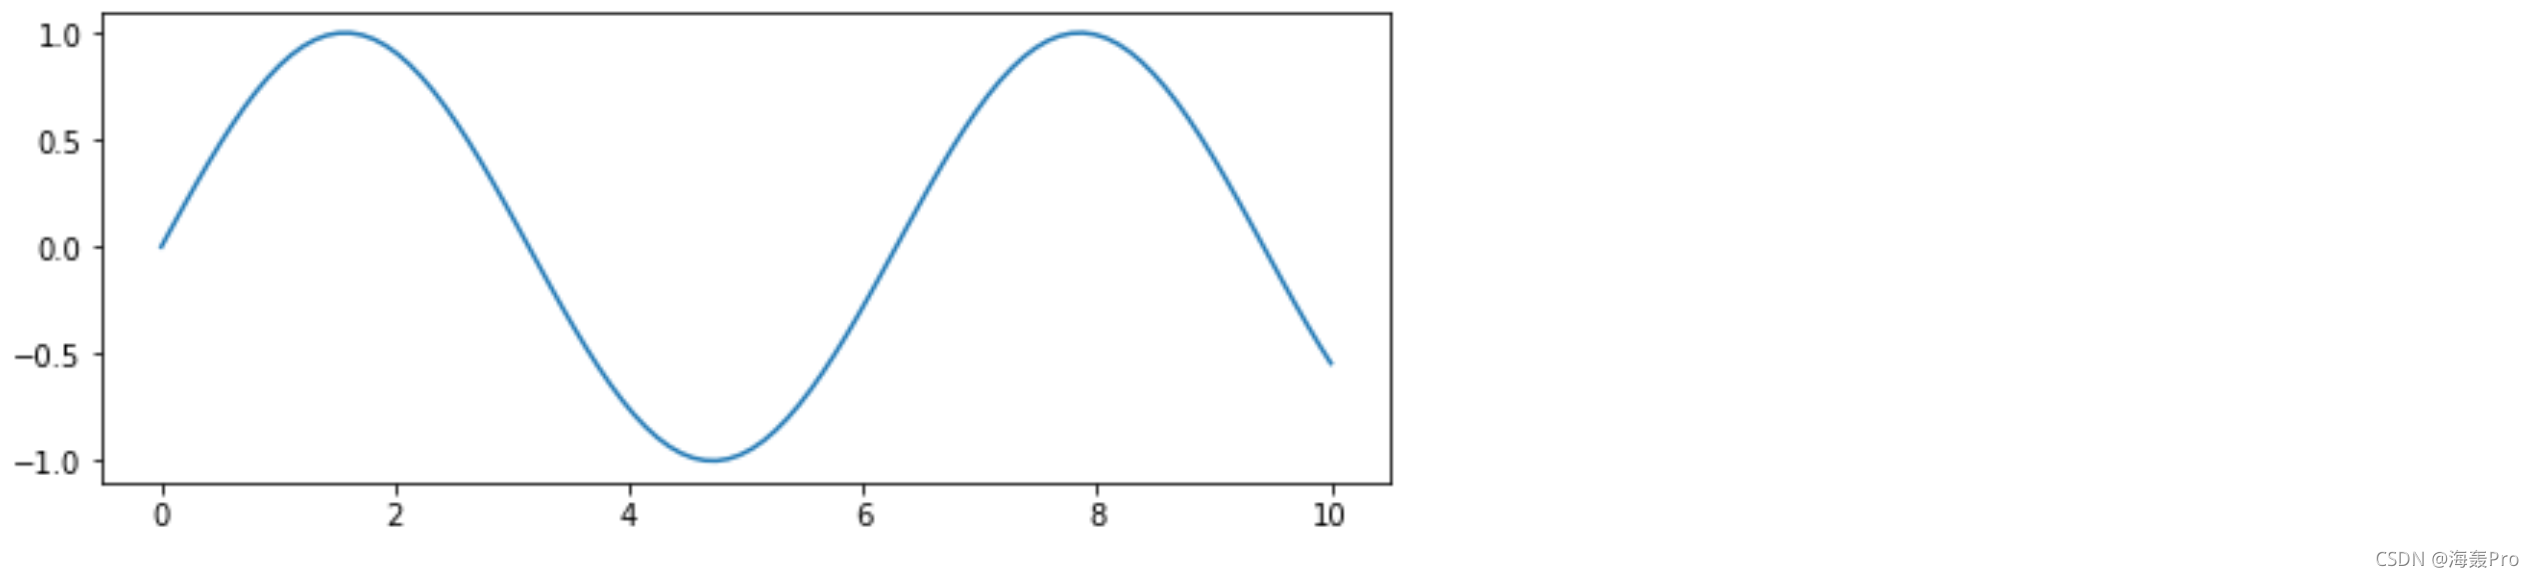
设置为figsize=(8,3)
import numpy as np
import matplotlib.pyplot as plt

x = np.linspace(0,10,100)
y = np.sin(x)

plt.figure(figsize=(8,3))
plt.plot(x,y)
plt.show()
- 1
- 2
- 3
- 4
- 5
- 6
- 7
- 8
- 9
设置为figsize=(8,9)
import numpy as np
import matplotlib.pyplot as plt

x = np.linspace(0,10,100)
y = np.sin(x)

plt.figure(figsize=(8,9))
plt.plot(x,y)
plt.show()
- 1
- 2
- 3
- 4
- 5
- 6
- 7
- 8
- 9
facecolor
默认状态:

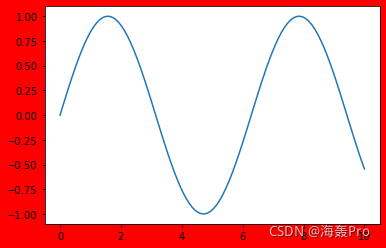
将背景色设置为红色
import numpy as np
import matplotlib.pyplot as plt

x = np.linspace(0,10,100)
y = np.sin(x)

plt.figure(facecolor="red")
plt.plot(x,y)
plt.show()
- 1
- 2
- 3
- 4
- 5
- 6
- 7
- 8
- 9
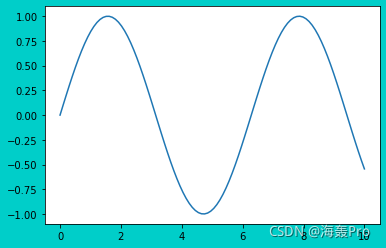
将背景色设置为#00cec9
import numpy as np
import matplotlib.pyplot as plt

x = np.linspace(0,10,100)
y = np.sin(x)

plt.figure(facecolor="#00cec9")
plt.plot(x,y)
plt.show()
- 1
- 2
- 3
- 4
- 5
- 6
- 7
- 8
- 9
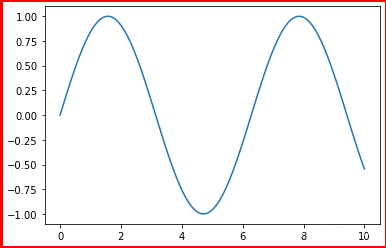
edgecolor
如果只是单纯的设置edgecolor 会发现并没有起作用
这是因为默认状态下linewidth=0
所以只需要设置一下linewidth,使其不为0 ,就可以使edgecolor生效
import numpy as np
import matplotlib.pyplot as plt

x = np.linspace(0,10,100)
y = np.sin(x)

plt.figure(linewidth=5.0,edgecolor="red")
plt.plot(x,y)
plt.show()
- 1
- 2
- 3
- 4
- 5
- 6
- 7
- 8
- 9
frameon
这里需要先设置linewidth=5.0,edgecolor="red" 便于观察
不然默认情况下,边框不好观察出来
frameon默认为True
import numpy as np
import matplotlib.pyplot as plt

x = np.linspace(0,10,100)
y = np.sin(x)

plt.figure(linewidth=5.0,edgecolor="red",frameon=True)
plt.plot(x,y)
plt.show()
- 1
- 2
- 3
- 4
- 5
- 6
- 7
- 8
- 9
设置为False时,边框不显示
import numpy as np
import matplotlib.pyplot as plt

x = np.linspace(0,10,100)
y = np.sin(x)

plt.figure(linewidth=5.0,edgecolor="red",frameon=False)
plt.plot(x,y)
plt.show()
- 1
- 2
- 3
- 4
- 5
- 6
- 7
- 8
- 9
2 pyplot.subplot( )
说明
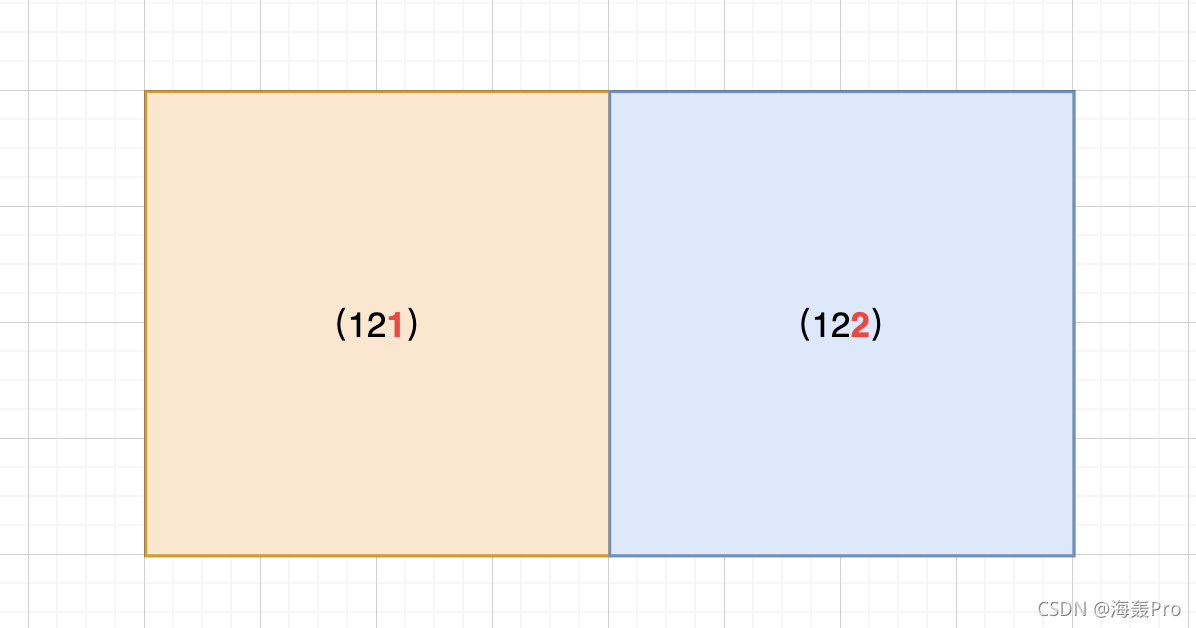
subplot(121) 表示整个区域分为一行,两列,一共可以容纳2张子图,此子图位于第一个位置
前面两个数字表示分为几行几列,后一个数字表示第几个位置。
排列顺序:从左到右,从上到下
subplot(122) 表示此子图位于第二个位置
举例:subplot(122) 位于下图中蓝色位置
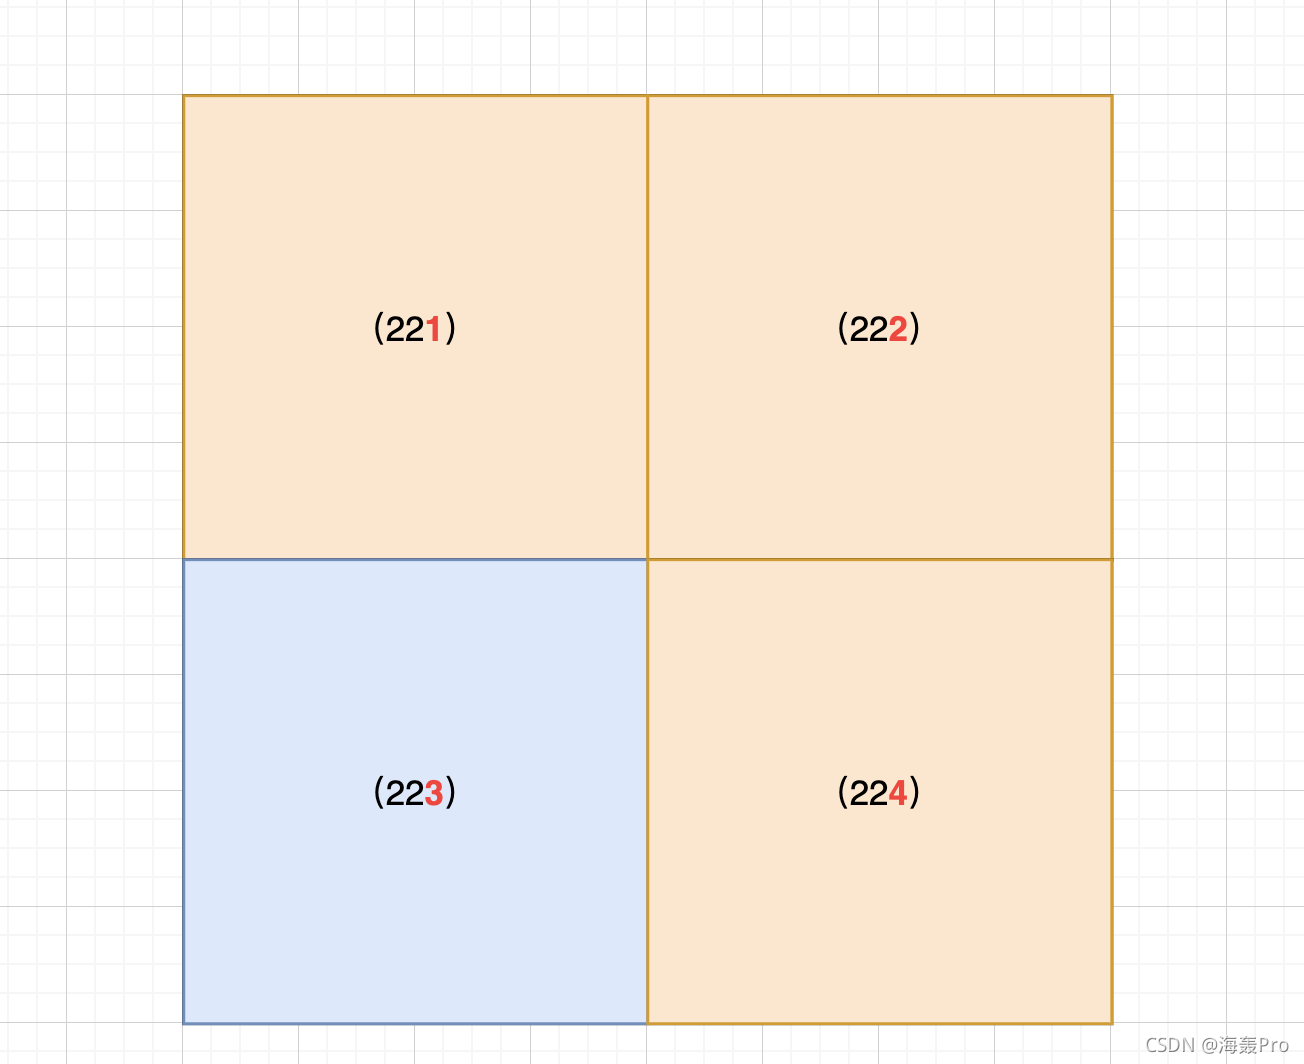
subplot(223) 位于下图中蓝色位置
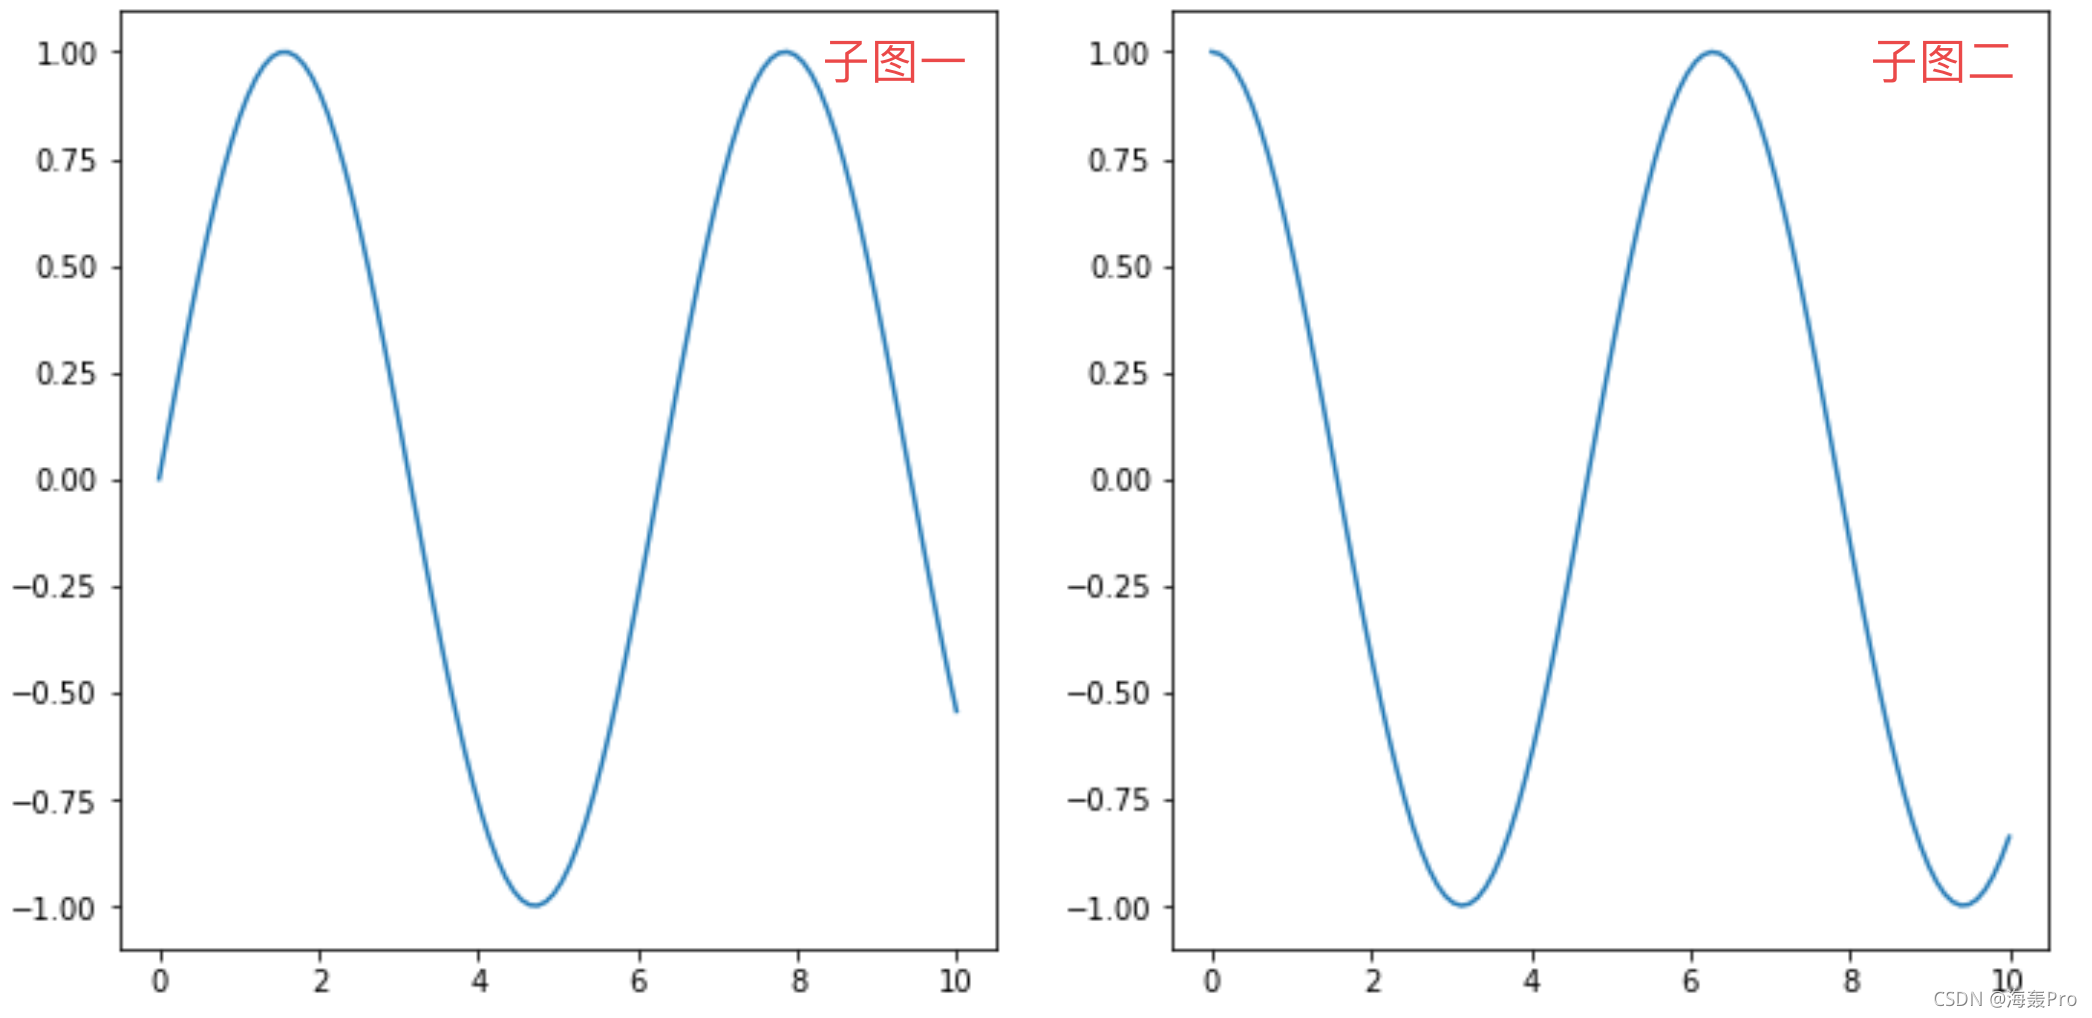
Demo代码
import numpy as np
import matplotlib.pyplot as plt

x = np.linspace(0,10,100)
y = np.sin(x)
z = np.cos(x)

plt.figure(figsize=(12,6))

# 子图1
plt.subplot(1,2,1)
plt.plot(x,y)

# 子图2
plt.subplot(1,2,2)
plt.plot(x,z)

plt.show()
- 1
- 2
- 3
- 4
- 5
- 6
- 7
- 8
- 9
- 10
- 11
- 12
- 13
- 14
- 15
- 16
- 17
- 18
设置所有子图的大标题
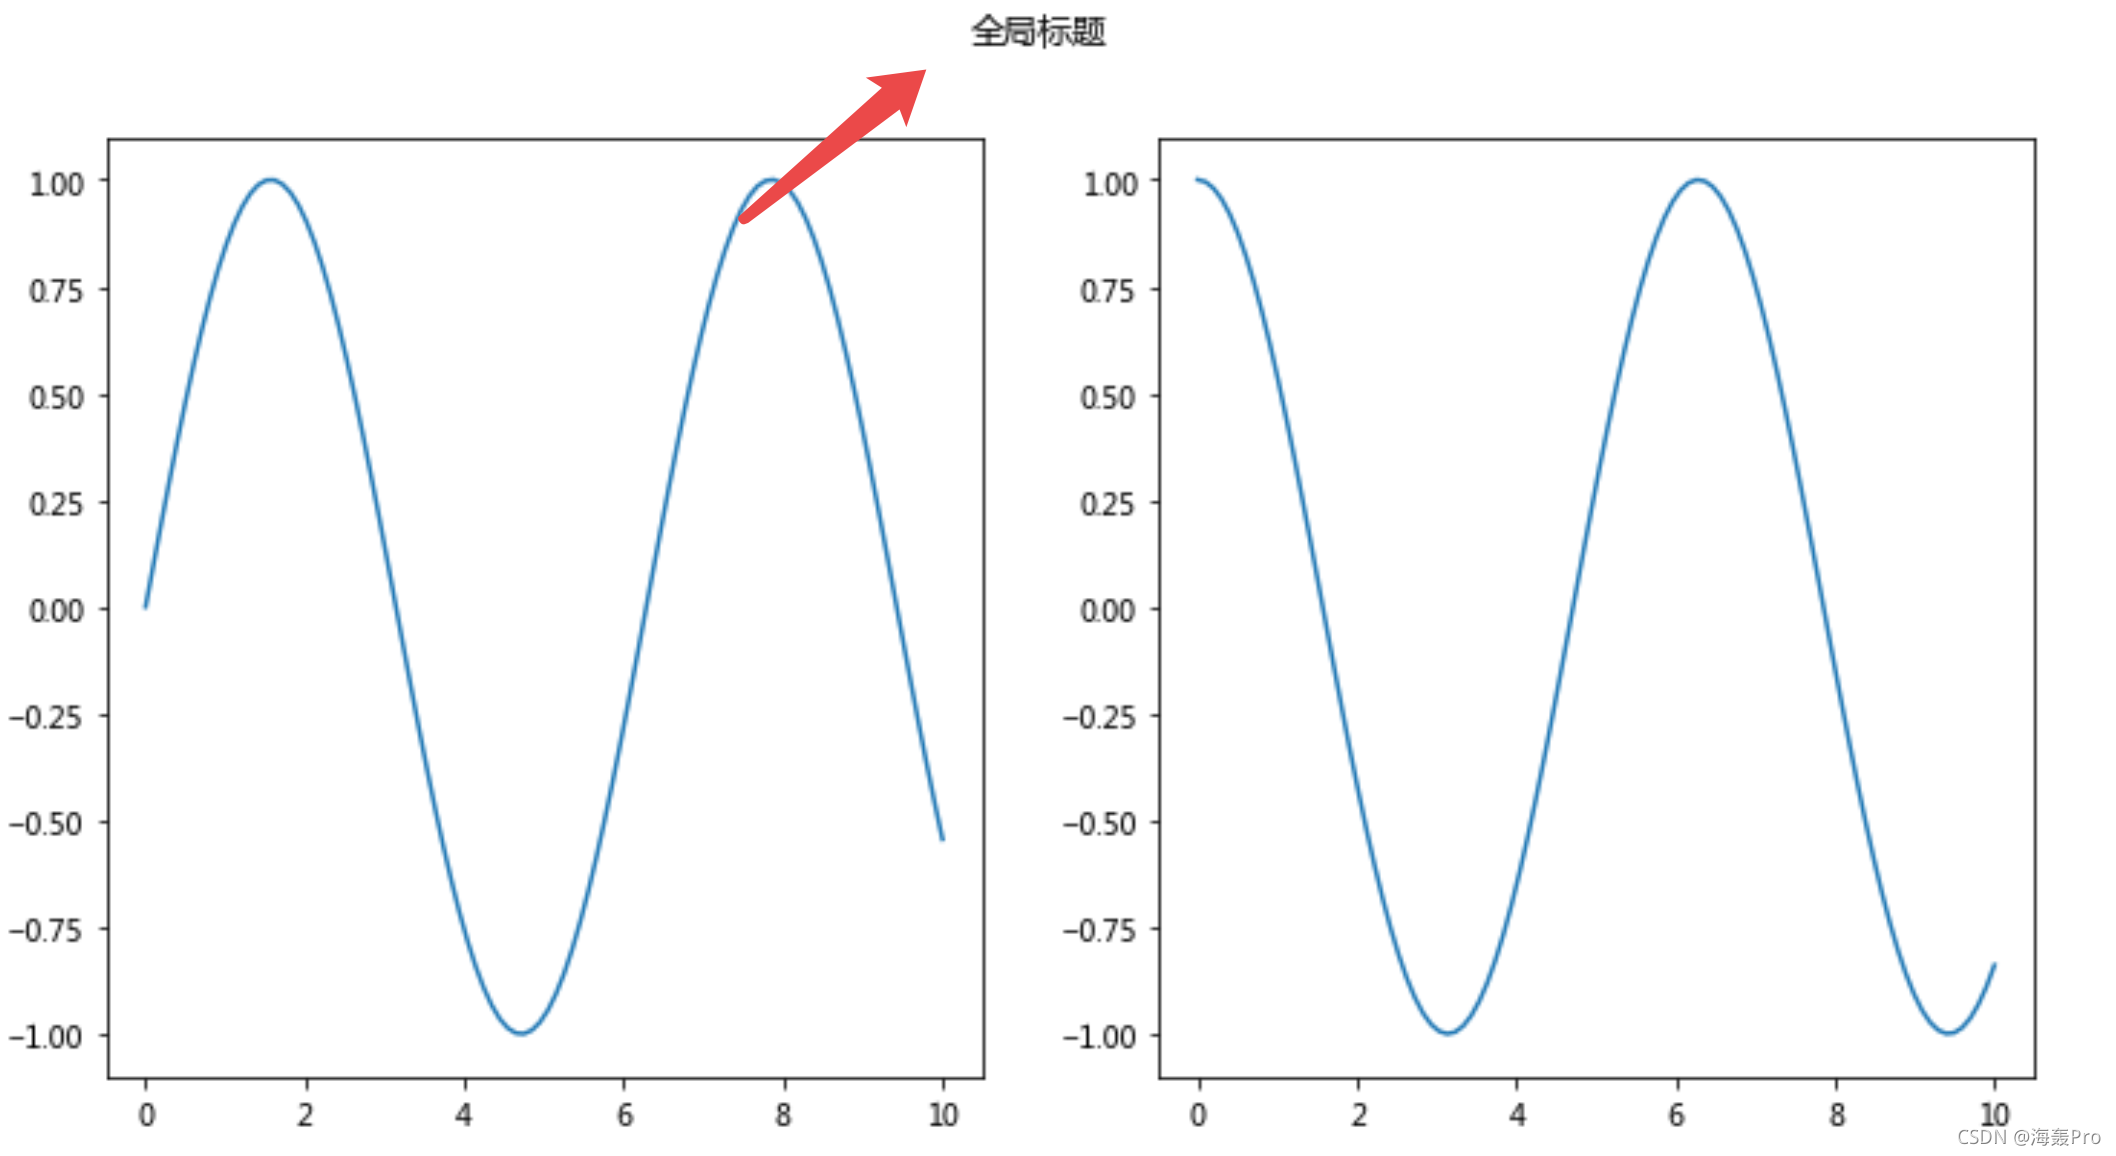
pyplot.suptitle() 用于设置整个区域的标题(多个子图的情况下)
import numpy as np
import matplotlib
import matplotlib.pyplot as plt

# 配置中文(这里依据自己的实际情况而定)
font = {
    "family": "Microsoft YaHei"
}
matplotlib.rc("font", **font)

x = np.linspace(0,10,100)
y = np.sin(x)
z = np.cos(x)

plt.figure(figsize=(12,6))

plt.suptitle("全局标题")  # 全局标题

# 子图1
plt.subplot(1,2,1)
plt.plot(x,y)

# 子图2
plt.subplot(1,2,2)
plt.plot(x,z)

plt.show()
- 1
- 2
- 3
- 4
- 5
- 6
- 7
- 8
- 9
- 10
- 11
- 12
- 13
- 14
- 15
- 16
- 17
- 18
- 19
- 20
- 21
- 22
- 23
- 24
- 25
- 26
- 27
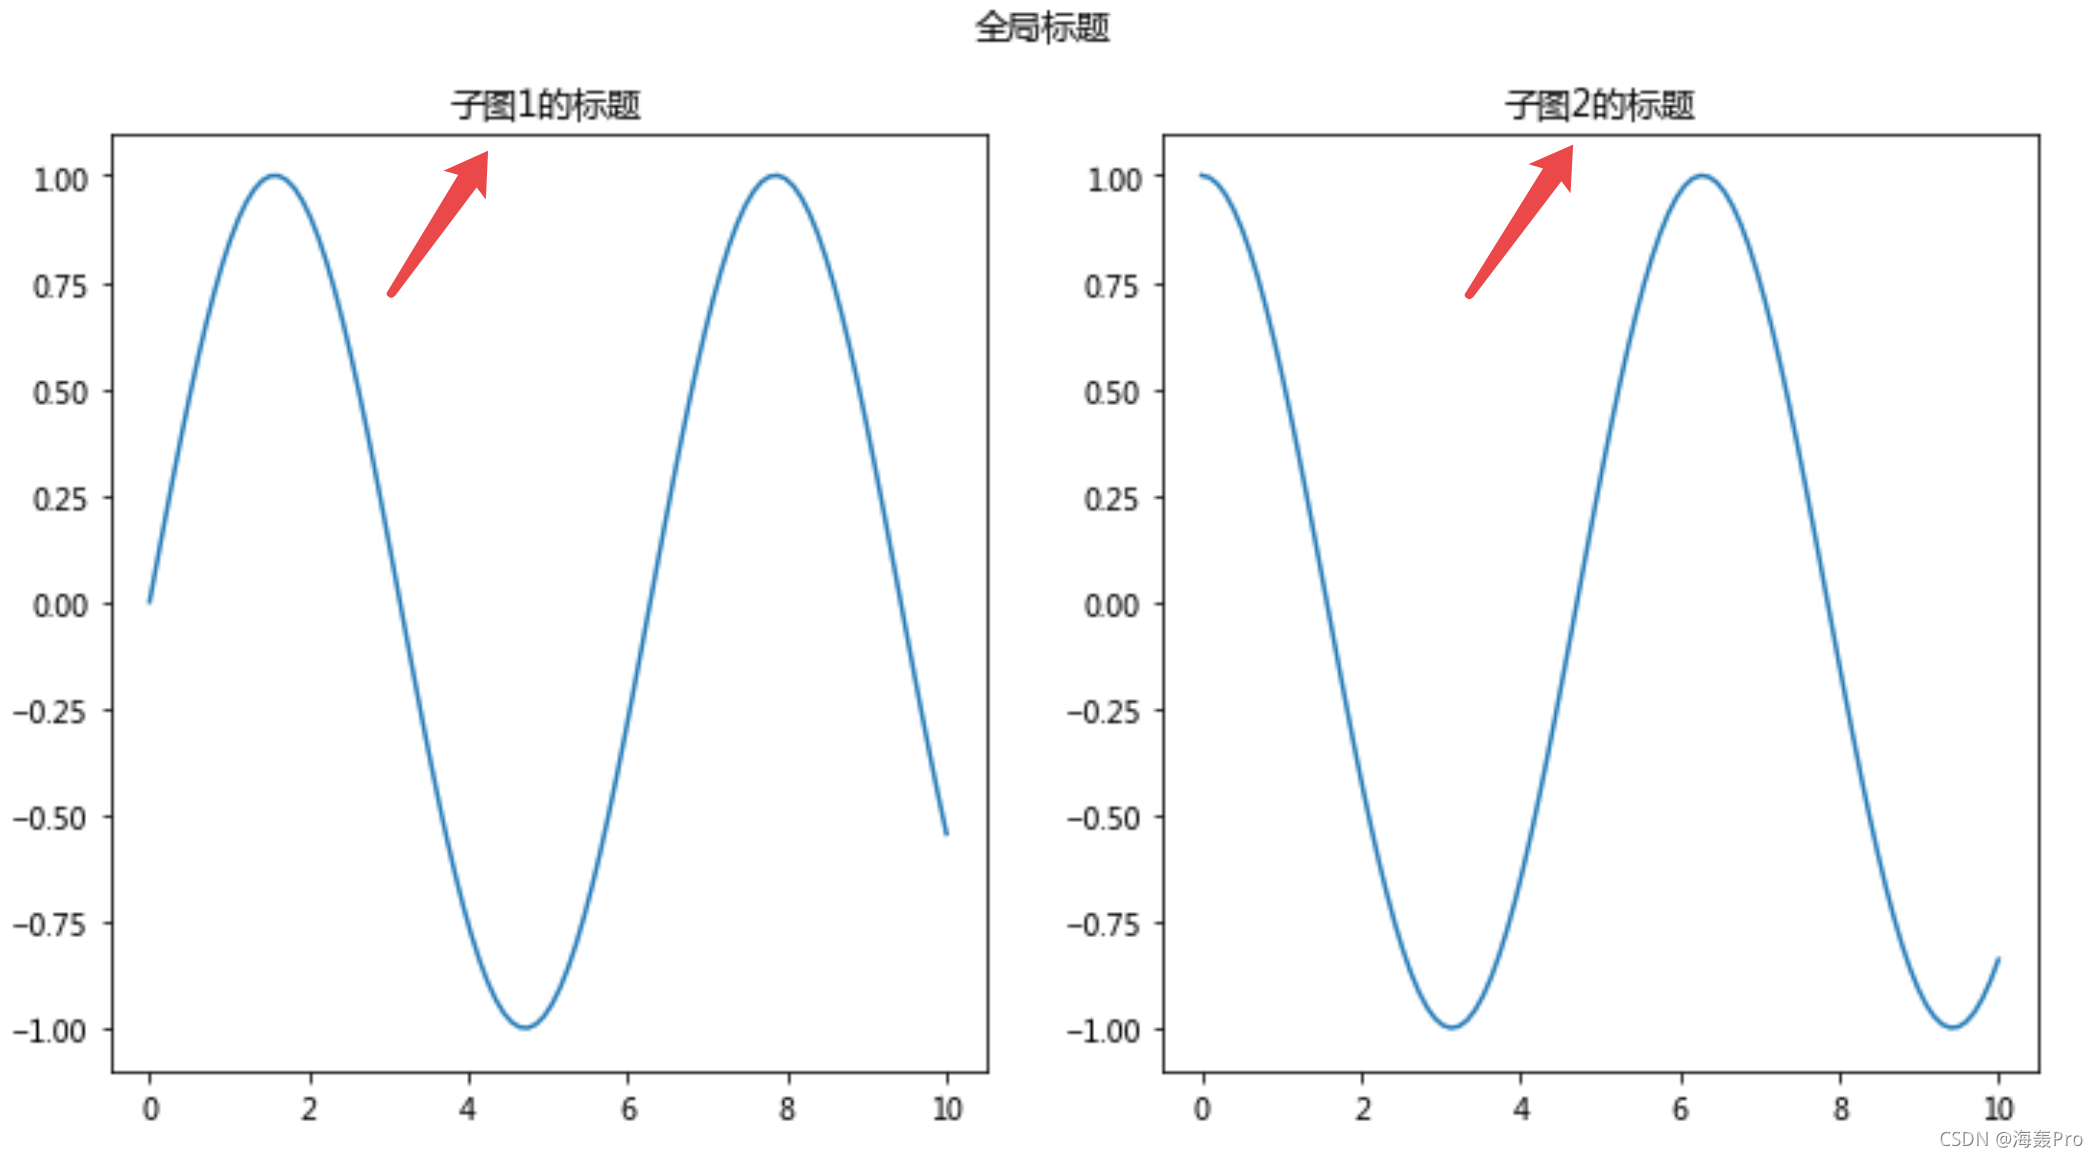
分别设置每个子图的标题
ax = plt.subplot(122)
ax.set_title("子图2的标题")
- 1
- 2
Demo代码
import numpy as np
import matplotlib
import matplotlib.pyplot as plt

# 配置中文(这里依据自己的实际情况而定)
font = {
    "family": "Microsoft YaHei"
}
matplotlib.rc("font", **font)

x = np.linspace(0,10,100)
y = np.sin(x)
z = np.cos(x)

plt.figure(figsize=(12,6))

plt.suptitle("全局标题")  # 全局标题

# 子图1
plt.subplot(1,2,1)
ax = plt.subplot(121)
ax.set_title("子图1的标题")
plt.plot(x,y)

# 子图2
plt.subplot(1,2,2)
ax = plt.subplot(122)
ax.set_title("子图2的标题")
plt.plot(x,z)

plt.show()
- 1
- 2
- 3
- 4
- 5
- 6
- 7
- 8
- 9
- 10
- 11
- 12
- 13
- 14
- 15
- 16
- 17
- 18
- 19
- 20
- 21
- 22
- 23
- 24
- 25
- 26
- 27
- 28
- 29
- 30
- 31
注: 还可以这样写 ax = plt.subplot(221+i)
3 pyplot.legend( )
作用:为图像加图例
首先需要在plt.plot( )中的参数label=’’“设置图例的名称
Demo代码
import numpy as np
import matplotlib
import matplotlib.pyplot as plt

# 配置中文(这里依据自己的实际情况而定)
font = {
    "family": "Microsoft YaHei"
}
matplotlib.rc("font", **font)

x = np.linspace(0,10,100)
y = np.sin(x)
z = np.cos(x)

plt.plot(x,y,label="sin(x)")# 图例名称有:sin(x)
plt.plot(x,z,label="cos(x)")# 图例名称有:cos(x)
plt.legend()# 添加图例

plt.show()
- 1
- 2
- 3
- 4
- 5
- 6
- 7
- 8
- 9
- 10
- 11
- 12
- 13
- 14
- 15
- 16
- 17
- 18
- 19

文章来源: haihong.blog.csdn.net,作者:海轰Pro,版权归原作者所有,如需转载,请联系作者。
原文链接:haihong.blog.csdn.net/article/details/119866518

- 点赞
- 收藏
- 关注作者
评论(0)