性能监控之Telegraf+InfluxDB+Grafana window服务器安装使用
前言
本文主要介绍 Telegraf 在 window 上安装及监控入门
安装&部署
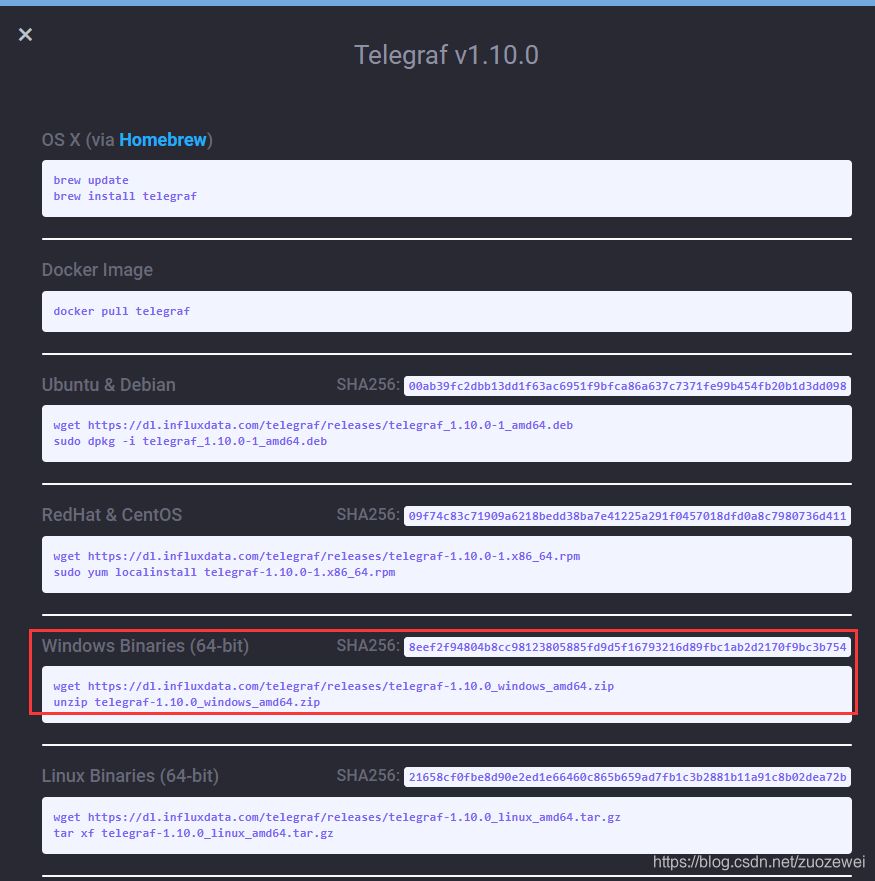
1.找到下载地址:https://portal.influxdata.com/downloads/

2.创建目录 C:\Program Files\Telegraf(如果安装在其他位置,请指定 -config 具有所需位置的参数)
3.解压软件包,将文件 telegraf.exe 和 telegraf.conf 文件放入 C:\Program Files\Telegraf

4.要将服务安装 到Windows 服务管理器中,以管理员身份在 CMD 中运行以下命令。如有必要,可以用双引号将文件目录中的任何空格换行 "<file directory>":
C:\"Program Files"\Telegraf\telegraf.exe --service install
或者
C:\Program Files\Telegraf>telegraf.exe --service install

5.编辑 telegraf.conf 配置文件以满足要求。
###############################################################################
#                                  INPUTS                                     #
###############################################################################

# Windows Performance Counters plugin.
# These are the recommended method of monitoring system metrics on windows,
# as the regular system plugins (inputs.cpu, inputs.mem, etc.) rely on WMI,
# which utilize more system resources.
#
# See more configuration examples at:
#   https://github.com/influxdata/telegraf/tree/master/plugins/inputs/win_perf_counters

[[inputs.win_perf_counters]]
  [[inputs.win_perf_counters.object]]
    # Processor usage, alternative to native, reports on a per core.
    ObjectName = "Processor"
    Instances = ["*"]
    Counters = [
      "% Idle Time",
      "% Interrupt Time",
      "% Privileged Time",
      "% User Time",
      "% Processor Time",
      "% DPC Time",
    ]
    Measurement = "win_cpu"
    # Set to true to include _Total instance when querying for all (*).
    IncludeTotal=true

  [[inputs.win_perf_counters.object]]
    # Disk times and queues
    ObjectName = "LogicalDisk"
    Instances = ["*"]
    Counters = [
      "% Idle Time",
      "% Disk Time",
      "% Disk Read Time",
      "% Disk Write Time",
      "Current Disk Queue Length",
      "% Free Space",
      "Free Megabytes",
    ]
    Measurement = "win_disk"
    # Set to true to include _Total instance when querying for all (*).
    #IncludeTotal=false

  [[inputs.win_perf_counters.object]]
    ObjectName = "PhysicalDisk"
    Instances = ["*"]
    Counters = [
      "Disk Read Bytes/sec",
      "Disk Write Bytes/sec",
      "Current Disk Queue Length",
      "Disk Reads/sec",
      "Disk Writes/sec",
      "% Disk Time",
      "% Disk Read Time",
      "% Disk Write Time",
    ]
    Measurement = "win_diskio"

  [[inputs.win_perf_counters.object]]
    ObjectName = "Network Interface"
    Instances = ["*"]
    Counters = [
      "Bytes Received/sec",
      "Bytes Sent/sec",
      "Packets Received/sec",
      "Packets Sent/sec",
      "Packets Received Discarded",
      "Packets Outbound Discarded",
      "Packets Received Errors",
      "Packets Outbound Errors",
    ]
    Measurement = "win_net"

  [[inputs.win_perf_counters.object]]
    ObjectName = "System"
    Counters = [
      "Context Switches/sec",
      "System Calls/sec",
      "Processor Queue Length",
      "System Up Time",
    ]
    Instances = ["------"]
    Measurement = "win_system"
    # Set to true to include _Total instance when querying for all (*).
    #IncludeTotal=false

  [[inputs.win_perf_counters.object]]
    # Example query where the Instance portion must be removed to get data back,
    # such as from the Memory object.
    ObjectName = "Memory"
    Counters = [
      "Available Bytes",
      "Cache Faults/sec",
      "Demand Zero Faults/sec",
      "Page Faults/sec",
      "Pages/sec",
      "Transition Faults/sec",
      "Pool Nonpaged Bytes",
      "Pool Paged Bytes",
      "Standby Cache Reserve Bytes",
      "Standby Cache Normal Priority Bytes",
      "Standby Cache Core Bytes",

    ]
    # Use 6 x - to remove the Instance bit from the query.
    Instances = ["------"]
    Measurement = "win_mem"
    # Set to true to include _Total instance when querying for all (*).
    #IncludeTotal=false

  [[inputs.win_perf_counters.object]]
    # Example query where the Instance portion must be removed to get data back,
    # such as from the Paging File object.
    ObjectName = "Paging File"
    Counters = [
      "% Usage",
    ]
    Instances = ["_Total"]
    Measurement = "win_swap"
6.要验证它是否有效,请运行:
C:\"Program Files"\Telegraf\telegraf.exe --config C:\"Program Files"\Telegraf\telegraf.conf --test
或者
C:\Program Files\Telegraf>telegraf.exe --config telegraf.conf --test
要开始收集数据,请运行:
net start telegraf
7.其他操作
telegraf 可以通过 --service 管理自己的服务:
telegraf.exe --service install		#安装服务
telegraf.exe --service uninstall	#删除服务
telegraf.exe --service start		#启动服务
telegraf.exe --service stop			#停止服务
集成Influxdb
找到 OUTPUTS 配置项
###############################################################################
#                                  OUTPUTS                                    #
###############################################################################

# Configuration for sending metrics to InfluxDB
[[outputs.influxdb]]
  ## The full HTTP or UDP URL for your InfluxDB instance.
  ##
  ## Multiple URLs can be specified for a single cluster, only ONE of the
  ## urls will be written to each interval.
  # urls = ["unix:///var/run/influxdb.sock"]
  # urls = ["udp://127.0.0.1:8089"]
  urls = ["http://172.16.14.111:8086"]

  ## The target database for metrics; will be created as needed.
  database = "bigscreen"

  ## If true, no CREATE DATABASE queries will be sent.  Set to true when using
  ## Telegraf with a user without permissions to create databases or when the
  ## database already exists.
  # skip_database_creation = false

  ## Name of existing retention policy to write to.  Empty string writes to
  ## the default retention policy.  Only takes effect when using HTTP.
  # retention_policy = ""

  ## Write consistency (clusters only), can be: "any", "one", "quorum", "all".
  ## Only takes effect when using HTTP.
  # write_consistency = "any"

  ## Timeout for HTTP messages.
  timeout = "5s"

  ## HTTP Basic Auth
   username = "telegraf"
   password = "telegraf"

  ## HTTP User-Agent
  # user_agent = "telegraf"

  ## UDP payload size is the maximum packet size to send.
  # udp_payload = "512B"

  ## Optional TLS Config for use on HTTP connections.
  # tls_ca = "/etc/telegraf/ca.pem"
  # tls_cert = "/etc/telegraf/cert.pem"
  # tls_key = "/etc/telegraf/key.pem"
  ## Use TLS but skip chain & host verification
  # insecure_skip_verify = false

  ## HTTP Proxy override, if unset values the standard proxy environment
  ## variables are consulted to determine which proxy, if any, should be used.
  # http_proxy = "http://corporate.proxy:3128"

  ## Additional HTTP headers
  # http_headers = {"X-Special-Header" = "Special-Value"}

  ## HTTP Content-Encoding for write request body, can be set to "gzip" to
  ## compress body or "identity" to apply no encoding.
  # content_encoding = "identity"

  ## When true, Telegraf will output unsigned integers as unsigned values,
  ## i.e.: "42u".  You will need a version of InfluxDB supporting unsigned
  ## integer values.  Enabling this option will result in field type errors if
  ## existing data has been written.
  # influx_uint_support = false
验证数据库
[root@localhost tools]# sudo influx
Connected to http://localhost:8086 version 1.7.4
InfluxDB shell version: 1.7.4
Enter an InfluxQL query
> use bigscreen
Using database bigscreen
> SHOW MEASUREMENTS
name: measurements
name
----
bigscreen
nvidia_smi
win_cpu
win_disk
win_diskio
win_mem
win_net
win_perf_counters
win_swap
win_system
> SELECT * FROM "win_cpu" limit 1
name: win_cpu
time                Percent_DPC_Time Percent_Idle_Time Percent_Interrupt_Time Percent_Privileged_Time Percent_Processor_Time Percent_User_Time  host            instance objectname
----                ---------------- ----------------- ---------------------- ----------------------- ---------------------- -----------------  ----            -------- ----------
1552012501000000000 0                81.72647857666016 0                      4.6642279624938965      9.824928283691406      4.6642279624938965 DESKTOP-MLD0KTS 0        Processor
集成Grafana Dashboard
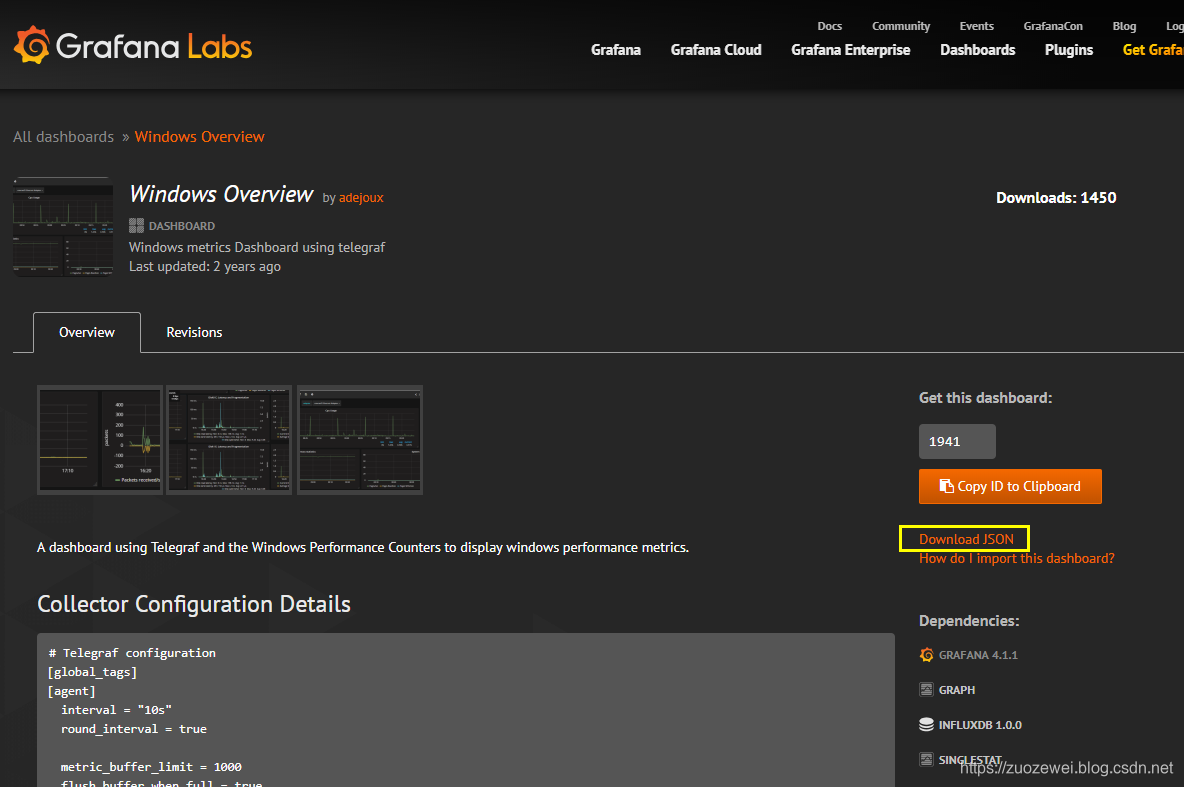
访问 https://grafana.com/dashboards?dataSource=influxdb&collector=Telegraf&search=window 下载一个合适的 Dashboard 模版

Grafana 导入 Dashboard 模版
具体请参考 性能监控之Telegraf+InfluxDB+Grafana服务器实时监控
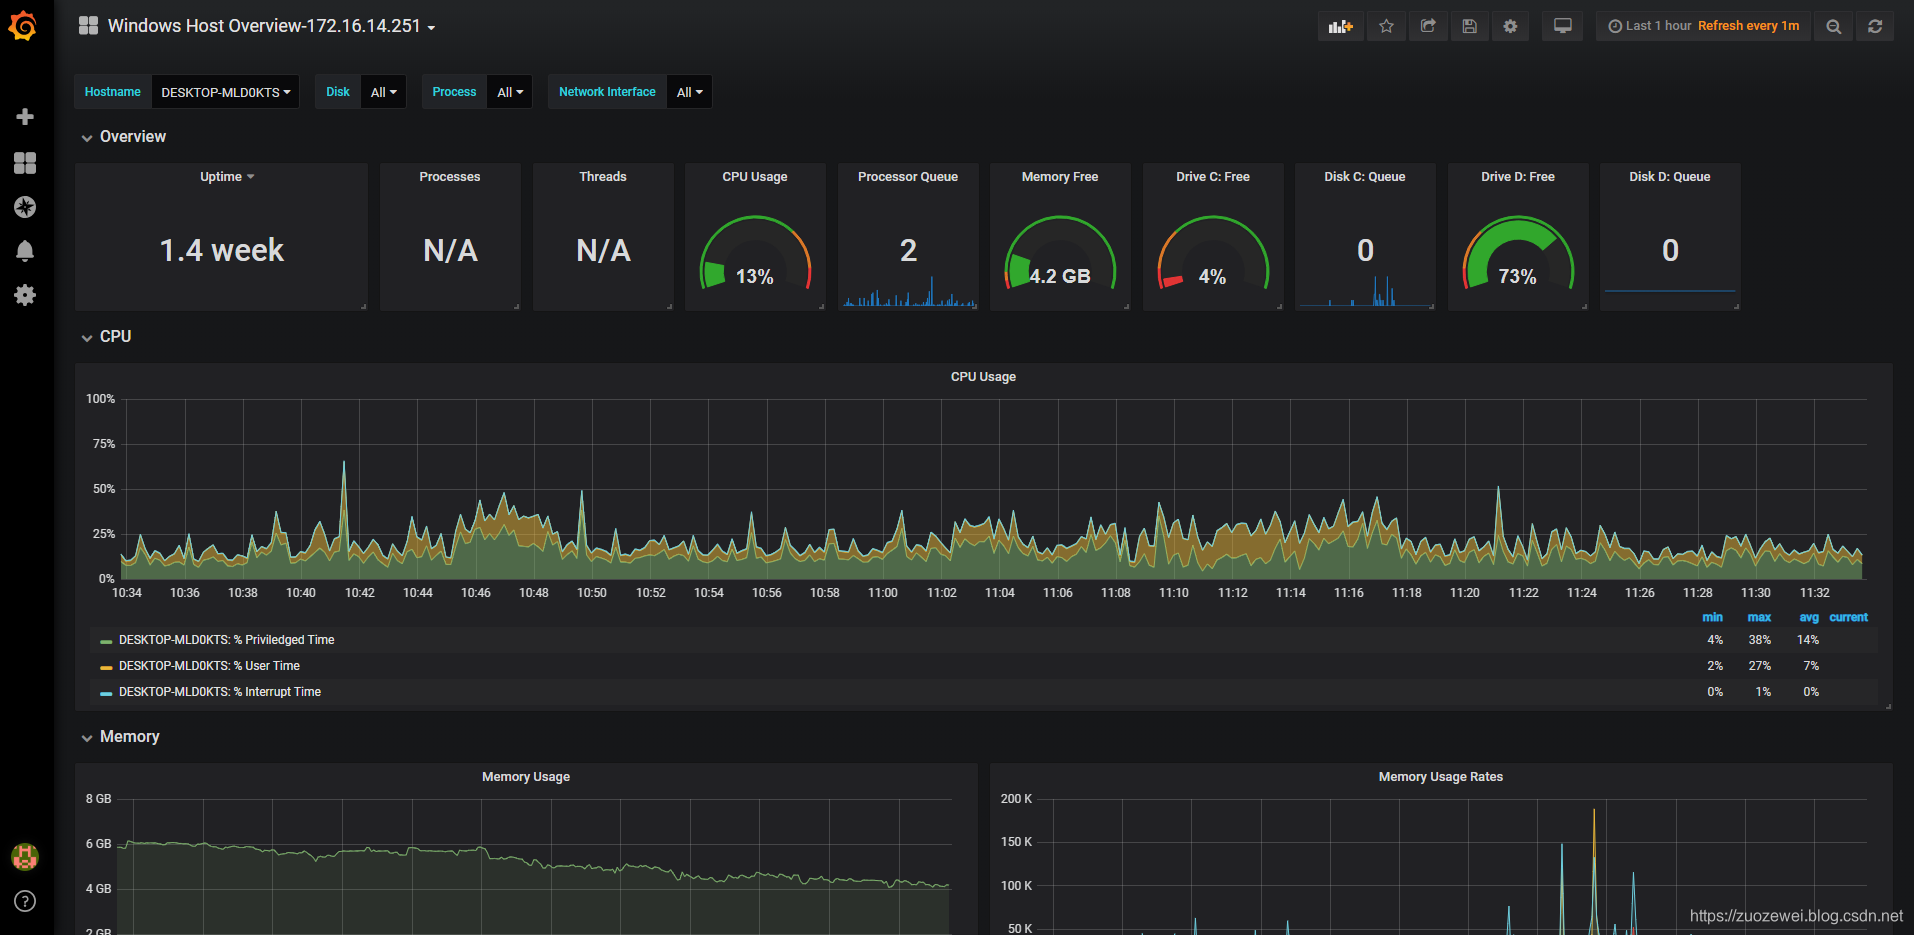
监控效果
Grafana Dashboard 最终效果如下:

相关资料:
延伸阅读:
- 点赞
- 收藏
- 关注作者


评论(0)