决策树如何可视化

【摘要】 如果不能将一棵决策树可视化,我觉的很难学好决策树这一部分
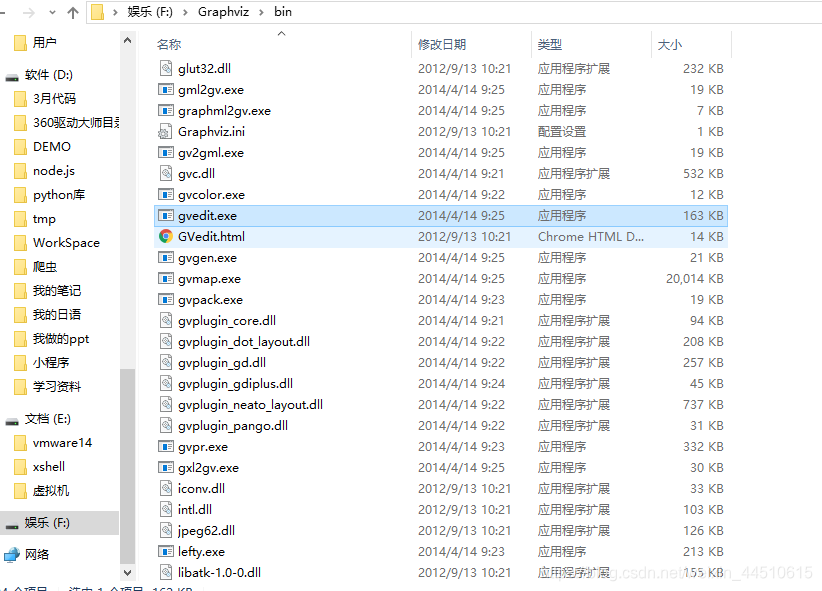
安装好Graphviz
为什么要安装呢
因为要使用sklearn自带的 export_graphviz
http://www.graphviz.org/
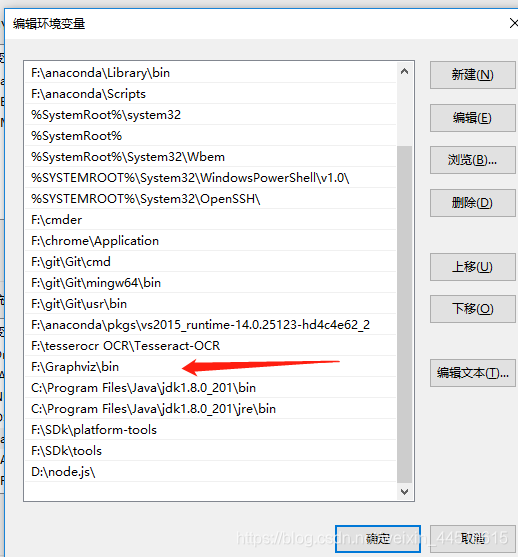
设置环境变量
pip install pydotplus
测试一下
# -*- coding:utf-8 -*-
# time :201...
如果不能将一棵决策树可视化,我觉的很难学好决策树这一部分
安装好Graphviz
为什么要安装呢
因为要使用sklearn自带的 export_graphviz
设置环境变量
pip install pydotplus
测试一下
# -*- coding:utf-8 -*-
# time :2019/4/18 13:33
# author: 毛利
from sklearn.model_selection import train_test_split
import pandas as pd
from sklearn.tree import DecisionTreeClassifier
from sklearn import datasets
from sklearn import tree
from sklearn.metrics import accuracy_score
import pydotplus
iris = datasets.load_iris()
iris_feature = '花萼长度', '花萼宽度', '花瓣长度', '花瓣宽度'
iris_feature_E = 'sepal length', 'sepal width', 'petal length', 'petal width'
iris_class = 'Iris-setosa', 'Iris-versicolor', 'Iris-virginica'
x = pd.DataFrame(iris['data'])[[0,1]]
y = pd.Series(iris[ 'target'])
x_train,x_test,y_train,y_test = train_test_split(x,y)
model = DecisionTreeClassifier()
model.fit(x_train,y_train)
y_train_pred = model.predict(x_train)
print('训练集正确率:', accuracy_score(y_train, y_train_pred))
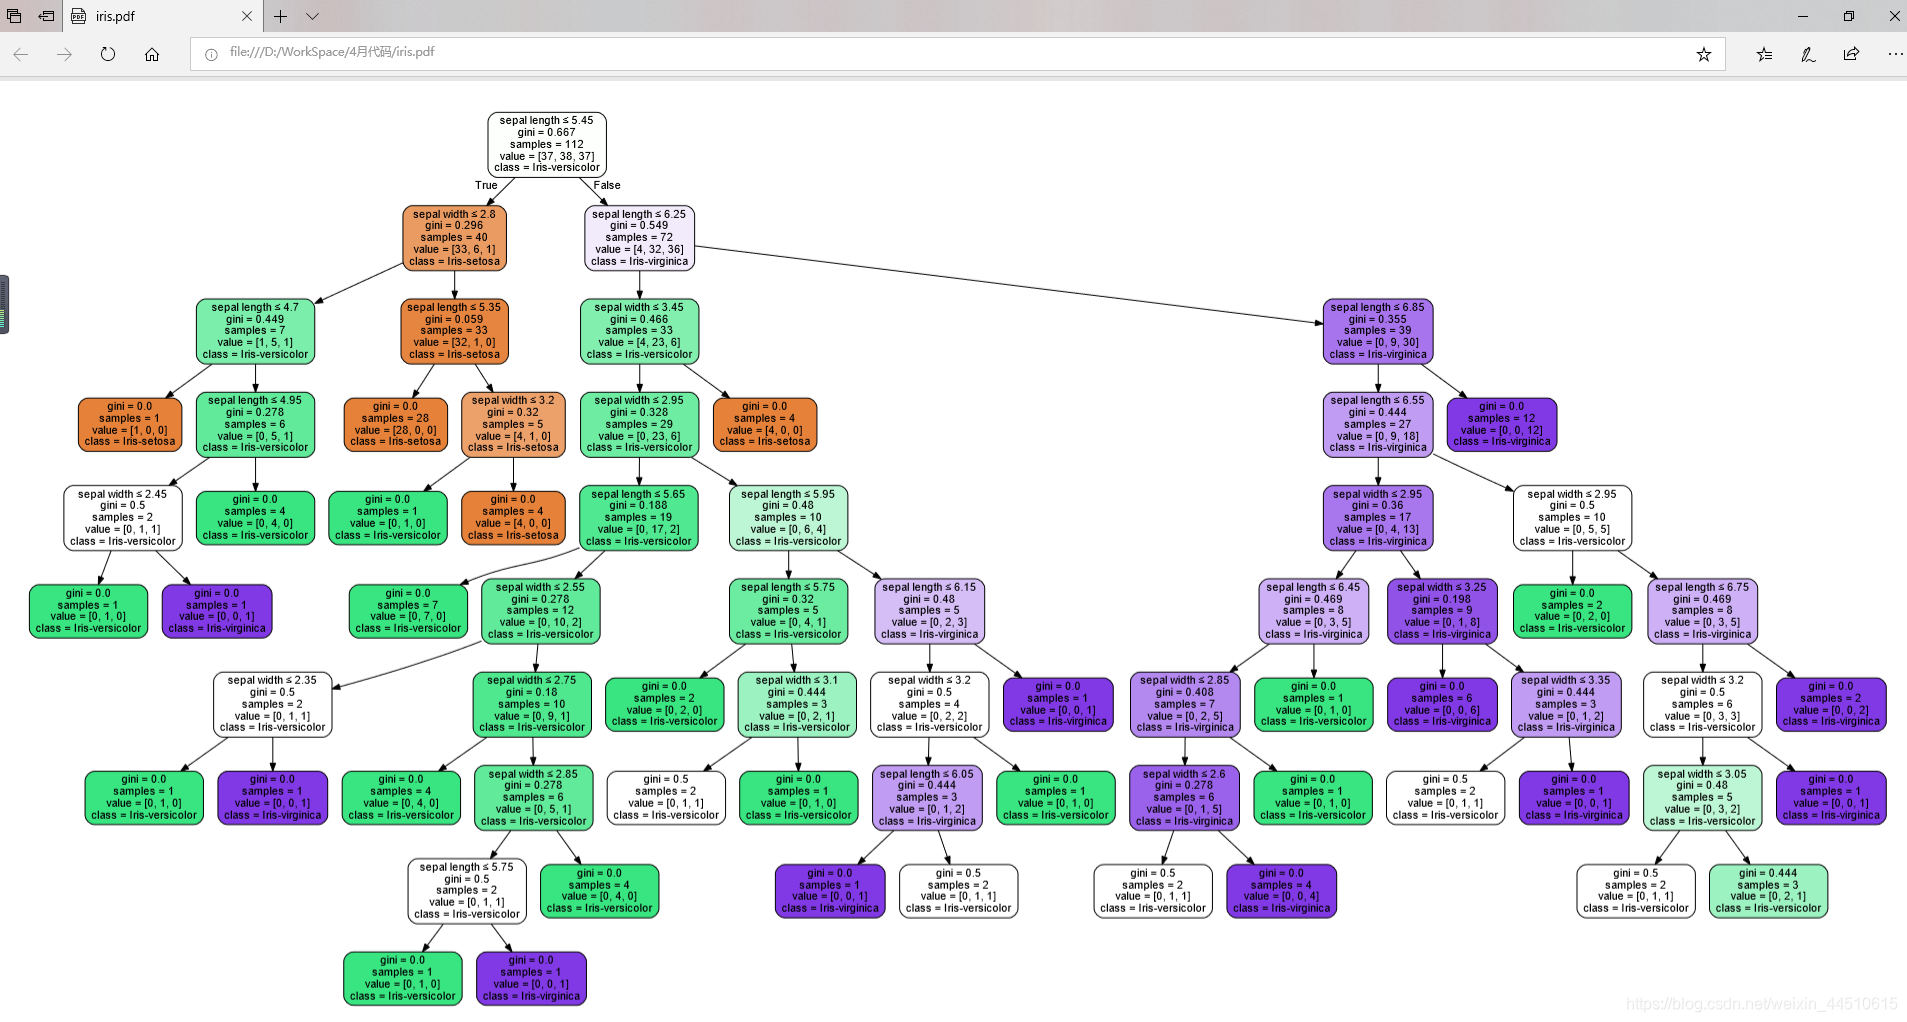
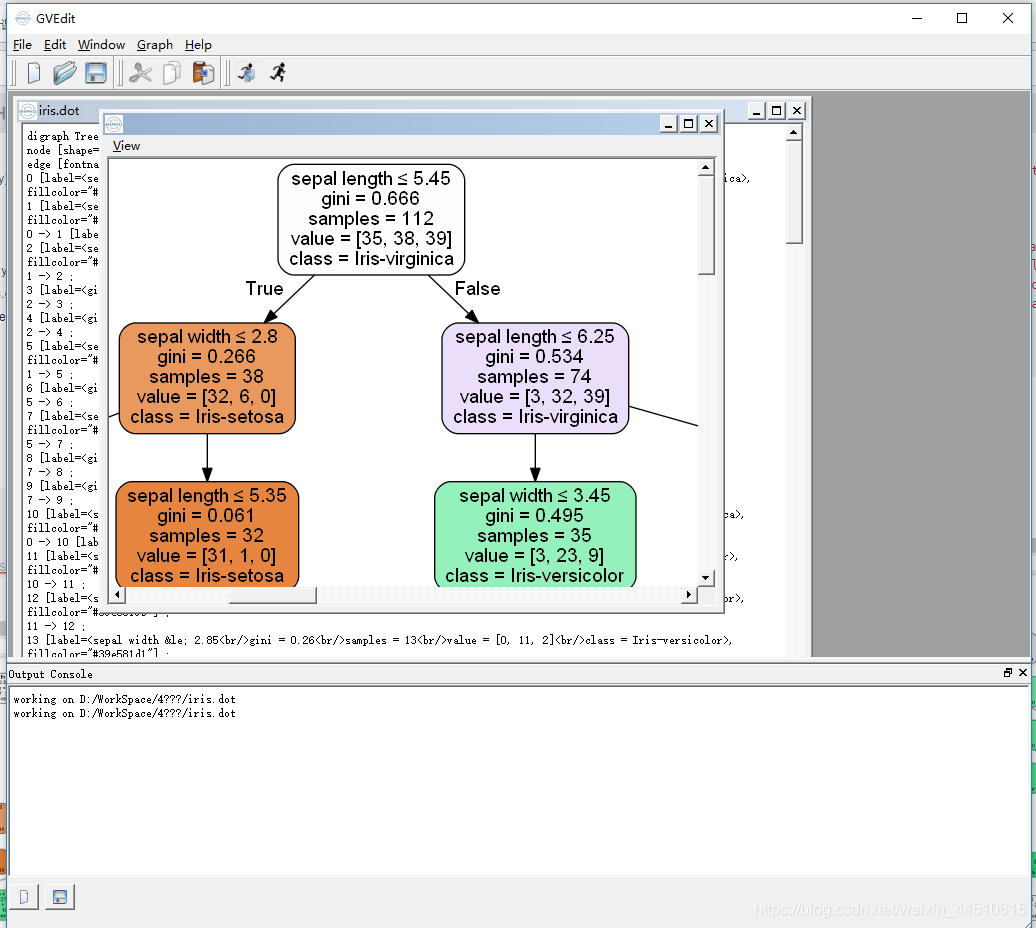
data = tree.export_graphviz(model, out_file='iris.dot', feature_names= iris_feature_E[0:2], class_names=iris_class, filled=True, rounded=True, special_characters=True)
graph = pydotplus.graph_from_dot_data(data)
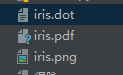
graph.write_pdf('iris.pdf')
with open('iris.png', 'wb') as f: f.write(graph.create_png())、 import numpy as np
from sklearn.tree import DecisionTreeClassifier
import pydotplus
from sklearn import tree
X = np.array([[2, 2], [2, 1], [2, 3], [1, 2], [1, 1], [3, 3]])
y = np.array([0, 1, 1, 1, 0, 1])
plt.style.use('fivethirtyeight')
plt.rcParams['font.size'] = 18
plt.figure(figsize=(8, 8))
# Plot each point as the label
for x1, x2, label in zip(X[:, 0], X[:, 1], y): plt.text(x1, x2, str(label), fontsize=40, color='g', ha='center', va='center')
plt.grid(None)
plt.xlim((0, 3.5))
plt.ylim((0, 3.5))
plt.xlabel('x1', size=20)
plt.ylabel('x2', size=20)
plt.title('Data', size=24)
# plt.show() dec_tree = DecisionTreeClassifier()
print(dec_tree)
dec_tree.fit(X, y)
print(dec_tree.score(X,y))
# Export as dot
dot_data = tree.export_graphviz(dec_tree, out_file=None, feature_names=['x1', 'x2'], class_names=['0', '1'], filled=True, rounded=True, special_characters=True)
graph = pydotplus.graph_from_dot_data(dot_data)
with open('1.png', 'wb') as f: f.write(graph.create_png())
- 1
- 2
- 3
- 4
- 5
- 6
- 7
- 8
- 9
- 10
- 11
- 12
- 13
- 14
- 15
- 16
- 17
- 18
- 19
- 20
- 21
- 22
- 23
- 24
- 25
- 26
- 27
- 28
- 29
- 30
- 31
- 32
- 33
- 34
- 35
- 36
- 37
- 38
- 39
- 40
- 41
- 42
- 43
- 44
- 45
- 46
- 47
- 48
- 49
- 50
- 51
- 52
- 53
- 54
- 55
- 56
- 57
- 58
- 59
- 60
- 61
- 62
- 63
- 64
- 65
- 66
- 67
- 68
- 69
- 70
- 71
- 72
- 73
- 74
- 75
- 76
这是export_graphviz源代码加快理解
def export_graphviz(decision_tree, out_file=SENTINEL, max_depth=None, feature_names=None, class_names=None, label='all', filled=False, leaves_parallel=False, impurity=True, node_ids=False, proportion=False, rotate=False, rounded=False, special_characters=False, precision=3): """Export a decision tree in DOT format. This function generates a GraphViz representation of the decision tree, which is then written into `out_file`. Once exported, graphical renderings can be generated using, for example:: $ dot -Tps tree.dot -o tree.ps (PostScript format) $ dot -Tpng tree.dot -o tree.png (PNG format) The sample counts that are shown are weighted with any sample_weights that might be present. Read more in the :ref:`User Guide <tree>`. Parameters ---------- decision_tree : decision tree classifier The decision tree to be exported to GraphViz. out_file : file object or string, optional (default='tree.dot') Handle or name of the output file. If ``None``, the result is returned as a string. This will the default from version 0.20. max_depth : int, optional (default=None) The maximum depth of the representation. If None, the tree is fully generated. feature_names : list of strings, optional (default=None) Names of each of the features. class_names : list of strings, bool or None, optional (default=None) Names of each of the target classes in ascending numerical order. Only relevant for classification and not supported for multi-output. If ``True``, shows a symbolic representation of the class name. label : {'all', 'root', 'none'}, optional (default='all') Whether to show informative labels for impurity, etc. Options include 'all' to show at every node, 'root' to show only at the top root node, or 'none' to not show at any node. filled : bool, optional (default=False) When set to ``True``, paint nodes to indicate majority class for classification, extremity of values for regression, or purity of node for multi-output. leaves_parallel : bool, optional (default=False) When set to ``True``, draw all leaf nodes at the bottom of the tree. impurity : bool, optional (default=True) When set to ``True``, show the impurity at each node. node_ids : bool, optional (default=False) When set to ``True``, show the ID number on each node. proportion : bool, optional (default=False) When set to ``True``, change the display of 'values' and/or 'samples' to be proportions and percentages respectively. rotate : bool, optional (default=False) When set to ``True``, orient tree left to right rather than top-down. rounded : bool, optional (default=False) When set to ``True``, draw node boxes with rounded corners and use Helvetica fonts instead of Times-Roman. special_characters : bool, optional (default=False) When set to ``False``, ignore special characters for PostScript compatibility. precision : int, optional (default=3) Number of digits of precision for floating point in the values of impurity, threshold and value attributes of each node. Returns ------- dot_data : string String representation of the input tree in GraphViz dot format. Only returned if ``out_file`` is None. .. versionadded:: 0.18
- 1
- 2
- 3
- 4
- 5
- 6
- 7
- 8
- 9
- 10
- 11
- 12
- 13
- 14
- 15
- 16
- 17
- 18
- 19
- 20
- 21
- 22
- 23
- 24
- 25
- 26
- 27
- 28
- 29
- 30
- 31
- 32
- 33
- 34
- 35
- 36
- 37
- 38
- 39
- 40
- 41
- 42
- 43
- 44
- 45
- 46
- 47
- 48
- 49
- 50
- 51
- 52
- 53
- 54
- 55
- 56
- 57
- 58
- 59
- 60
- 61
- 62
- 63
- 64
- 65
- 66
- 67
- 68
- 69
- 70
- 71
- 72
- 73
- 74
- 75
- 76
- 77
- 78
- 79
- 80
- 81
- 82
- 83
- 84
- 85
文章来源: maoli.blog.csdn.net,作者:刘润森!,版权归原作者所有,如需转载,请联系作者。
原文链接:maoli.blog.csdn.net/article/details/89378091

【版权声明】本文为华为云社区用户转载文章,如果您发现本社区中有涉嫌抄袭的内容,欢迎发送邮件进行举报,并提供相关证据,一经查实,本社区将立刻删除涉嫌侵权内容,举报邮箱:
cloudbbs@huaweicloud.com
- 点赞
- 收藏
- 关注作者
评论(0)