R语言作方差分析

【摘要】 #单因素方差分析
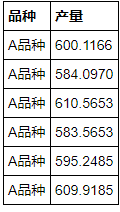
rice_yields <- read.csv(file = './data/rice_yields.csv',header = TRUE)
head(rice_yields)
123
R语言中的回归诊断-- car包
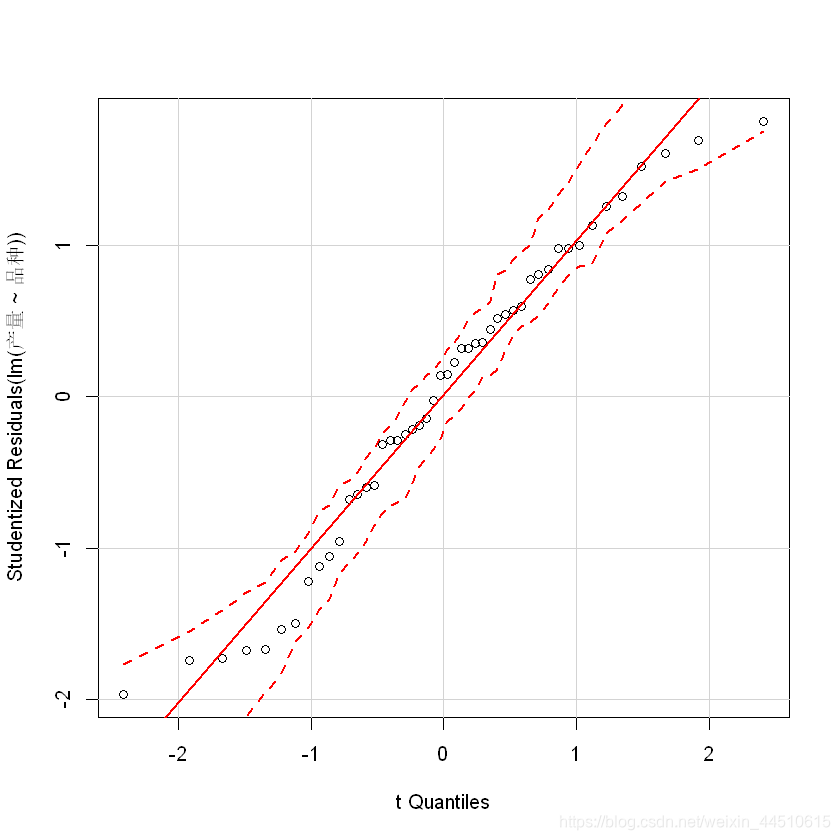
#通过QQ图来检验正态性
install.packages('car',repos = 'https://mirrors...
#单因素方差分析
rice_yields <- read.csv(file = './data/rice_yields.csv',header = TRUE)
head(rice_yields)
- 1
- 2
- 3
R语言中的回归诊断-- car包
#通过QQ图来检验正态性
install.packages('car',repos = 'https://mirrors.ustc.edu.cn/CRAN/')
- 1
- 2
library(car)
with(rice_yields,qqPlot(lm(产量~品种)))
- 1
- 2
=#检查方差齐性
bartlett.test(rice_yields$产量~rice_yields$品种)
- 1
- 2
data:  rice_yields$产量 by rice_yields$品种
Bartlett's K-squared = 2.0554, df = 7, p-value = 0.9567
- 1
- 2
- 3
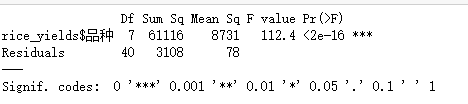
#进行方差分析
result_rice<-aov(rice_yields$产量~rice_yields$品种)
summary(result_rice)
- 1
- 2
- 3
install.packages('gplots',repos = 'https://mirrors.ustc.edu.cn/CRAN/')
- 1
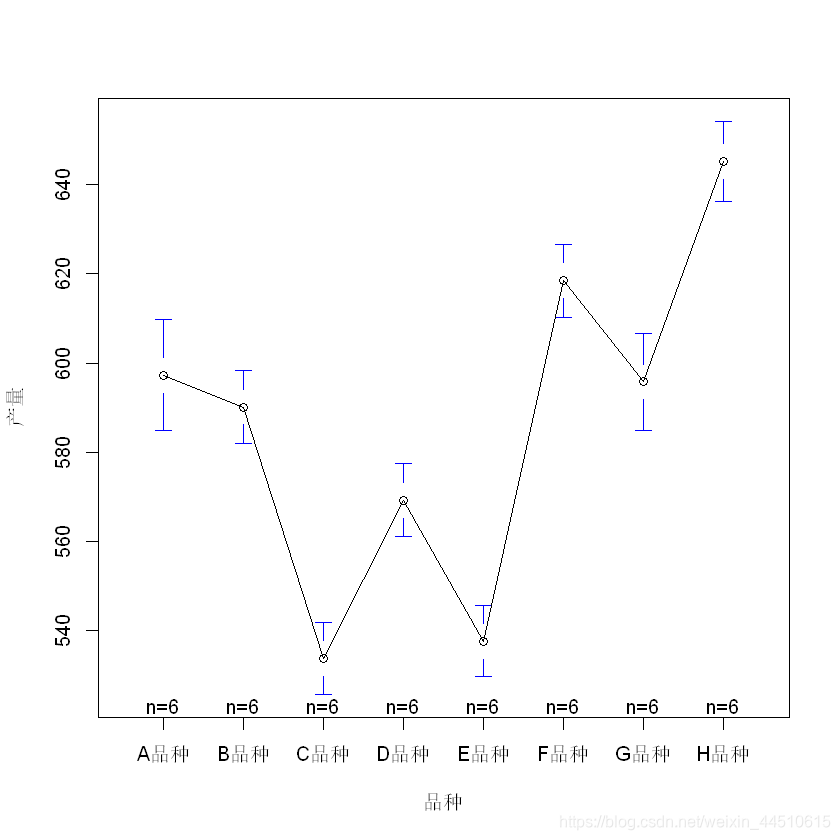
#绘制均值图
library(gplots)
plotmeans(产量~品种,data = rice_yields)
- 1
- 2
- 3
文章来源: maoli.blog.csdn.net,作者:刘润森!,版权归原作者所有,如需转载,请联系作者。
原文链接:maoli.blog.csdn.net/article/details/99695935

【版权声明】本文为华为云社区用户转载文章,如果您发现本社区中有涉嫌抄袭的内容,欢迎发送邮件进行举报,并提供相关证据,一经查实,本社区将立刻删除涉嫌侵权内容,举报邮箱:
cloudbbs@huaweicloud.com
- 点赞
- 收藏
- 关注作者
评论(0)