OpenCV | OpenCV彩色图像直方图算法实现

【摘要】 彩色图像直方图和灰度图像直方图的原理是一样的,不同的是彩色图像需要分别计算BGR三个通道。
Cerasus.JPG
import cv2import numpy as npimport matplotlib.pyplot as plt img = cv2.imread('Cerasus.JPG', 1)imgInfo = img.shape...
彩色图像直方图和灰度图像直方图的原理是一样的,不同的是彩色图像需要分别计算BGR三个通道。
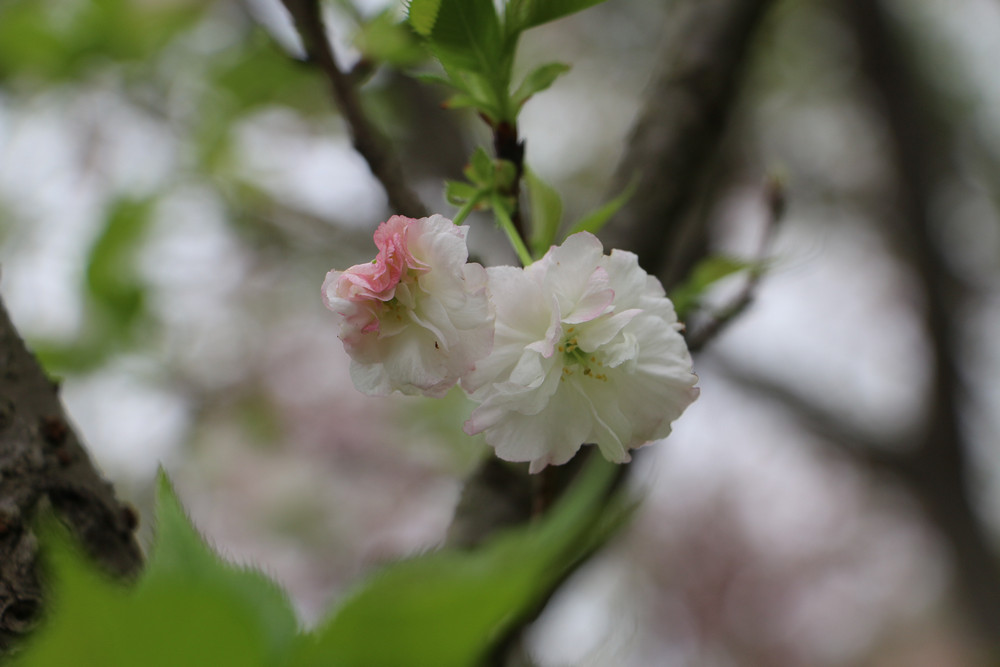 Cerasus.JPG
-
import cv2
-
import numpy as np
-
import matplotlib.pyplot as plt
-
-
img = cv2.imread('Cerasus.JPG', 1)
-
imgInfo = img.shape
-
height = imgInfo[0]
-
width = imgInfo[1]
-
-
count_b = np.zeros(256, np.float)
-
count_g = np.zeros(256, np.float)
-
count_r = np.zeros(256, np.float)
-
-
for i in range(height):
-
for j in range(width):
-
(b, g, r) = img[i, j]
-
index_b = int(b)
-
index_g = int(g)
-
index_r = int(r)
-
count_b[index_b] = count_b[index_b] + 1
-
count_g[index_g] = count_g[index_g] + 1
-
count_r[index_r] = count_r[index_r] + 1
-
-
# 计算每一个通道的概率
-
total = height * width
-
count_b = count_b / total
-
count_g = count_g / total
-
count_r = count_r / total
-
-
# 绘图
-
x = np.linspace(0, 256, 256)
-
-
y1 = count_b
-
plt.figure()
-
plt.bar( x, y1, 0.9, alpha = 1, color = 'b' )
-
-
y2 = count_g
-
plt.figure()
-
plt.bar( x, y2, 0.9, alpha = 1, color = 'g' )
-
-
y3 = count_r
-
plt.figure()
-
plt.bar( x, y3, 0.9, alpha = 1, color = 'r' )
-
-
plt.show()
-
-
cv2.waitKey(0)
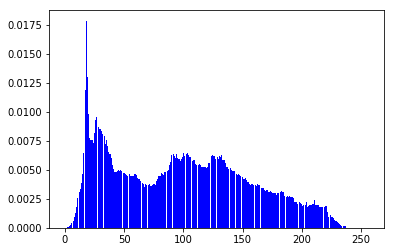
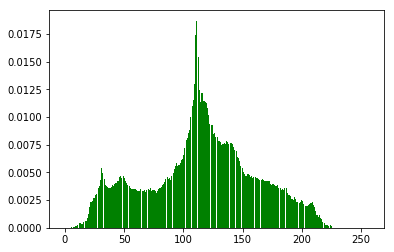
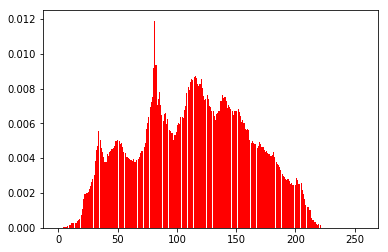
三个通道直方图如下:
文章来源: drugai.blog.csdn.net,作者:DrugAI,版权归原作者所有,如需转载,请联系作者。
原文链接:drugai.blog.csdn.net/article/details/102993952

【版权声明】本文为华为云社区用户转载文章,如果您发现本社区中有涉嫌抄袭的内容,欢迎发送邮件进行举报,并提供相关证据,一经查实,本社区将立刻删除涉嫌侵权内容,举报邮箱:
cloudbbs@huaweicloud.com
- 点赞
- 收藏
- 关注作者
评论(0)