Python进阶(三十八)-数据可视化の利用matplotlib 进行折线图,直方图和饼图的绘制

【摘要】 #Python进阶(三十八)-数据可视化の利用matplotlib 进行折线图,直方图和饼图的绘制 我用10个国家某年的GDP来绘图,数据如下: labels = [‘USA’, ‘China’, ‘India’, ‘Japan’, ‘Germany’, ‘Russia’, ‘Brazil’, ‘UK’, ‘France’, ‘Italy’] quants = [1...
#Python进阶(三十八)-数据可视化の利用matplotlib 进行折线图,直方图和饼图的绘制
我用10个国家某年的GDP来绘图,数据如下:
labels = [‘USA’, ‘China’, ‘India’, ‘Japan’, ‘Germany’, ‘Russia’, ‘Brazil’, ‘UK’, ‘France’, ‘Italy’]
quants = [15094025.0, 11299967.0, 4457784.0, 4440376.0, 3099080.0, 2383402.0, 2293954.0, 2260803.0, 2217900.0, 1846950.0]
##折线图绘制
首先绘制折线图,代码如下:
def draw_line(labels,quants): ind = np.linspace(0,9,10) fig = plt.figure(1) ax  = fig.add_subplot(111) ax.plot(ind,quants) ax.set_title('Top 10 GDP Countries', bbox={'facecolor':'0.8', 'pad':5}) ax.set_xticklabels(labels) plt.grid(True)

plt.show()
- 1
- 2
- 3
- 4
- 5
- 6
- 7
- 8
- 9
- 10
- 11
- 12
- 13
- 14
- 15
- 16
- 17
效果图如下图:

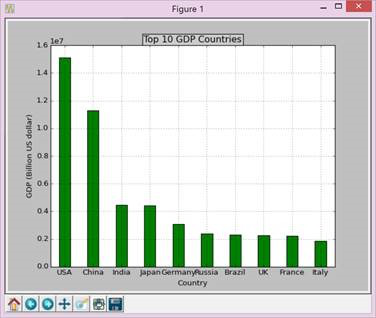
##柱状图绘制
再画柱状图,代码如下:
def draw_bar(labels,quants): width = 0.4 ind = np.linspace(0.5,9.5,10) # make a square figure fig = plt.figure(1) ax  = fig.add_subplot(111) # Bar Plot ax.bar(ind-width/2,quants,width,color='green') # Set the ticks on x-axis ax.set_xticks(ind) ax.set_xticklabels(labels) # labels ax.set_xlabel('Country') ax.set_ylabel('GDP (Billion US dollar)') # title ax.set_title('Top 10 GDP Countries', bbox={'facecolor':'0.8', 'pad':5}) plt.grid(True)

plt.show()
- 1
- 2
- 3
- 4
- 5
- 6
- 7
- 8
- 9
- 10
- 11
- 12
- 13
- 14
- 15
- 16
- 17
- 18
- 19
- 20
- 21
- 22
- 23
- 24
- 25
- 26
- 27
- 28
- 29
- 30
- 31
- 32
- 33
- 34
- 35
效果图如下图:
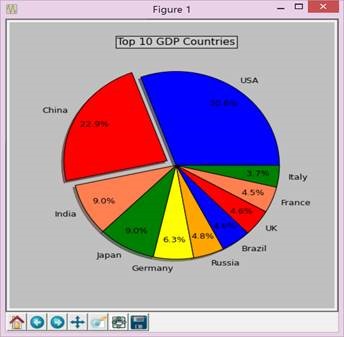
##饼图绘制
最后画饼图,代码如下:
def draw_pie(labels,quants): plt.figure(1, figsize=(6,6)) # For China, make the piece explode a bit expl = [0,0.1,0,0,0,0,0,0,0,0] # Colors used. Recycle if not enough. colors  = ["blue","red","coral","green","yellow","orange"] # autopct: format of "percent" string; plt.pie(quants, explode=expl, colors=colors, labels=labels, autopct='%1.1f%%',pctdistance=0.8, shadow=True) plt.title('Top 10 GDP Countries', bbox={'facecolor':'0.8', 'pad':5})

plt.show()
- 1
- 2
- 3
- 4
- 5
- 6
- 7
- 8
- 9
- 10
- 11
- 12
- 13
- 14
- 15
- 16
- 17
- 18
- 19
效果图如下图:
##附录:完整代码:
# -*- coding: gbk -*-

import numpy as np

import matplotlib.pyplot as plt

import matplotlib as mpl def draw_pie(labels,quants): # make a square figure plt.figure(1, figsize=(6,6)) # For China, make the piece explode a bit expl = [0,0.1,0,0,0,0,0,0,0,0] # Colors used. Recycle if not enough. colors  = ["blue","red","coral","green","yellow","orange"] # Pie Plot # autopct: format of "percent" string; plt.pie(quants, explode=expl, colors=colors, labels=labels, autopct='%1.1f%%',pctdistance=0.8, shadow=True) plt.title('Top 10 GDP Countries', bbox={'facecolor':'0.8', 'pad':5}) plt.show()

def draw_bar(labels,quants): width = 0.4 ind = np.linspace(0.5,9.5,10) # make a square figure fig = plt.figure(1) ax  = fig.add_subplot(111) # Bar Plot ax.bar(ind-width/2,quants,width,color='green') # Set the ticks on x-axis ax.set_xticks(ind) ax.set_xticklabels(labels) # labels ax.set_xlabel('Country') ax.set_ylabel('GDP (Billion US dollar)') # title ax.set_title('Top 10 GDP Countries', bbox={'facecolor':'0.8', 'pad':5}) plt.grid(True) plt.show()

def draw_line(labels,quants): ind = np.linspace(0,9,10) fig = plt.figure(1) ax  = fig.add_subplot(111) ax.plot(ind,quants) ax.set_title('Top 10 GDP Countries', bbox={'facecolor':'0.8', 'pad':5}) ax.set_xticklabels(labels) plt.grid(True) plt.show()

# quants: GDP

# labels: country name

labels   = ['USA', 'China', 'India', 'Japan', 'Germany', 'Russia', 'Brazil', 'UK', 'France', 'Italy']

quants   = [15094025.0, 11299967.0, 4457784.0, 4440376.0, 3099080.0, 2383402.0, 2293954.0, 2260803.0, 2217900.0, 1846950.0]

draw_pie(labels,quants)

#draw_bar(labels,quants)

#draw_line(labels,quants)
- 1
- 2
- 3
- 4
- 5
- 6
- 7
- 8
- 9
- 10
- 11
- 12
- 13
- 14
- 15
- 16
- 17
- 18
- 19
- 20
- 21
- 22
- 23
- 24
- 25
- 26
- 27
- 28
- 29
- 30
- 31
- 32
- 33
- 34
- 35
- 36
- 37
- 38
- 39
- 40
- 41
- 42
- 43
- 44
- 45
- 46
- 47
- 48
- 49
- 50
- 51
- 52
- 53
- 54
- 55
- 56
- 57
- 58
- 59
- 60
- 61
- 62
- 63
- 64
- 65
- 66
- 67
- 68
- 69
- 70
- 71
- 72
- 73
- 74
- 75
- 76
- 77
- 78
- 79
- 80
- 81
- 82
- 83
- 84
- 85
- 86
- 87
- 88
- 89
- 90
- 91
- 92
- 93
- 94
- 95
- 96
- 97
- 98
- 99
- 100
- 101
![这里写图片描述] (https://img-blog.csdn.net/20160927195300348?watermark/2/text/aHR0cDovL2Jsb2cuY3Nkbi5uZXQvc3VuaHVhcWlhbmcx/font/5a6L5L2T/fontsize/400/fill/I0JBQkFCMA==/dissolve/70/gravity/SouthEast)


文章来源: shq5785.blog.csdn.net,作者:No Silver Bullet,版权归原作者所有,如需转载,请联系作者。
原文链接:shq5785.blog.csdn.net/article/details/70187450

【版权声明】本文为华为云社区用户转载文章,如果您发现本社区中有涉嫌抄袭的内容,欢迎发送邮件进行举报,并提供相关证据,一经查实,本社区将立刻删除涉嫌侵权内容,举报邮箱:
cloudbbs@huaweicloud.com
- 点赞
- 收藏
- 关注作者
评论(0)